


The logical view of the current scenario. (Second part)
Analysis of microeconomic data, macroeconomic data, political data, geo-political data and monetary policy with commentary on it.

Previous logical view of the current scenario post.
United States:
The United States inflationary pressures continue to ease as the Federal Reserve’s FOMC members continue to tighten monetary policy and as supply chains continue to stabilize from the still ongoing pandemic which allows supply and demand to stabilize, a pandemic which is coming to an end as many countries are starting to reopen.
Export prices and import prices in the United States slowed as the M2 change slowed given the Quantitative Tightening which is part of the monetray policy normalization. The next chart shows the change in the consumer price index, which is directly correlated to the change in industrial production, which affects import and export prices as the variation in production increases or decreases prices given the supply and demand dynamics. The M2 change does affect goods prices given the fact that the more M2 is supplied, the higher the prices will be; the slowdown in M2 given the Quantitative Tightening affects the change in prices but in a lagged way, as can be seen on the next chart. The NBER, OECD, and Sahm Rule recession indicators are also in the chart. As explained before.
Figure 1. The statistics prove the laggard effect of the monetary policies that are working to lower inflation.
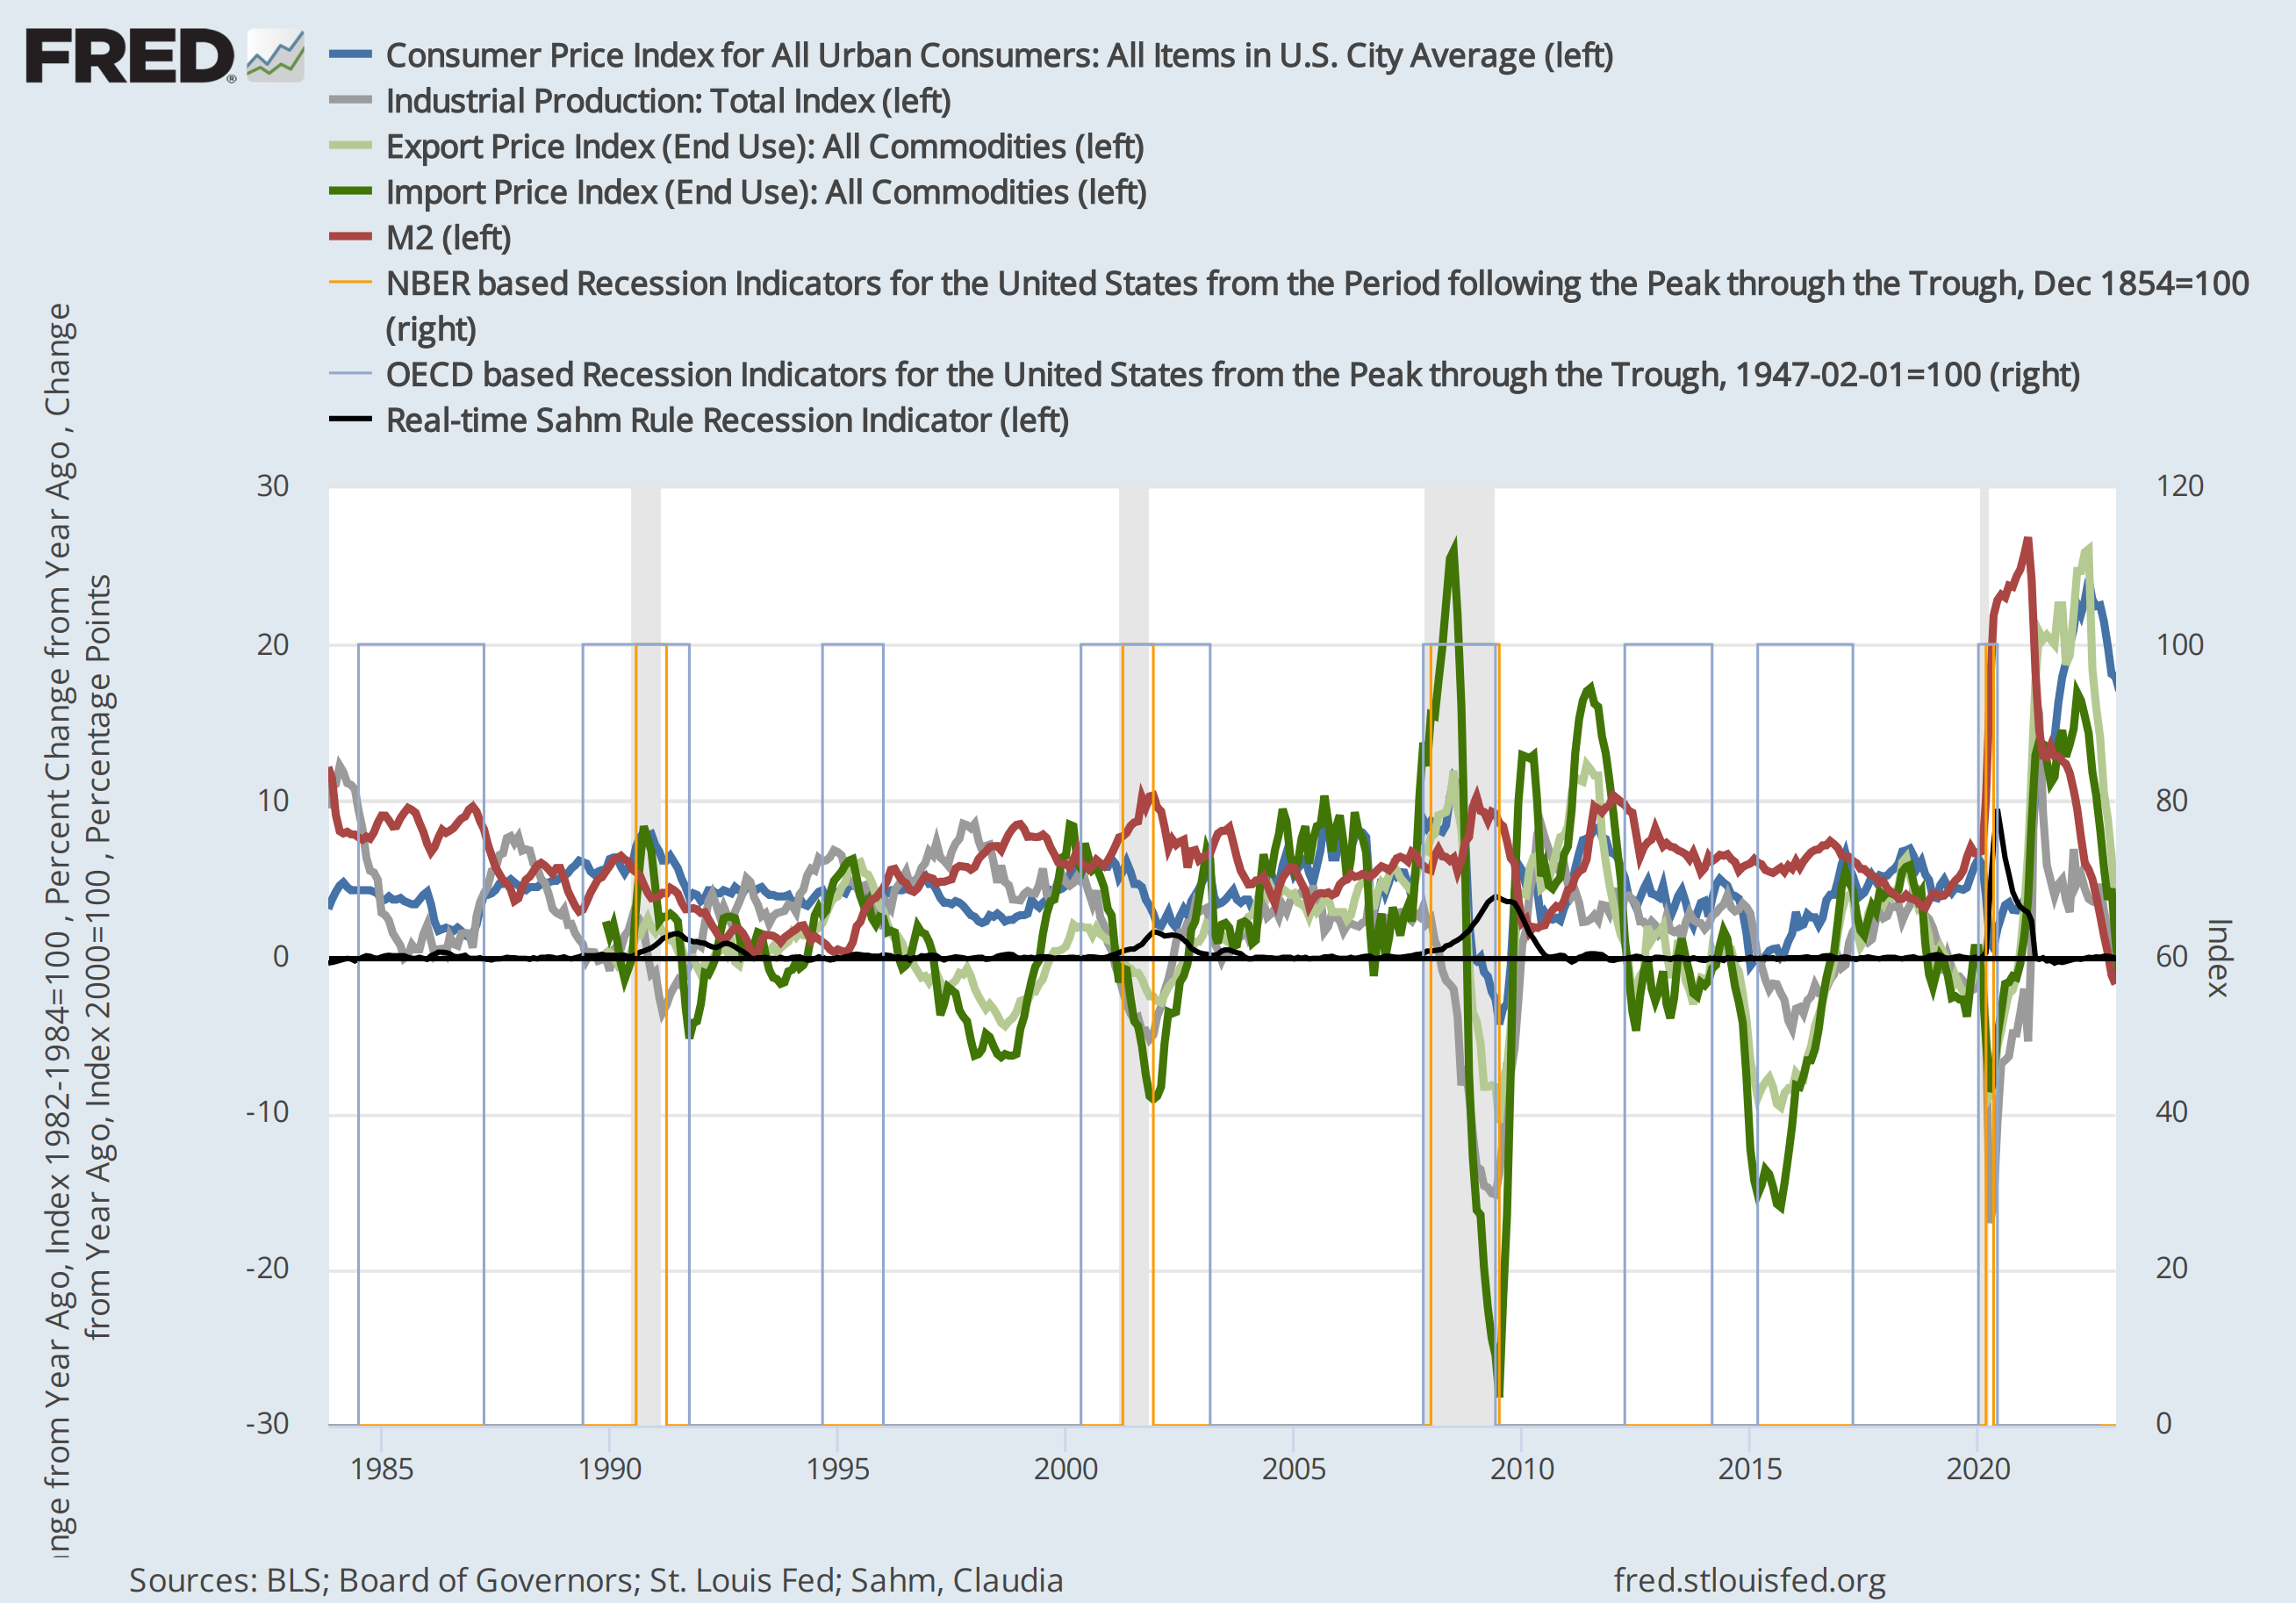
The chart shows the lagged effect of Quantitative Tightening (QT) which reduces M2 supply change thus reducing the quantity of M2 going after goods thus lowering demand side inflationary pressures as there is less demand of goods due to less M2, which affects first imports and export price statistics change, with 1 to 2 quarter(s) of lagged effect as can be clearly seen on the chart.
(…) “Inflation is caused by too much money chasing after too few goods.” (…)
- Milton Friedman
The Consumer Price Index shows deflation given by lower energy prices, while the services price inflation shown in the Consumer Price Index data shows reflation given by higher shelter and transportation prices. These price increases reflected in the Consumer Price Index data are due to the fact that consumers are paying a still high cost of fuel and energy prices, i.e., the cost increases are passed on to the consumer.
Figure 2. United States Headline Consumer Price Index Year-on-Year Percentage Change Including Topline Contributions.

Figure 3. United States Services Consumer Price Index Year-on-Year Percentage Change Including Topline Contributions.

The interest rate hiking path has reduced the speculative demand over goods, which reduced the demand and supply side inflationary pressures given the fact that by hiking interest rates the cost for access for speculation increases, thus reducing speculative price action and lowering demand side inflationary pressures, which allows supply to increase easier. The markets seem to agree with the Federal Reserve’s FOMC members' interest rate decisions and with the signaled monetary policy guidance; what isn’t coherent is the far too aggressive pivot that the market is pricing on interest rates compared with the Q4-2022 priced rate hikes and rate cuts.
Figure 4. This is where interest rates should be, by using John Taylor’s Taylor rule.
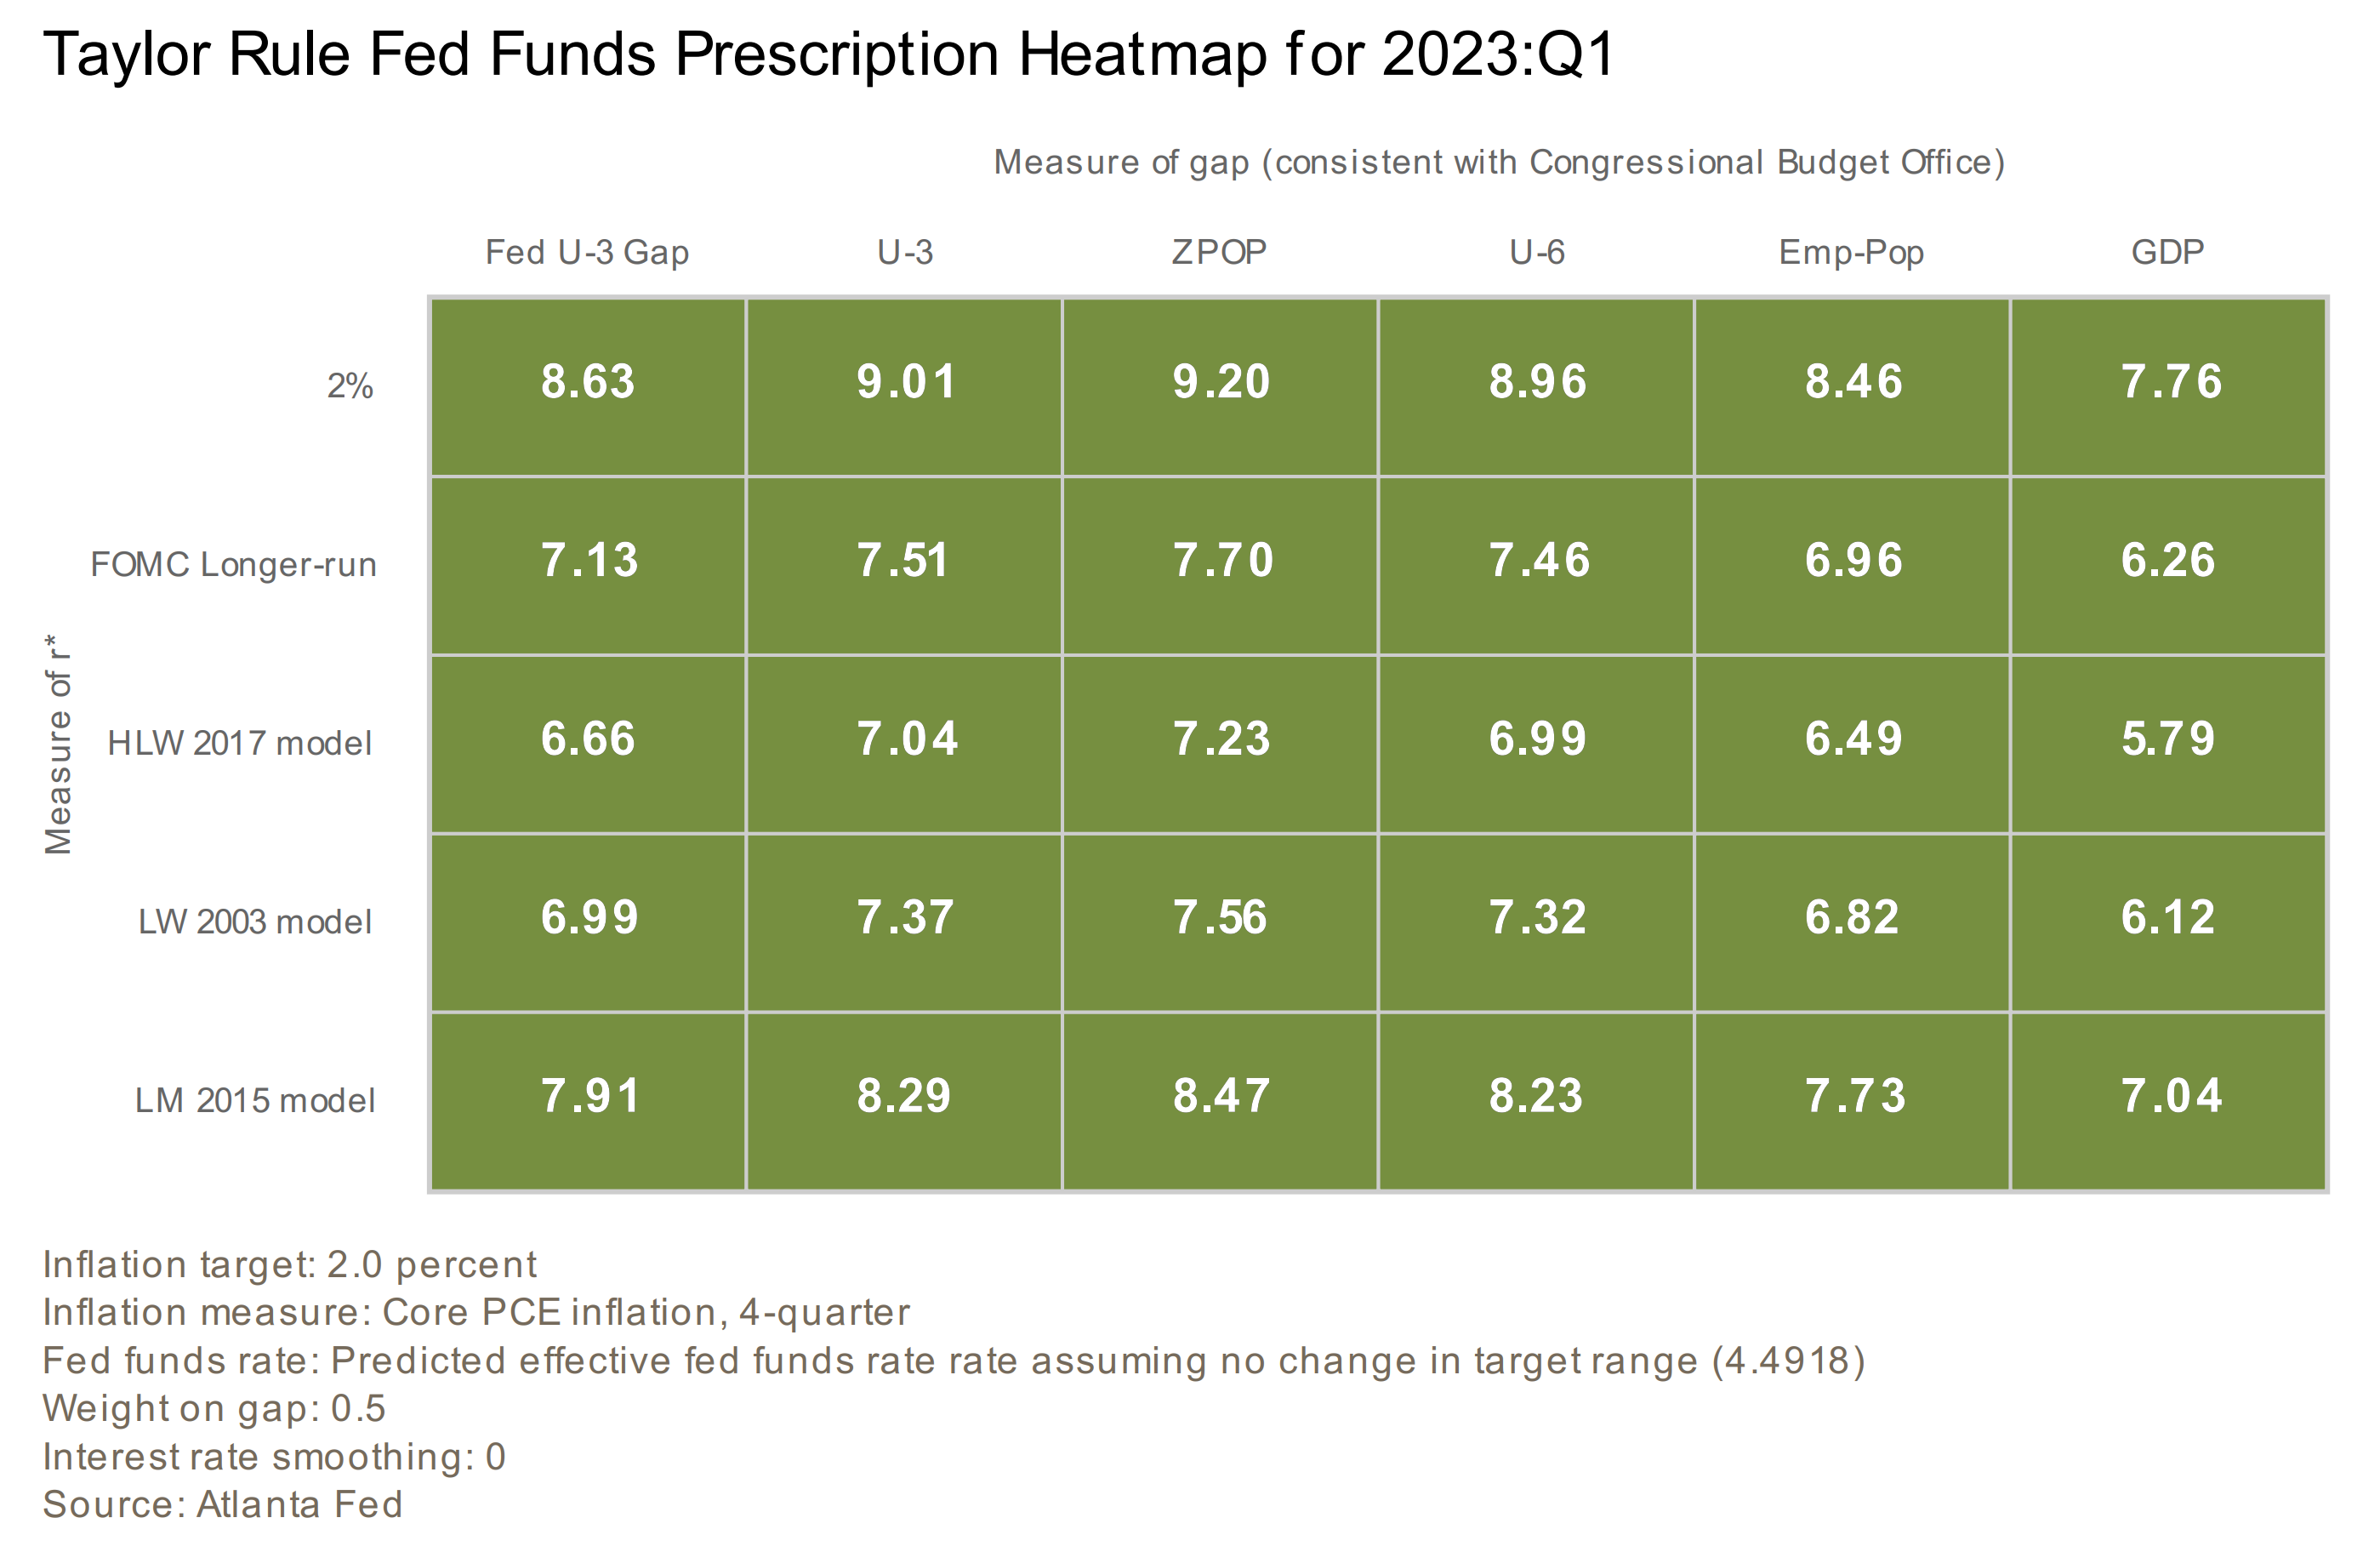
The Taylor rule is the best-known formula that prescribes how policymakers should set and adjust the short-term policy rate in response to the values of a few key economic variables.
The Federal Reserve’s interest rate decisions keep being hawkish which is coherent given a strong job market and a strong economy that allows monetary policy to keep being focused on price stability which is part of the Federal Reserve’s dual mandate. Jerome Powell’s press conferences keep being coherent, in line with previous given statements by other FOMC officials’ speeches, the hawkish but nimble monetary policy guidance proves that the Federal Reserve is focused on price stability.
- Jerome Powell
The next chart shows the FOMC rate projections, and the charts and data after it, show where interest rates should be based on seven simple monetary policy rules based on data from the Survey of Professional Forecasters, forecasts from the Congressional Budget Office (CBO),and forecasts from the Federal Reserve Bank of Cleveland (FRBC) Staff Small Bayesian Vector Autoregression (BVAR) Model.
Figure 5. FOMC projections over the Effective Federal Funds Rate.
.")
Figure 6. Summary of Federal Funds Rates Based on Seven Simple Policy Rules.
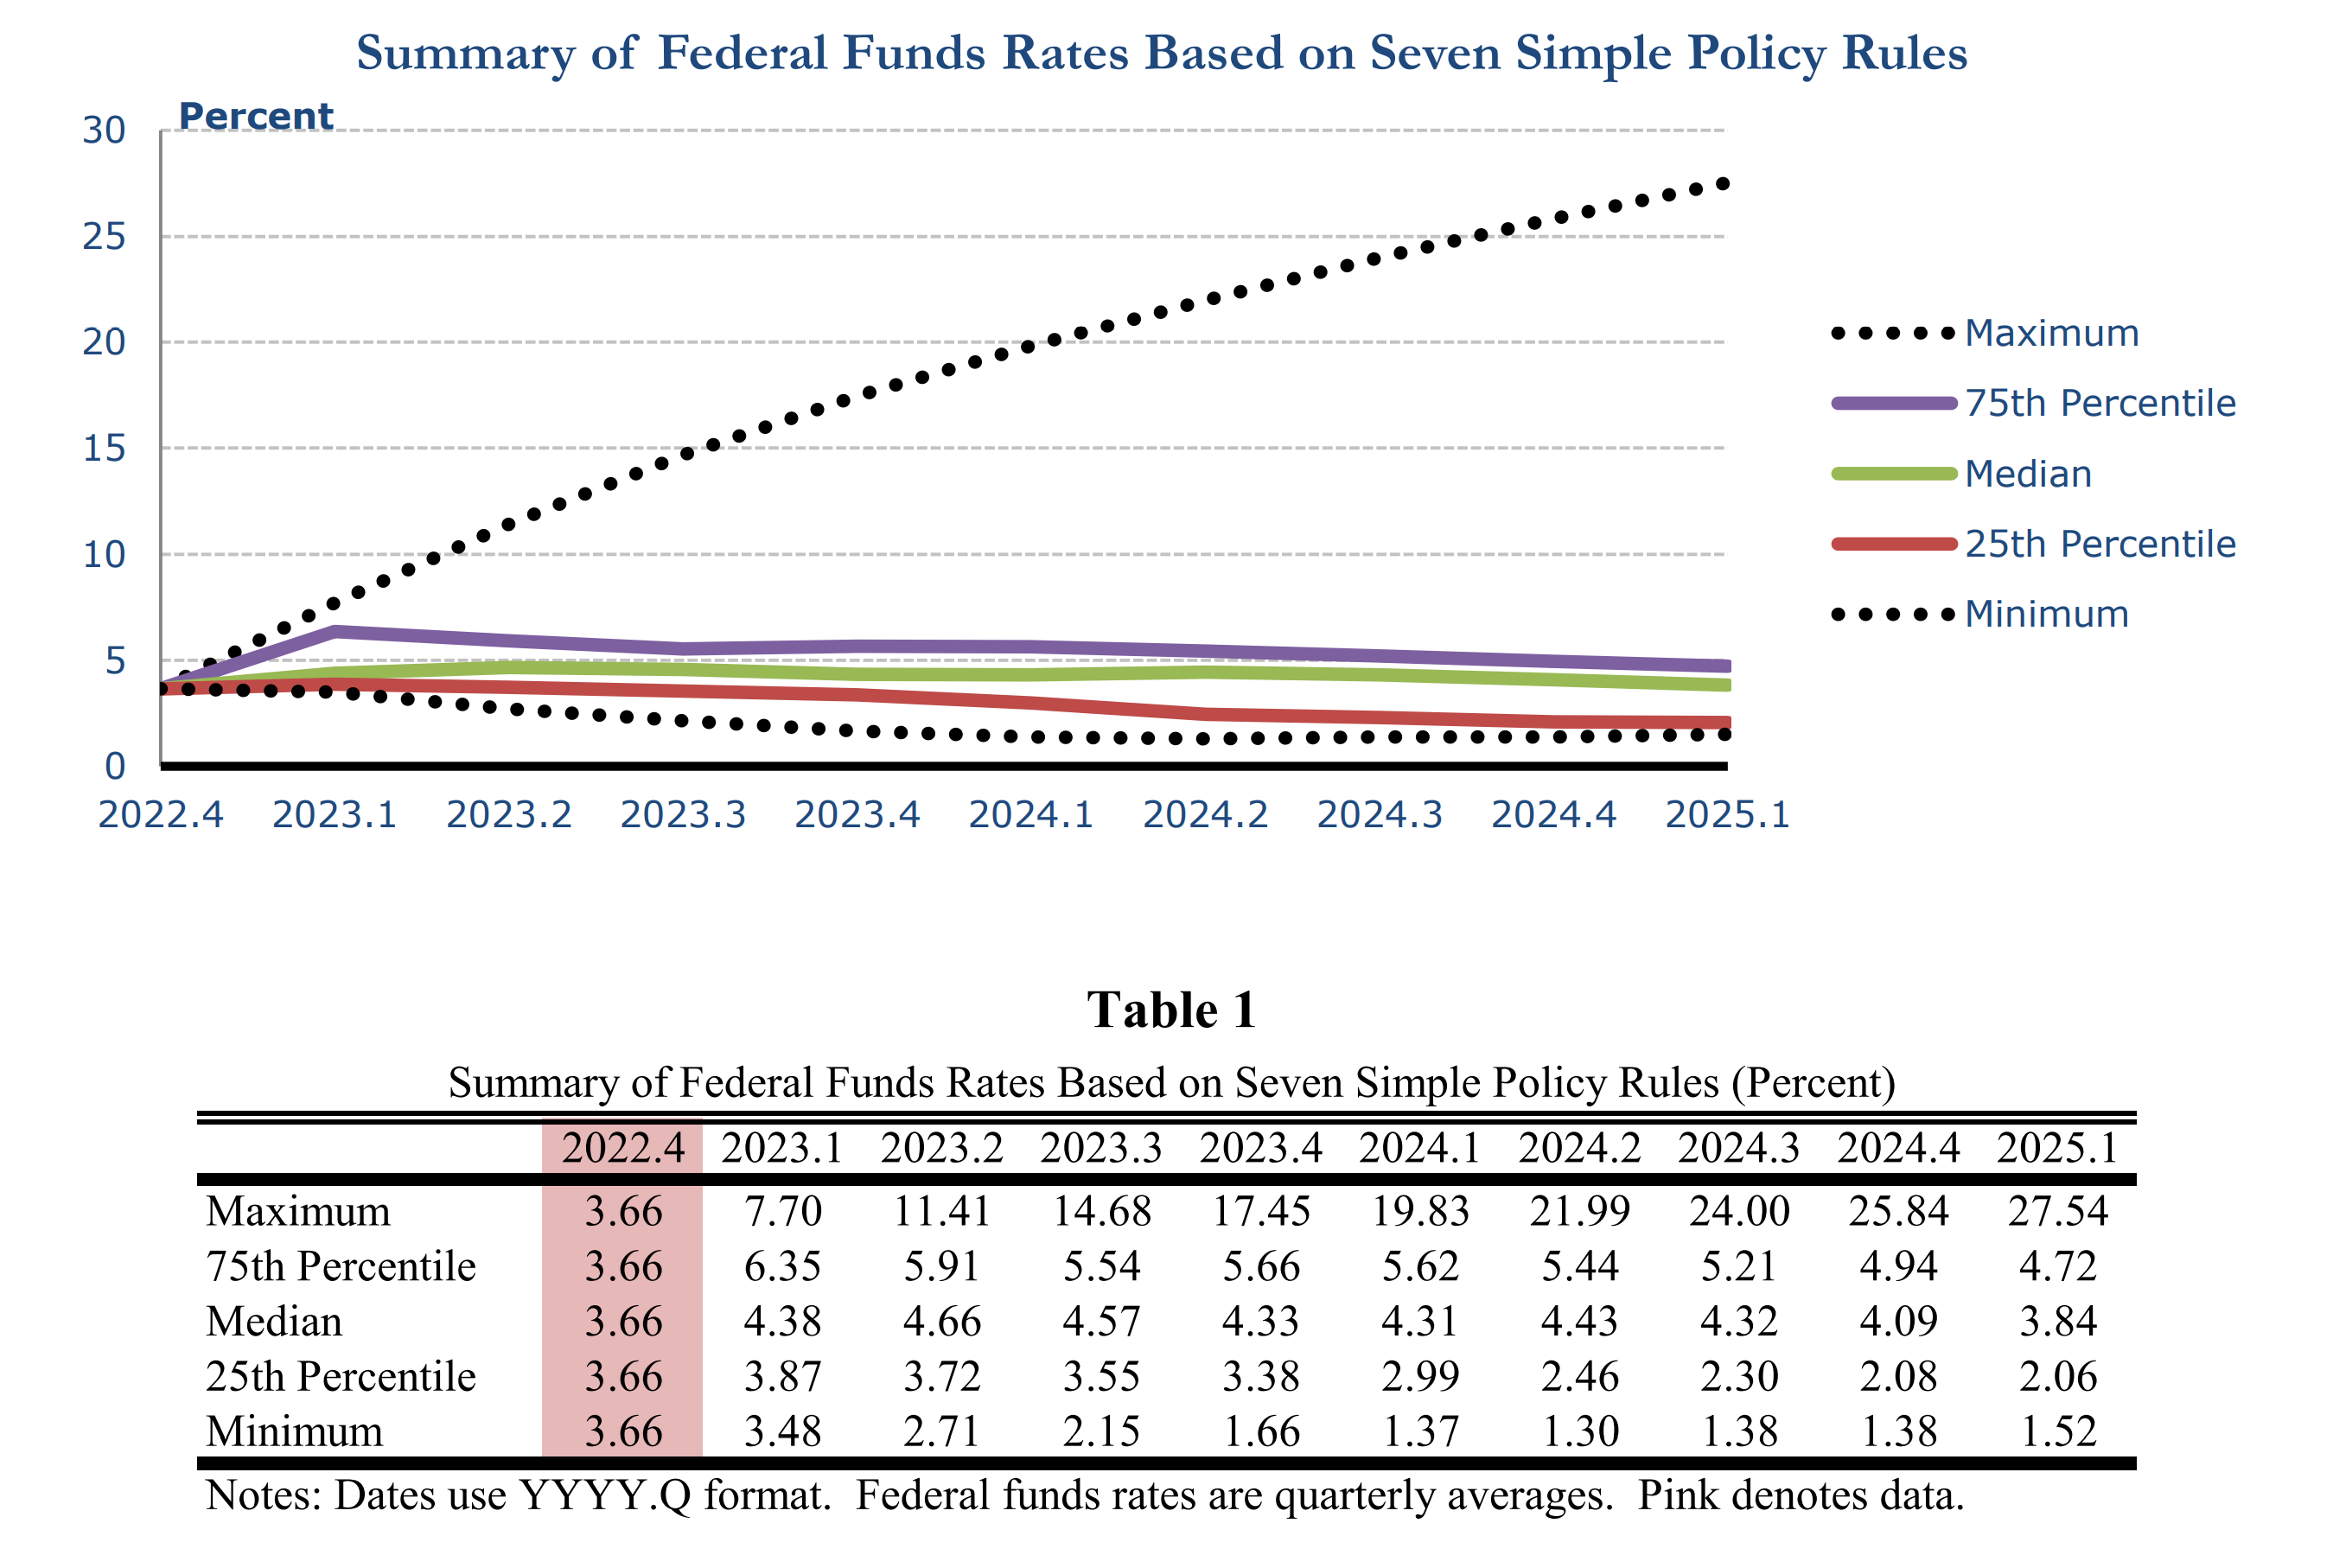
Figure 7. Federal Funds Rates Based on Forecasts from the Survey of Professional Forecasters and Seven Simple Policy Rules.
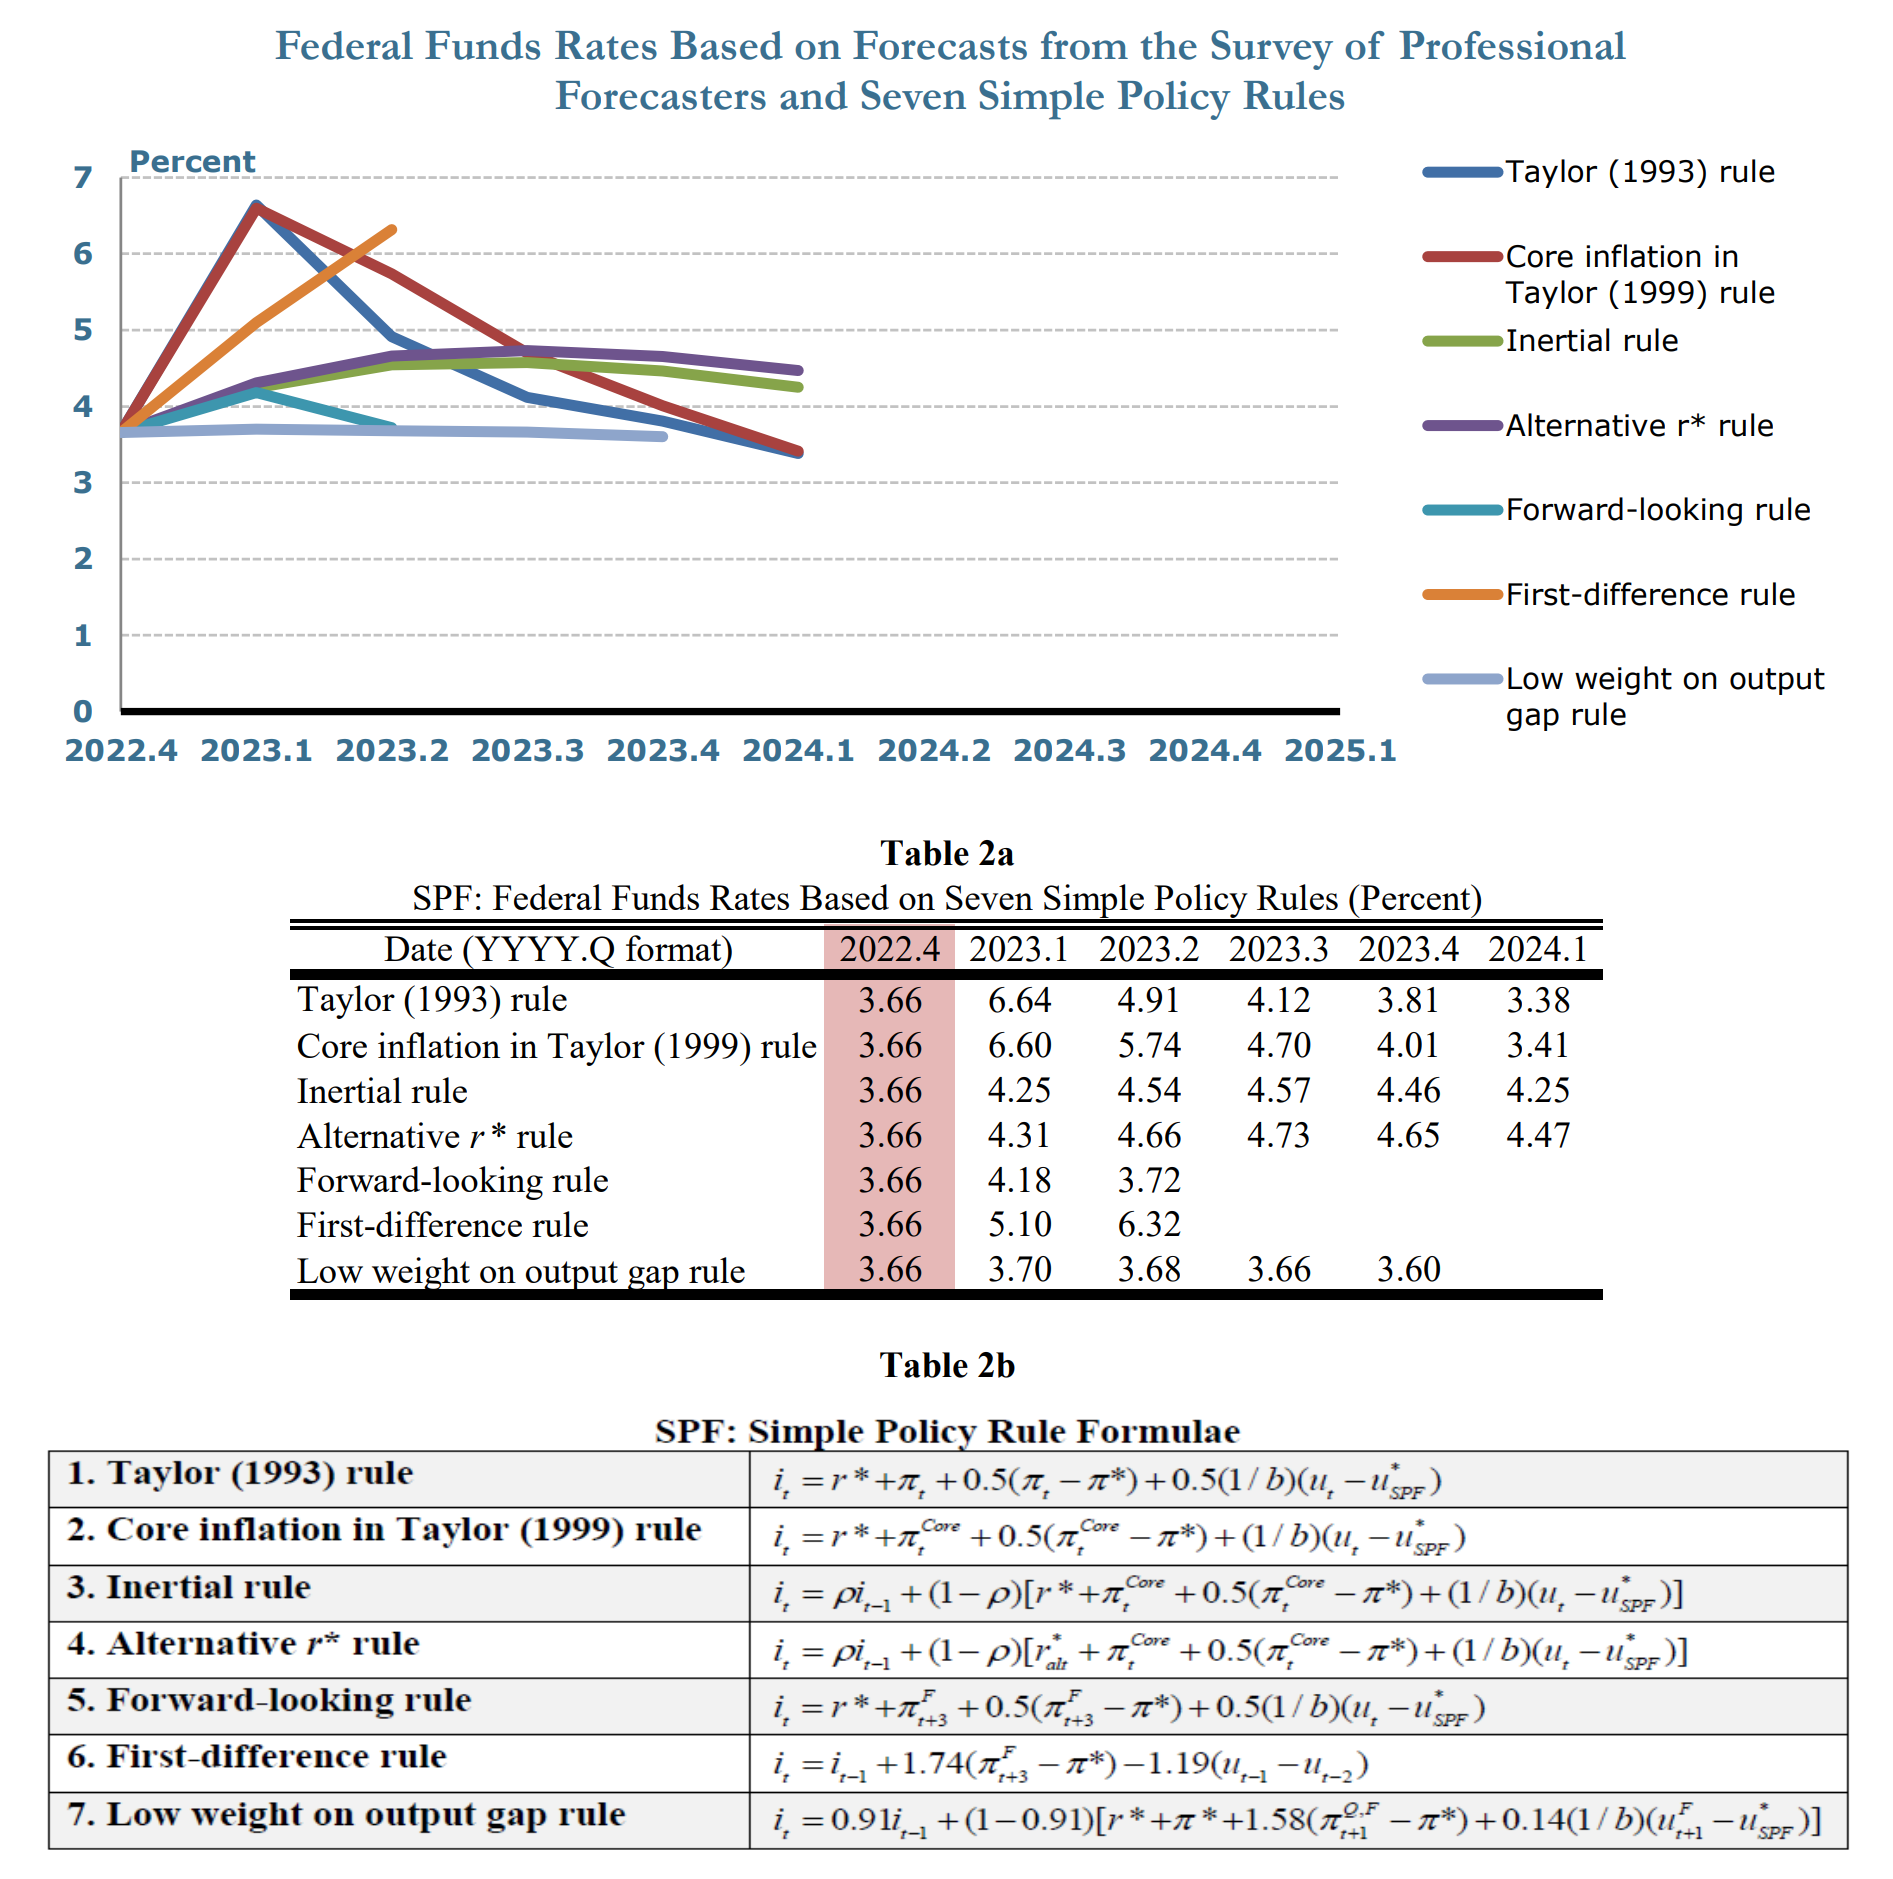
Table 2a provides the results from seven simple monetary policy rules conditional on forecasts from the Survey of Professional Forecasters (SPF). The Survey of Professional Forecasters (SPF) provides forecasts for Personal Consumption Expenditures (PCE) inflation, core Personal Consumption Expenditures (PCE) inflation, and the unemployment rate. Because they do not estimate the output gap, construct a proxy for the output gap using Okun’s coefficient and the unemployment gap. The forecast horizon is shorter than that of other forecasts included here, extending 4 quarters into the future, which limits results coming from the rules.
Figure 8. Federal Funds Rates Based on Forecasts from the Congressional Budget Office and Seven Simple Policy Rules.
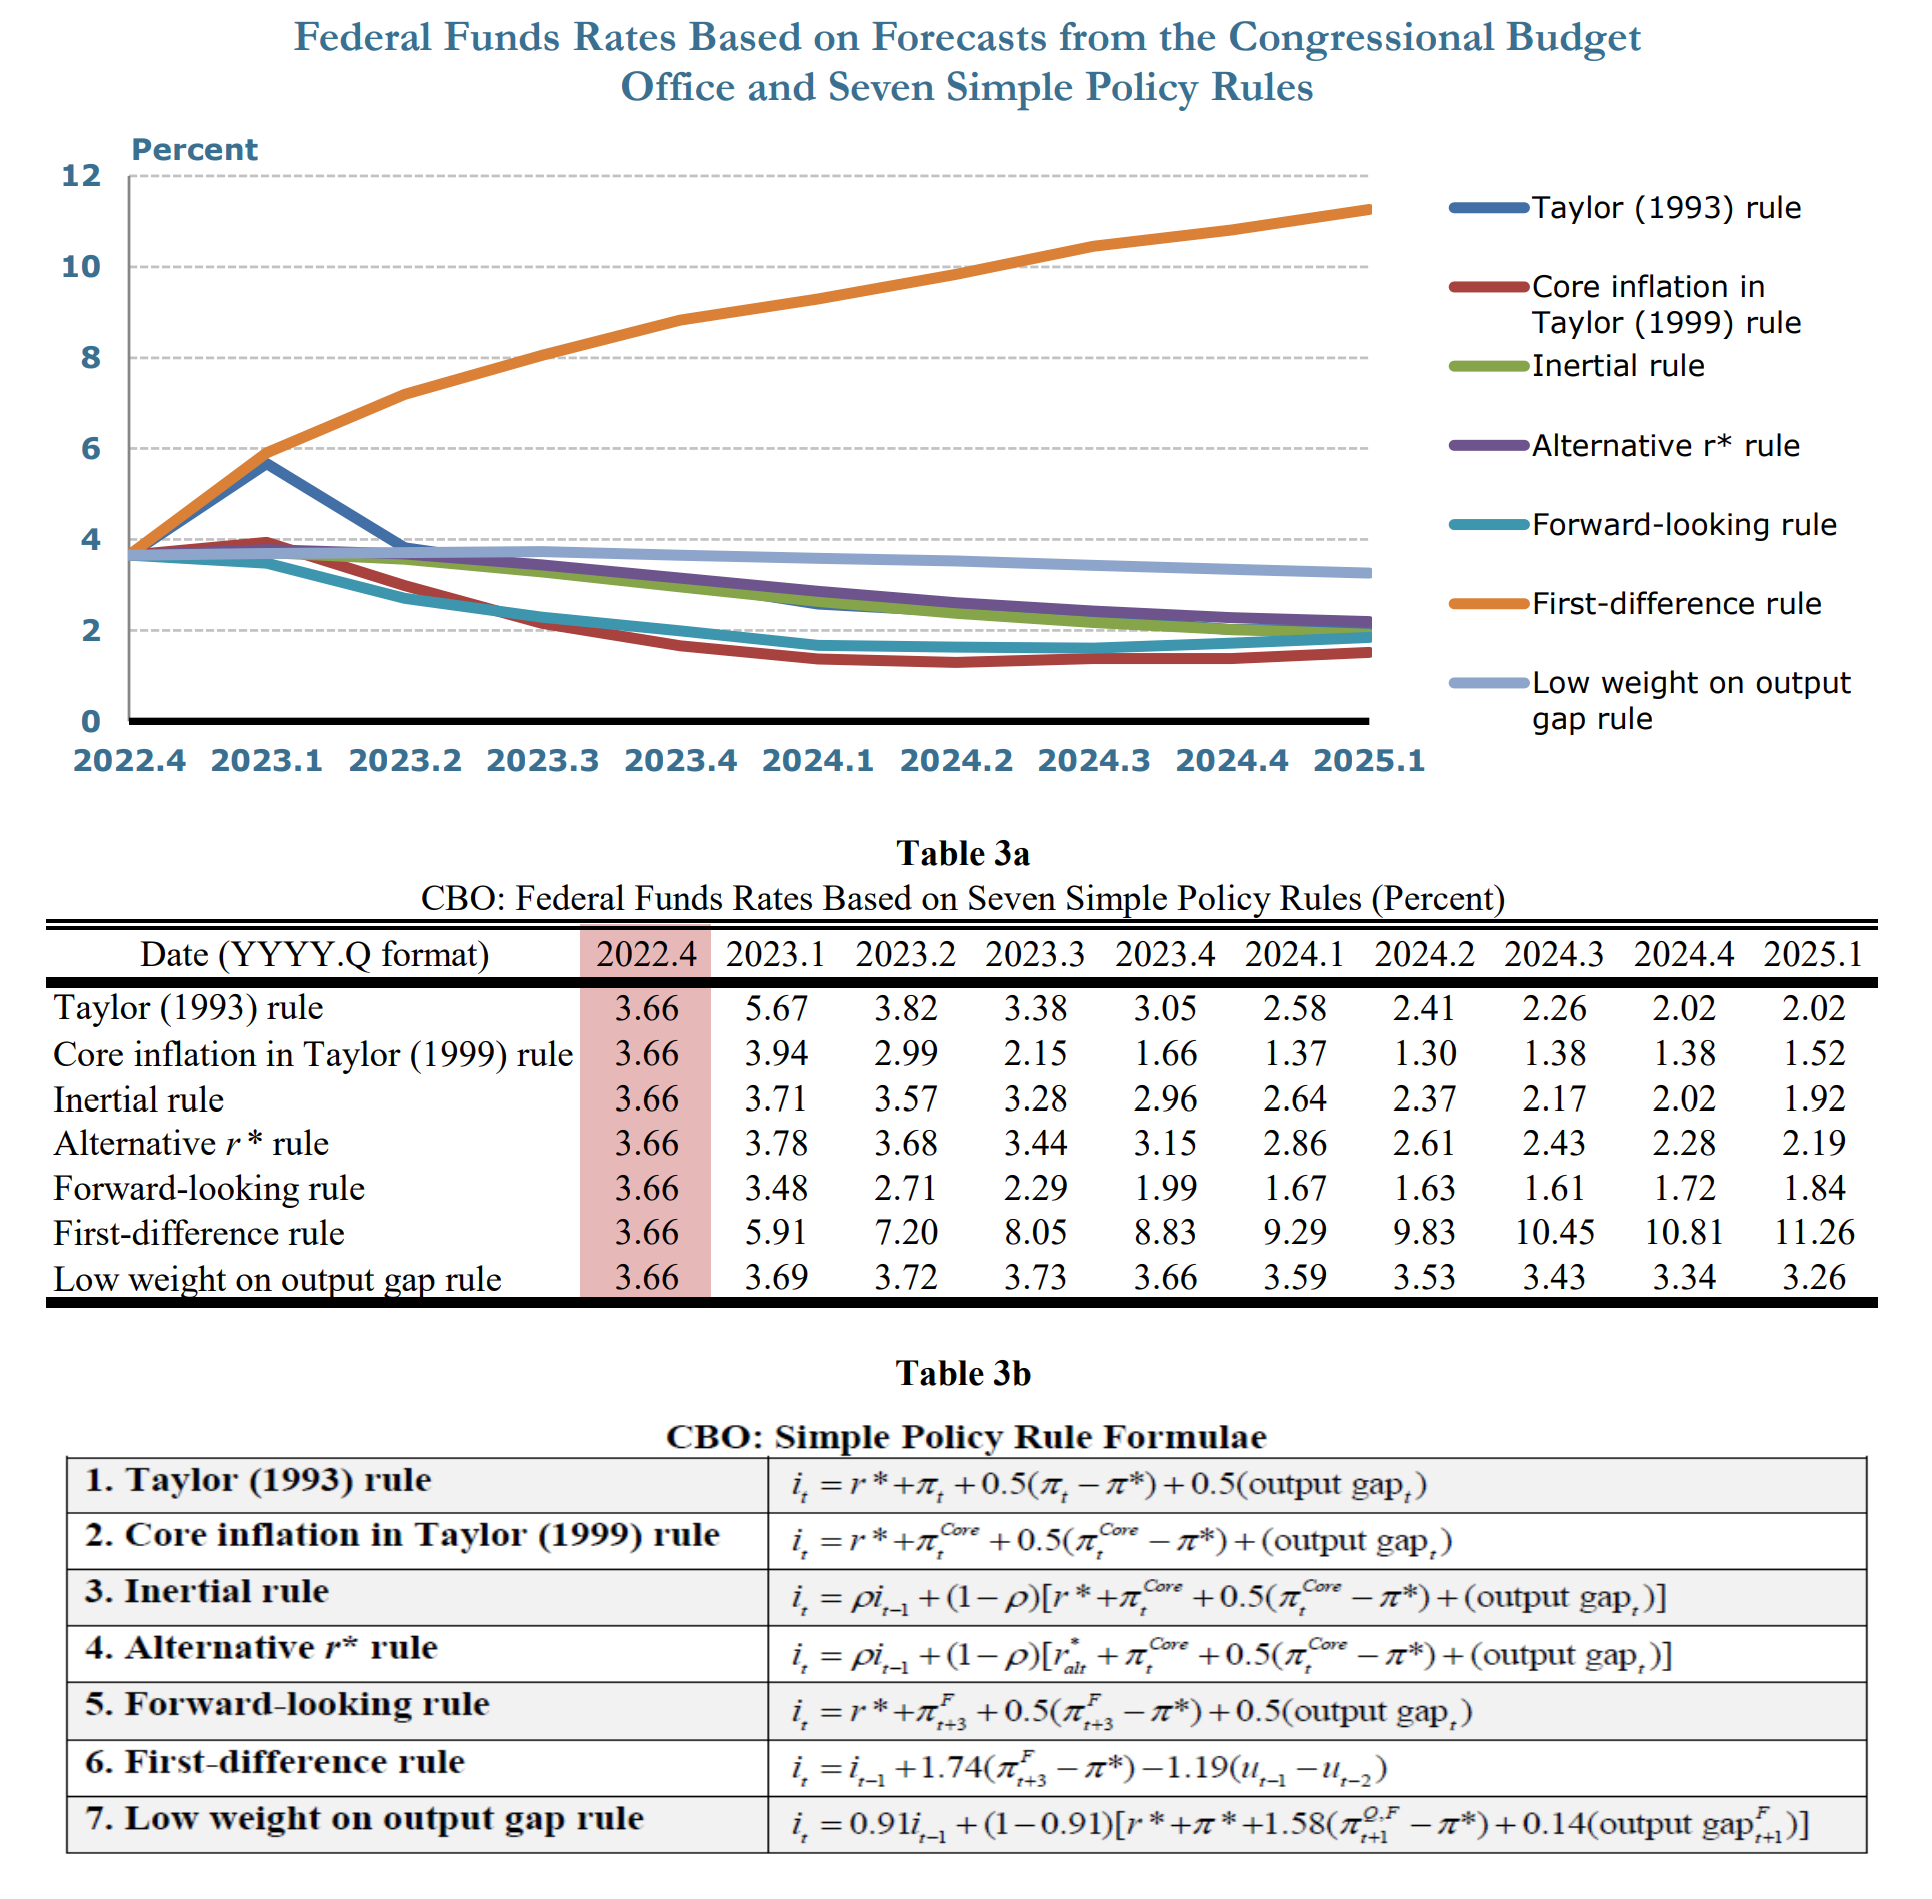
Table 3a provides the results from seven simple monetary policy rules conditional on forecasts from the Congressional Budget Office (CBO). The Congressional Budget Office (CBO) provides forecasts for Personal Consumption Expenditures (PCE) inflation, core Personal Consumption Expenditures (PCE) inflation, the unemployment rate, and the output gap.
Table 3b provides the formulae used to calculate each policy rule based on forecasts from the Congressional Budget Office (CBO).
Figure 9. Federal Funds Rates Based on Forecasts from the FRBC Staff Small BVAR Model and Seven Simple Policy Rules.

Table 4a provides the results from seven simple monetary policy rules conditional on forecasts from a small statistical Bayesian vector autoregression model consulted by staff at the Federal Reserve Bank of Cleveland (FRBC BVAR). Because the Cleveland Fed staff consult a variety of forecasting models, the FRBC BVAR model forecast does not necessarily represent the official forecast of Cleveland Fed staff or the president of the Cleveland Fed. The Bayesian vector autoregression model consulted by staff at the Federal Reserve Bank of Cleveland (FRBC BVAR) provides forecasts for Personal Consumption Expenditures (PCE) inflation, core Personal Consumption Expenditures (PCE) inflation, and the unemployment rate. Because it does not provide an estimate of the output gap, construct a proxy for the output gap using Okun’s coefficient and the unemployment gap.
There is still a long way to go until inflation gets to the 2% target, but the strong labor market and strong GDP growth in the United States support a restrictive monetary policy guidance as long as the dual mandate doesn’t get affected. This means that higher interest rates for longer are expected as long as the dual mandate doesn’t get affected. Even with more layoffs in the tech sector, the unemployment rate will not reach 2020 highs, and that’s a fact given the percentage that the sector represents in the overall employment statistics.
Figure 10. FOMC Unemployment Rate Projections.
.")
The "layoffs are bullish" narrative is true in the short term but not in the long term, as it is an EPS gimmick that reduces costs from workers' salary spending. Thus, the long-term outlook for the tech sector is bearish, but the short-term and near-term outlook for the sector and companies that have laid off employees is bullish, as earnings for the next two quarters are boosted by lower worker salary spending, thus increasing revenue with less spending in the short-term and near-term. The tech sector underperformance in the recent months proves to show how dependent tech sector is on easy monetary policies compared to other sectors of the market to be “growth” in them, this doesn’t mean that tech sector doesn’t have any value in the long run but rather tech sector is deflating the same way that the United States economy is.
Some folks have asked, "Where is the current bear and bull niche?" Well, here is the answer; as some inflationary pressures ease given the monetary policy tightening path, the bond market recovers value given less devaluation per month and year over year on the currency, thus the debt market recovers its value as the currency enhances its value given lower inflation, as mentioned before. Consumer spending proves to be resilient, and this is reflected in the consumer credit spending, which is at record highs.
Figure 11. Consumer Personal Income, Consumer Outlays from Spending and Consumer Savings change data from the Consumer Spending Statistics.
 data release with January 2023 Personal Consumption Expenditures (PCE) statistics.")
Figure 12. United States Personal Consumption Expenditures (PCE) Price Index, Year-over-Year Percentage Change, Seasonally Adjusted, Including Topline Contributions.
 data release with January 2023 Personal Consumption Expenditures (PCE) statistics.")
The same as in the Consumer Price Index data, the Services Price Inflation in the Personal Consumption Expenditures (PCE) Price Index is the main driver of inflationary pressures in the Personal Consumption Expenditures (PCE) Price Index. While the Core Personal Consumption Expenditures (PCE) Price Index lowers.
Figure 13. United States Personal Consumption Expenditures (PCE) Price Index, Month-over-Month Percentage Change, Seasonally Adjusted, Box Size Topline Contributions.
 data release with January 2023 Personal Consumption Expenditures (PCE) statistics.")
The Month-over-Month change in the Personal Consumption Expenditures (PCE) Price Index statistics show price increases in goods and services, mostly due to energy and fuel prices.
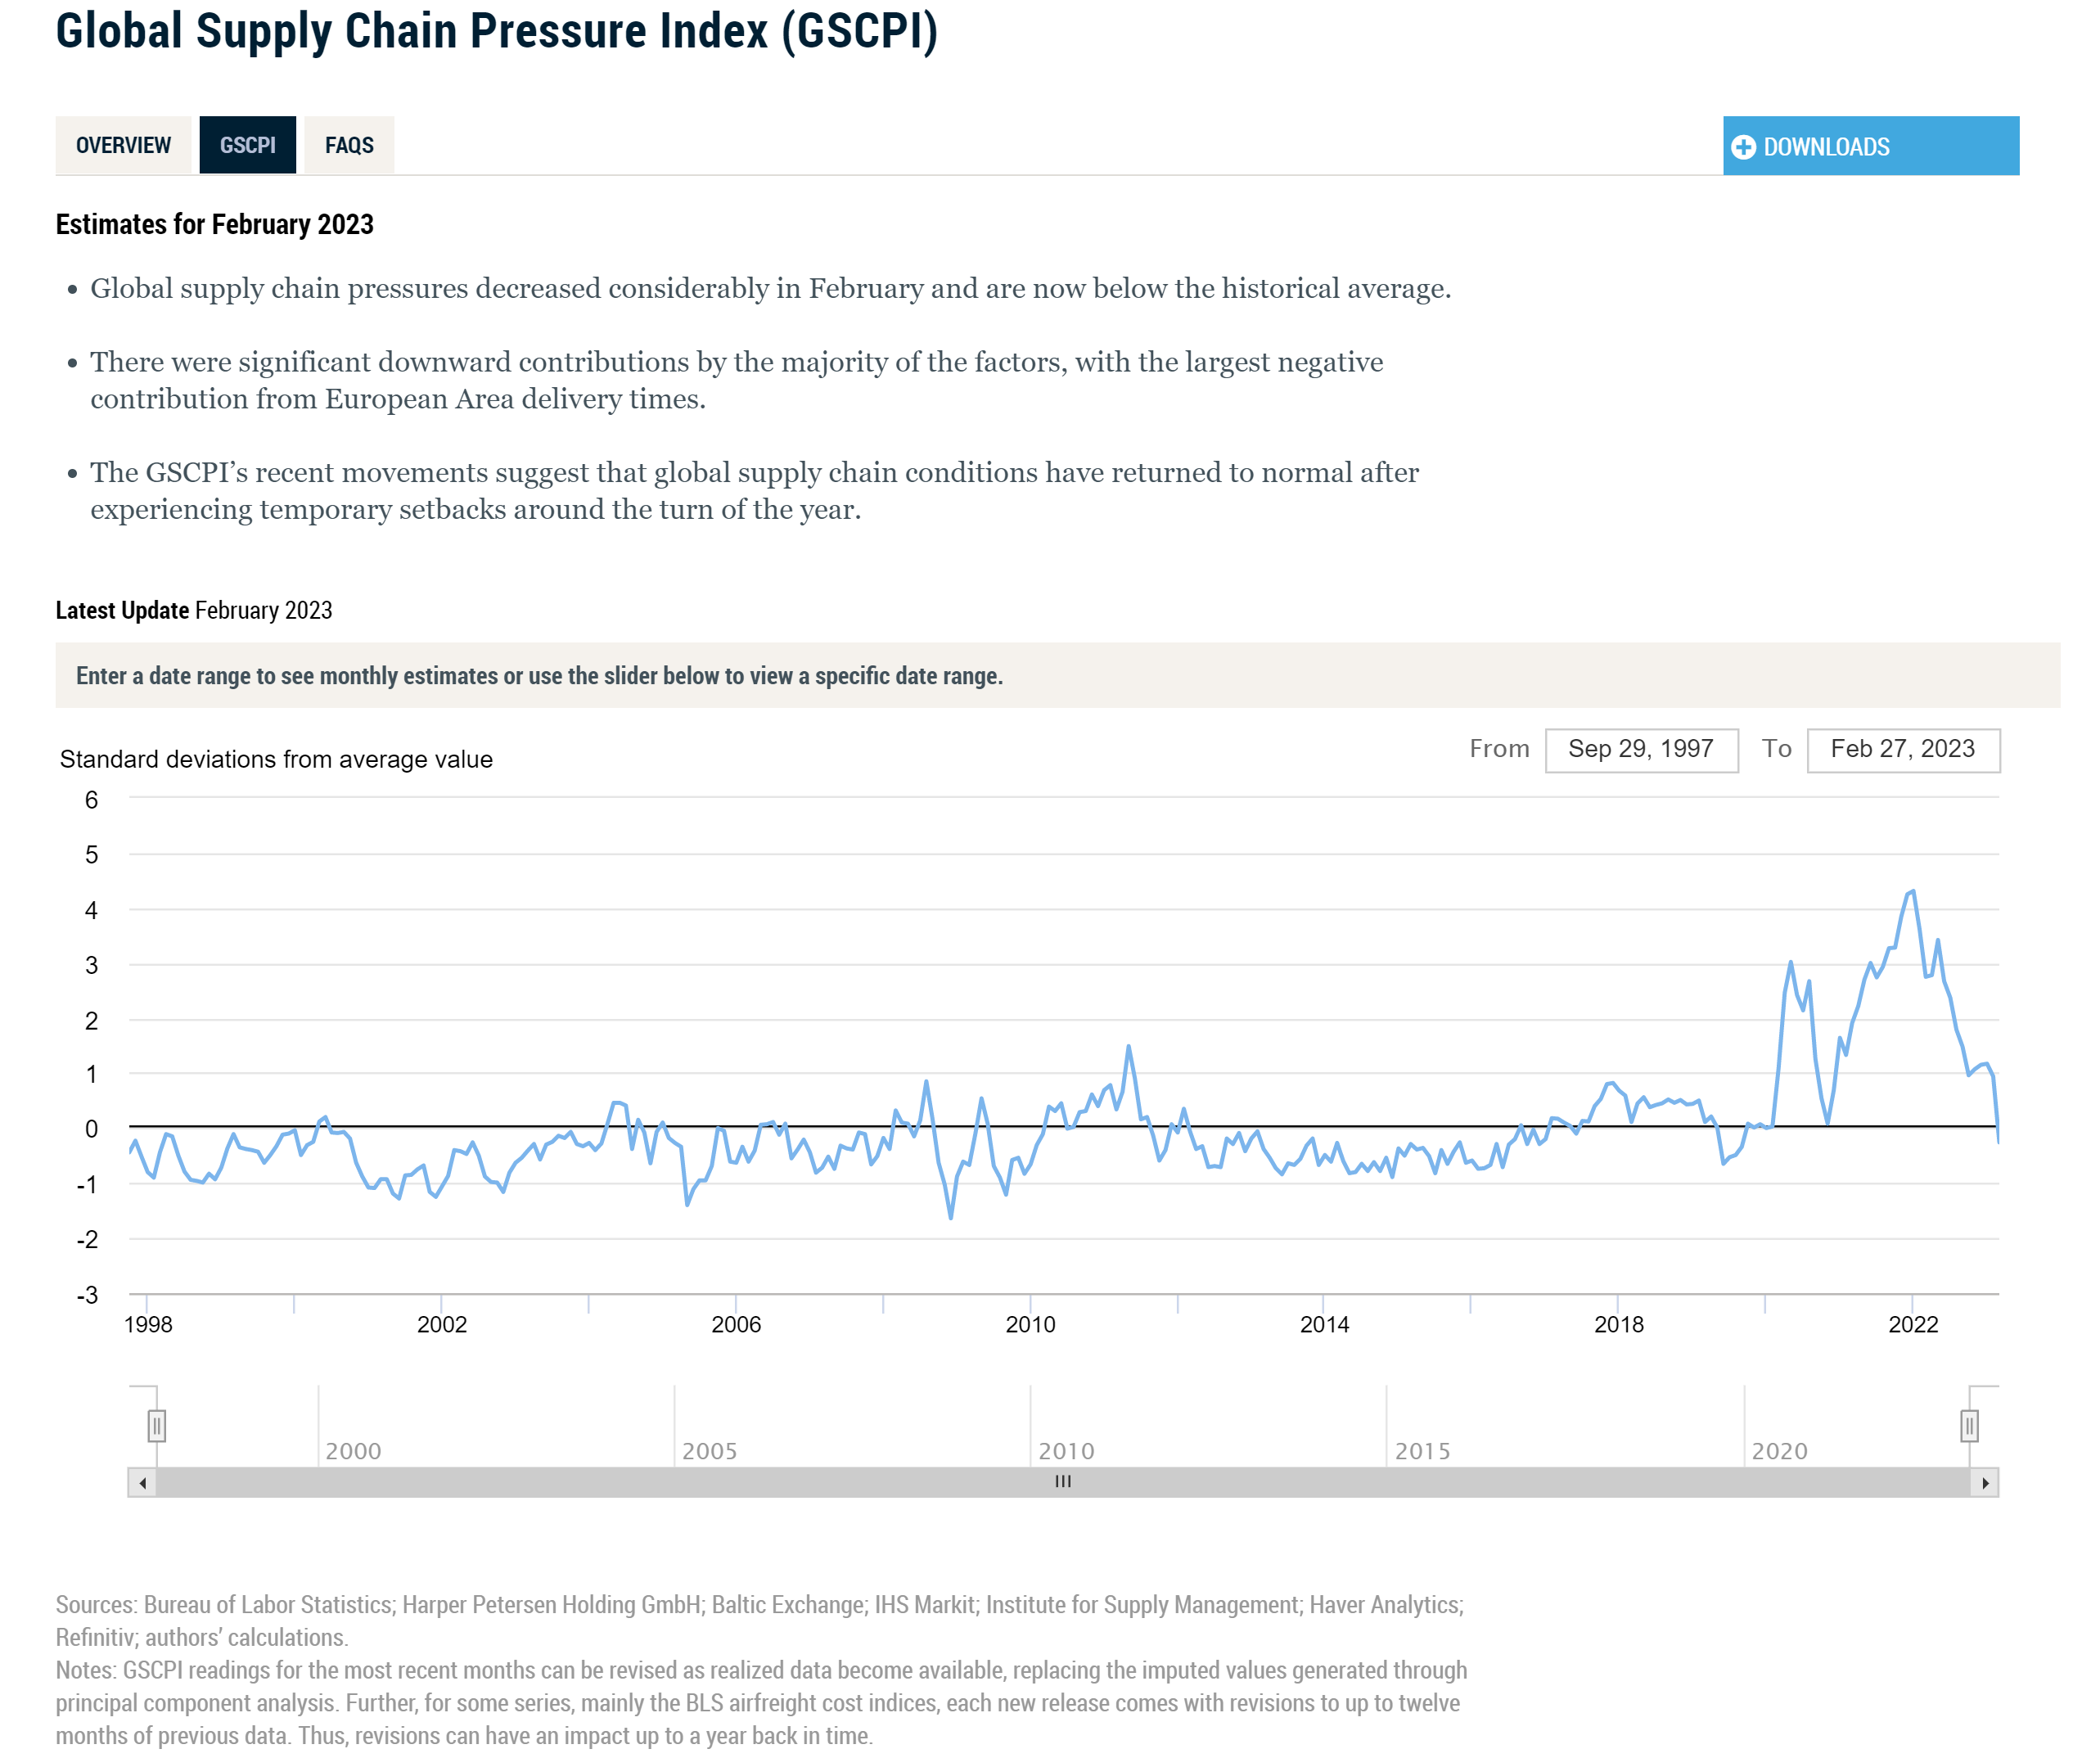
This consumer spending is reflected in some sectors' earnings reports, mostly concentrated in essential base consumption sectors such as the energy and food sectors, i.e., consumer and producer energy supplier companies and food supplier chains. Some politicians blame these companies' record profits on greed, when it is actually a reopening of the United States economy boosting consumer spending as supply and demand rebalance due to ongoing improvements in supply chains, as reflected in the previously mentioned Federal Reserve Bank of New York Global Supply Chain Pressure Index. All of this enhances the already existing bull thesis over essential sectors such as food and energy until after inflation gets to the 2% target, i.e., until supply and demand fully enter into balance, and there are changes to the thesis given improvements in some aspects of the United States economy as mentioned before.
Figure 14. Federal Reserve Bank of New York Global Supply Chain Pressure Index.
The reopening of the economy is reflected in the strong United States’ Gross Domestic Product (GDP) data and in the performance of companies’ earnings as the consumer remains resilient, as reflected in the consumer spending statistics.
Figure 15. Deutsche Bank CROCI US Plus Index Total Return.

Index Description: The Deutsche Bank CROCI (Cash Return on Capital Invested) US Total Return Index intends to reflect the equal-weighted total return performance of 40 stocks with a low "economic price earnings ratio" (P/E ratio) selected on a monthly basis from the 251 largest market cap stocks in the S&P 500 (excluding financials).
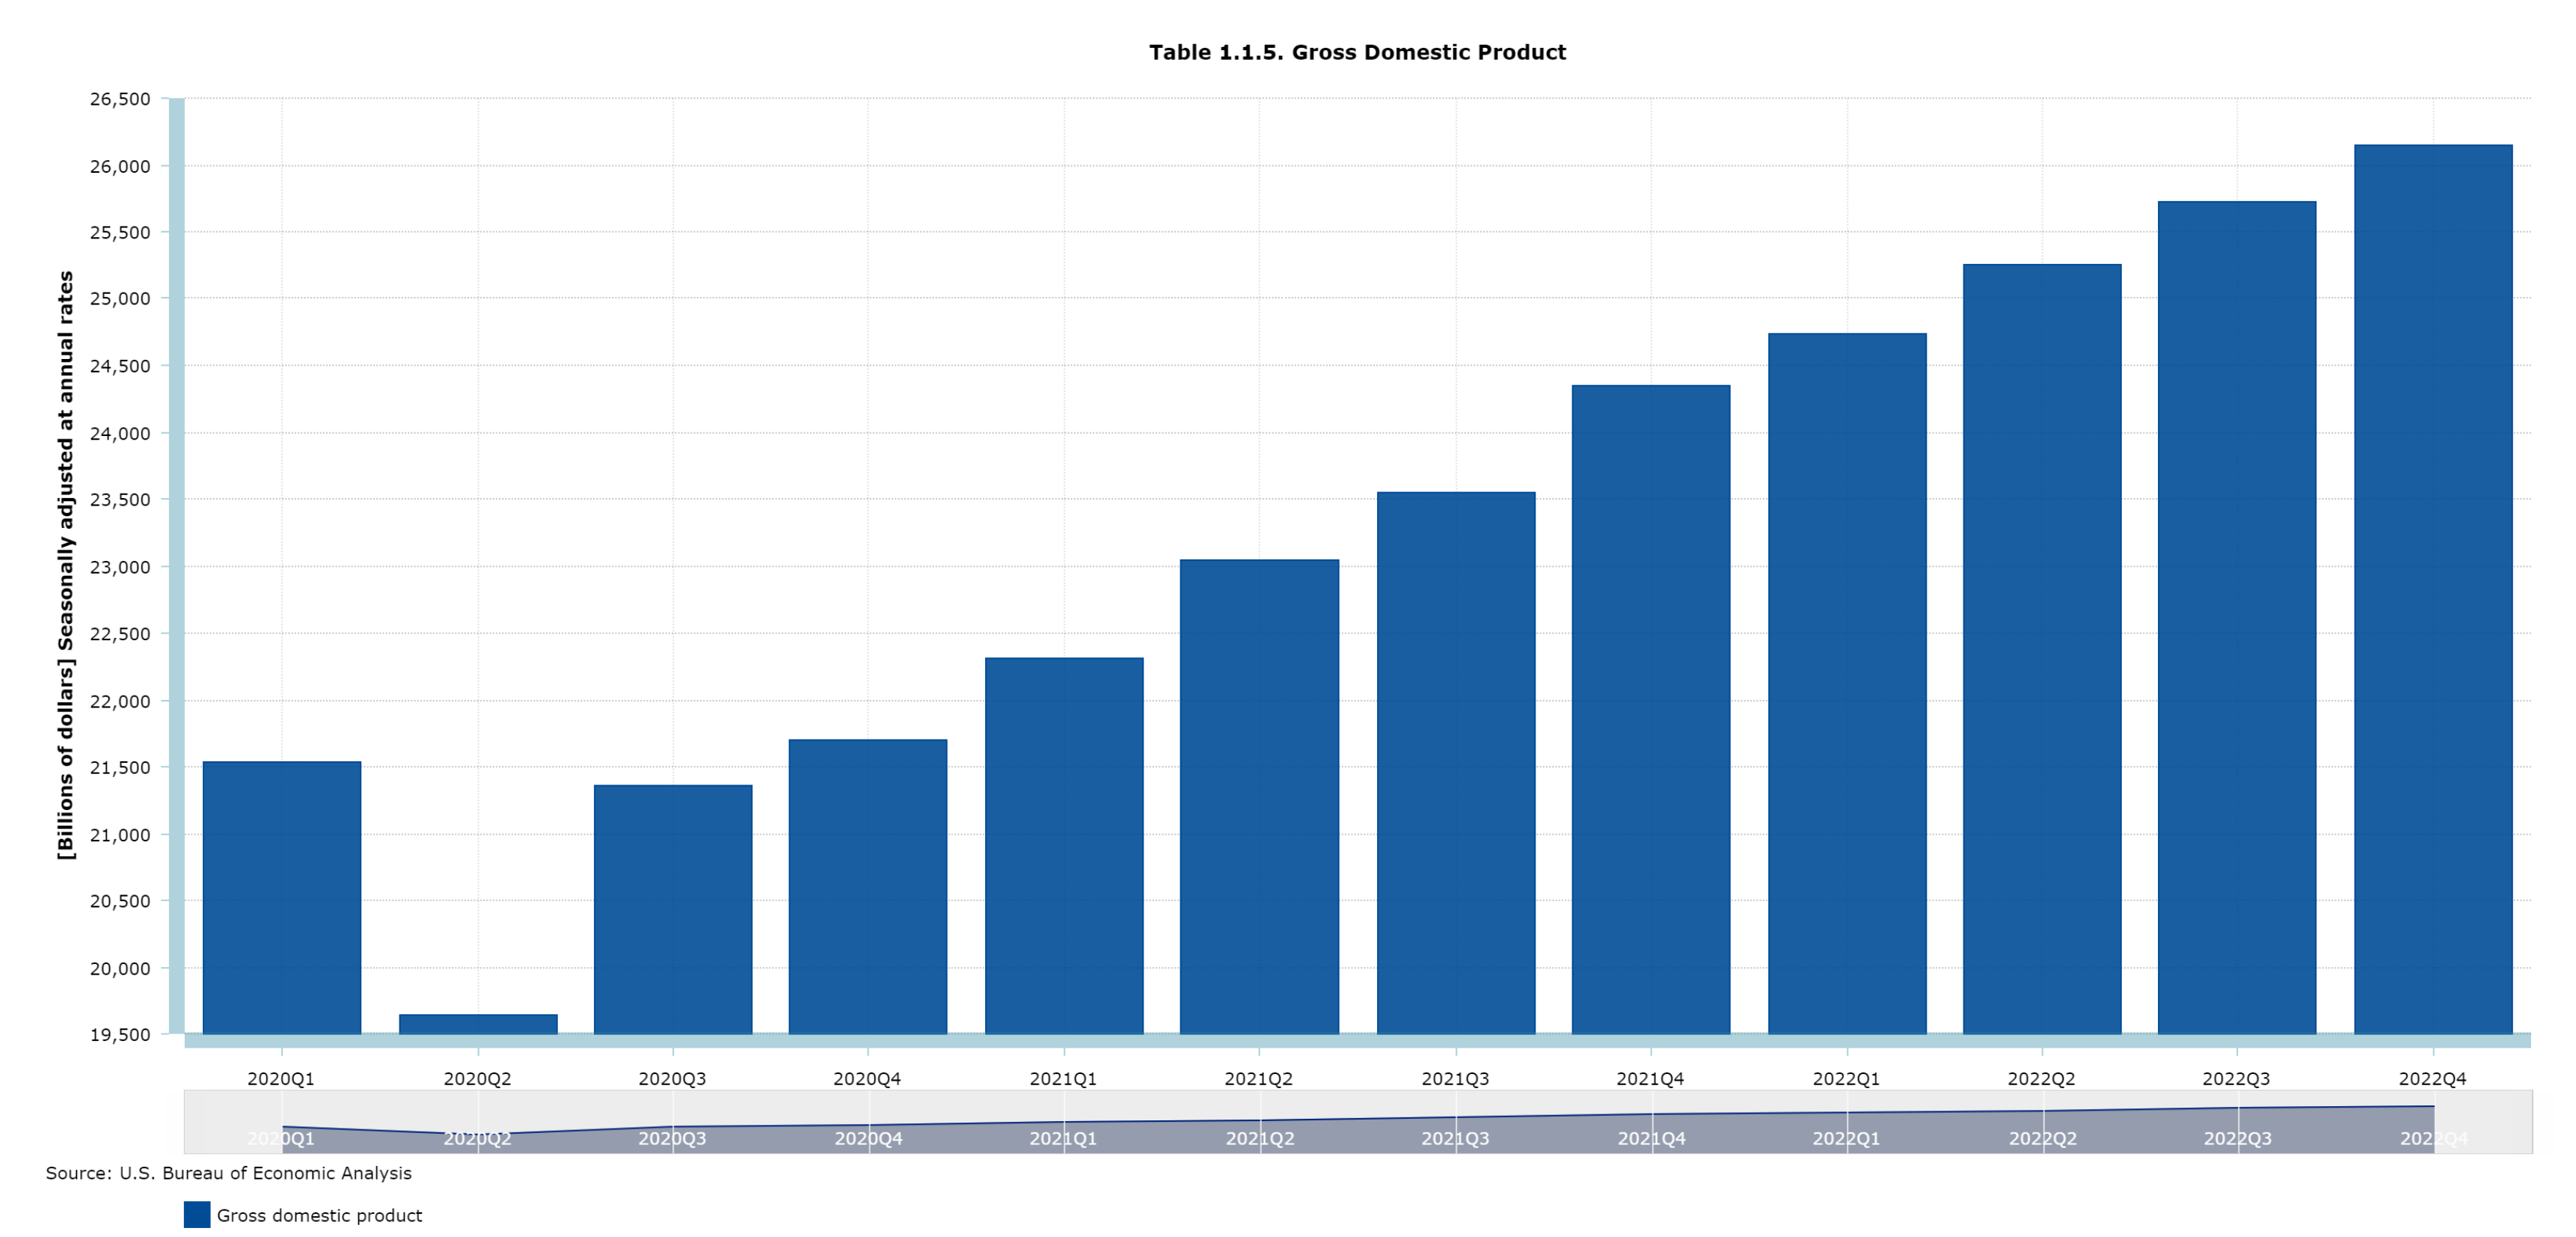
The Gross Domestic Product (GDP) data in the United States, shows a strong United States economy with a weak fiscal policy prudence, the new House of Representatives speaker has remarked it which is coherent, given the fact that the United States government since 1960, Congress has acted 78 separate times to permanently raise, temporarily extend, or revise the definition of the debt limit – 49 times under Republican presidents and 29 times under Democratic presidents.
It is welcome that Republicans are finally exercising fiscal prudence in the United States. Recent United States Industrial Production data lowered the probabilities of a soft-landing, but the probabilities of a soft-landing remain above 80%(±0.5%) [20%(±0.5) No soft-landing probability scenario]. The bullishness over the industrial sector remains high given the expected industrialization in order to reduce reliance on the direct or indirect enemies of the United States, as explained before. This is a thing on which the Biden Administration has focused, which is good for Americans because it ensures key stability in the supply chains and good-paying manufacturing jobs, as reflected in the employment statistics. There is still a long path until domestic supply chains in the United States reduce reliance on foreign countries' supplies that are directly or indirectly enemies of the United States.
Figure 16. The Employment Situation in the United States.
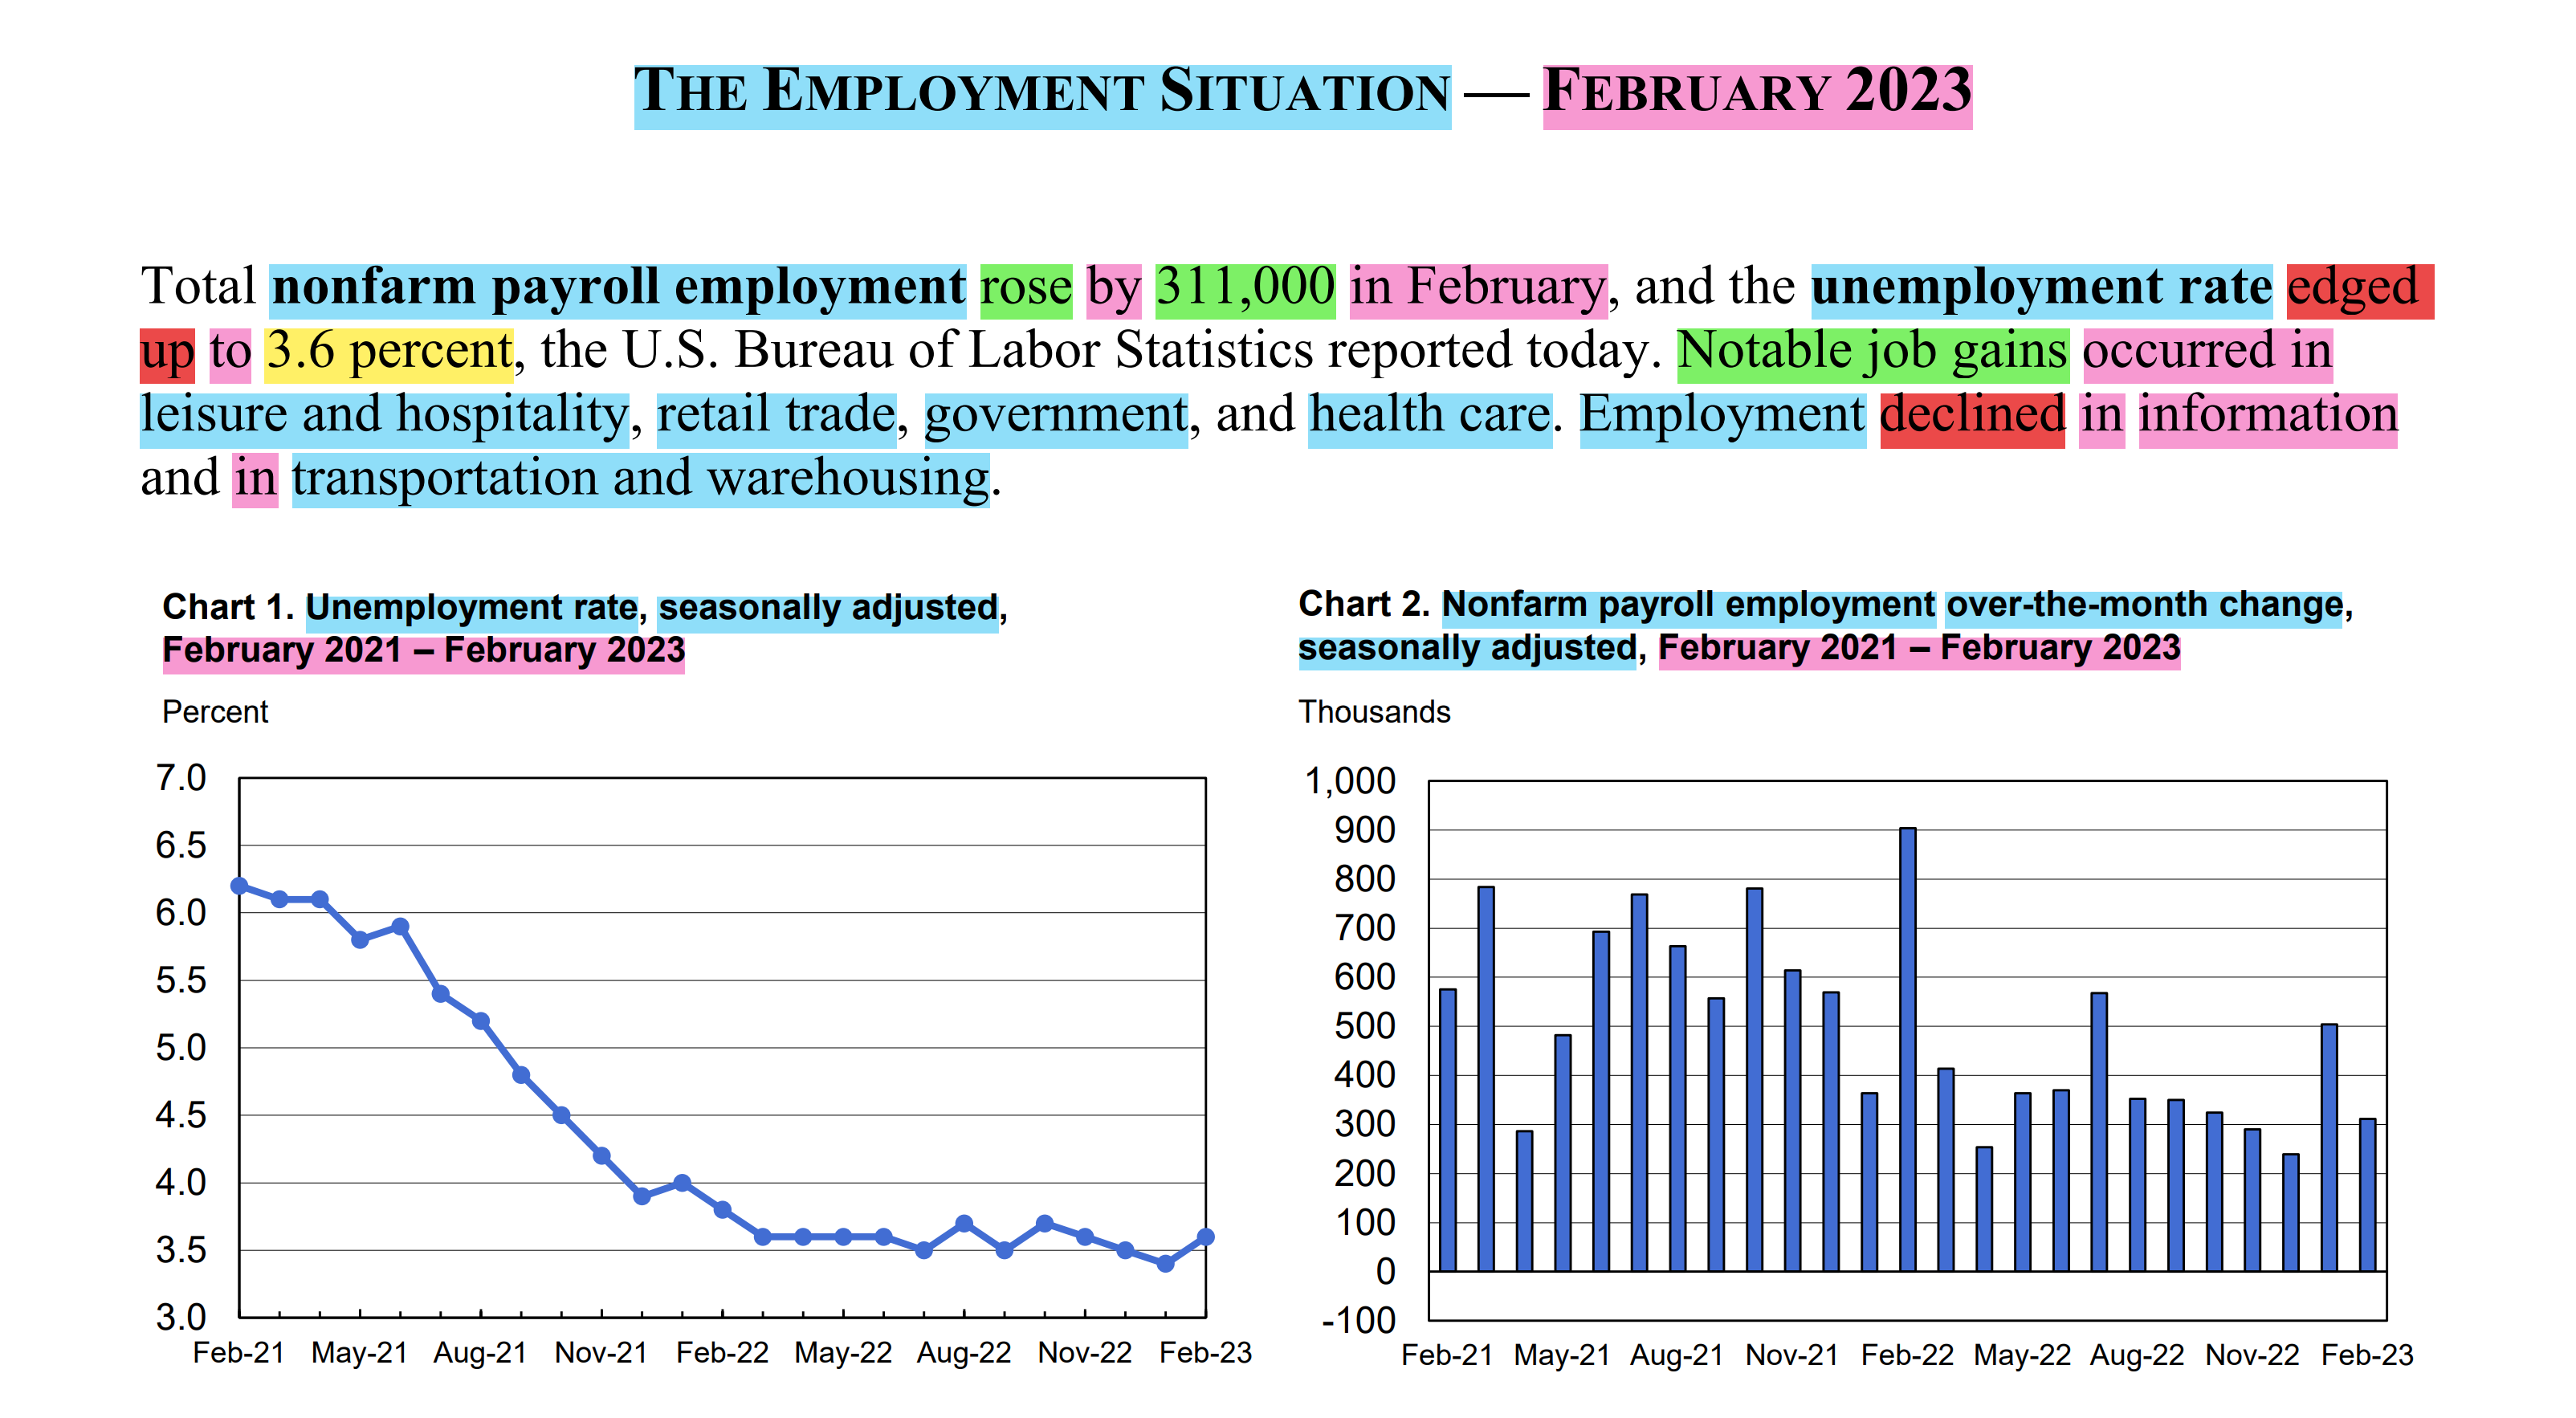
The unemployment rate in the US edged higher to 3.6% in February 2023, from January 2023 low, which was the lowest level of unemployment since May 1969. Overall, the job market remains above Americans' expectations, showing a strong labor market.
Some folks asked about the probabilities of recession and if there will be one. The answer is that the probabilities of recession have decreased to 45%(±0.5) for 2024, from previously being at 60%(±0.5), the job market improvements to record levels and the improvements over inflation, which show deflation in the consumer and producer price indexes and in the import and export price statistics, as mentioned before, apart from the strong Gross Domestic Product (GDP) data. The disinflation environment over energy sector prices given the Strategic Petroleum Reserve’s releases and refillings, as mentioned before, is what makes the probabilities in the long run almost 50%, given the fact that it might cause another energy crisis in the United States like in the 1970s, while the near-term and short-term outlook remains favorable given increases in domestic production, which reduce supply-side inflationary pressures, and increases in the interest rates, which reduce demand-side inflationary pressures, as well as the improvements in employment and Gross Domestic Product (GDP) growth given the reopening of the United States economy.
Figure 17. United States Gross Domestic Product (GDP).
The United States economy remains strong, and the biggest risks that the United States is facing are government default and, consequently, hyperinflation. Given the debt ceiling extension or reach and non-extension, the recent steps by the government preparing for a government default have been the main driver of recent market price action, rather than any other event or news. Government default implies a collapse of the United States dollar currency until after every dollar of debt issued by the government is backed by gold. A government default would imply the end of Modern Monetary Theory and the comeback of the gold standard.
Figure 18. Evolution of Atlanta Fed GDPNow real Gross Domestic Product (GDP) estimate for the first quarter of 2023.
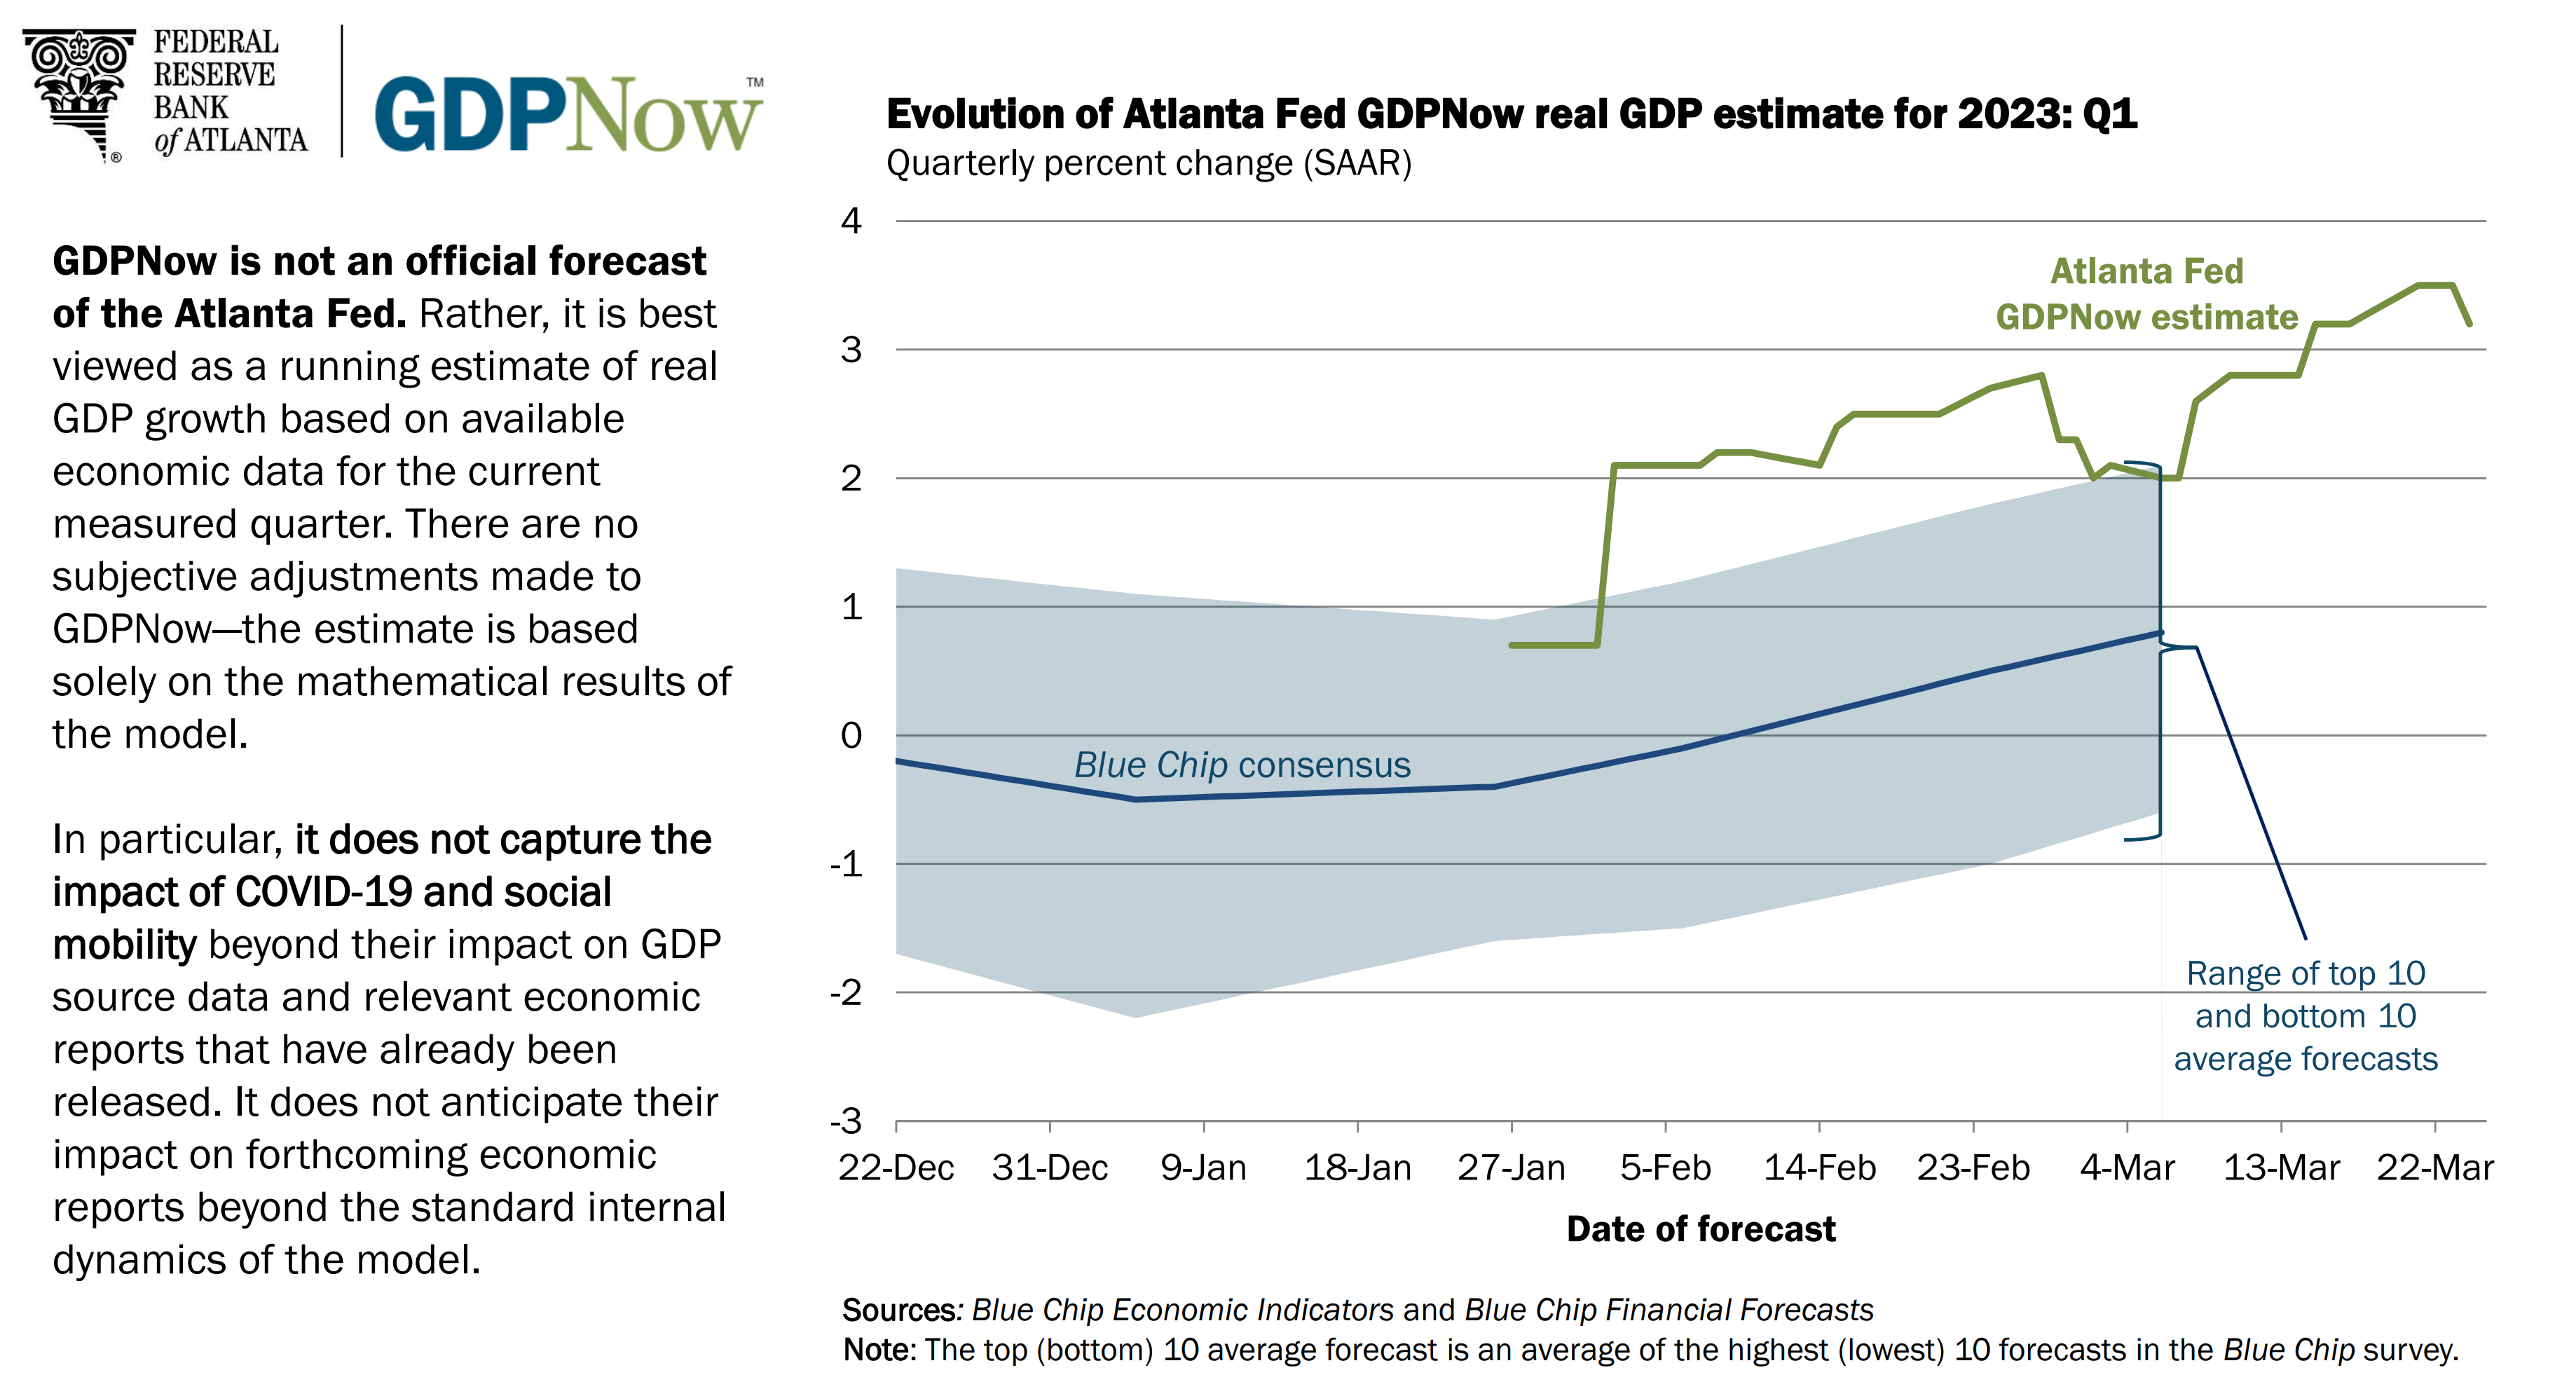
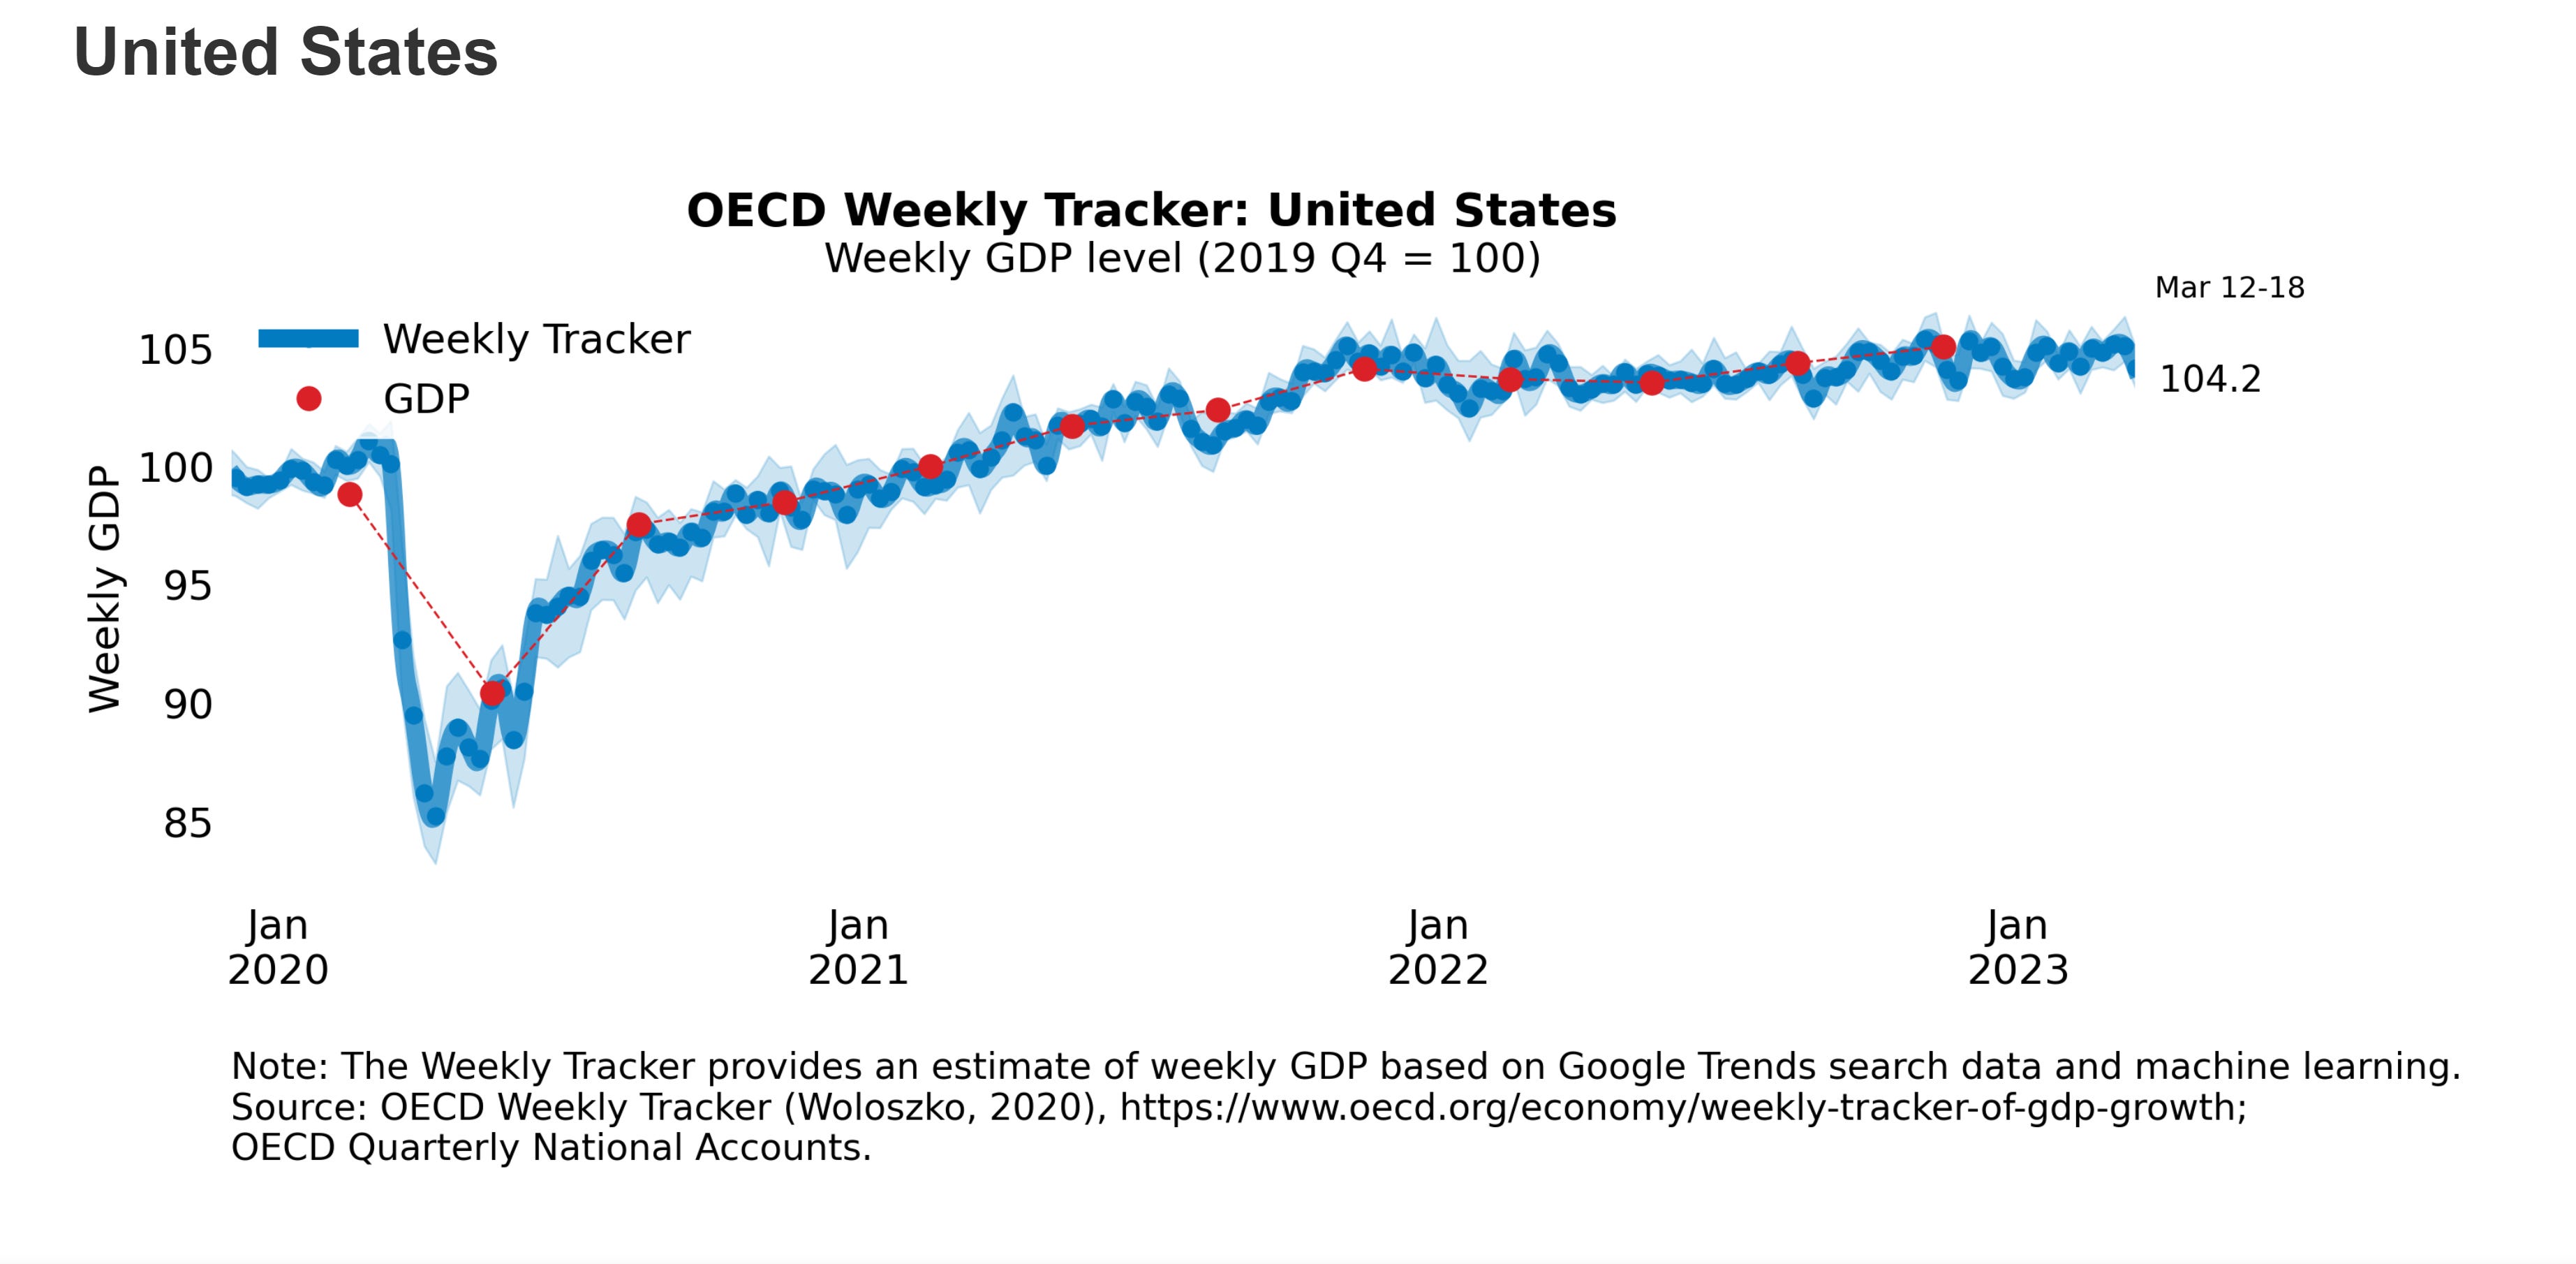
Figure 19. Organisation for Economic Co-operation and Development (OECD) - United States - Weekly Gross Domestic Product (GDP) Tracker.
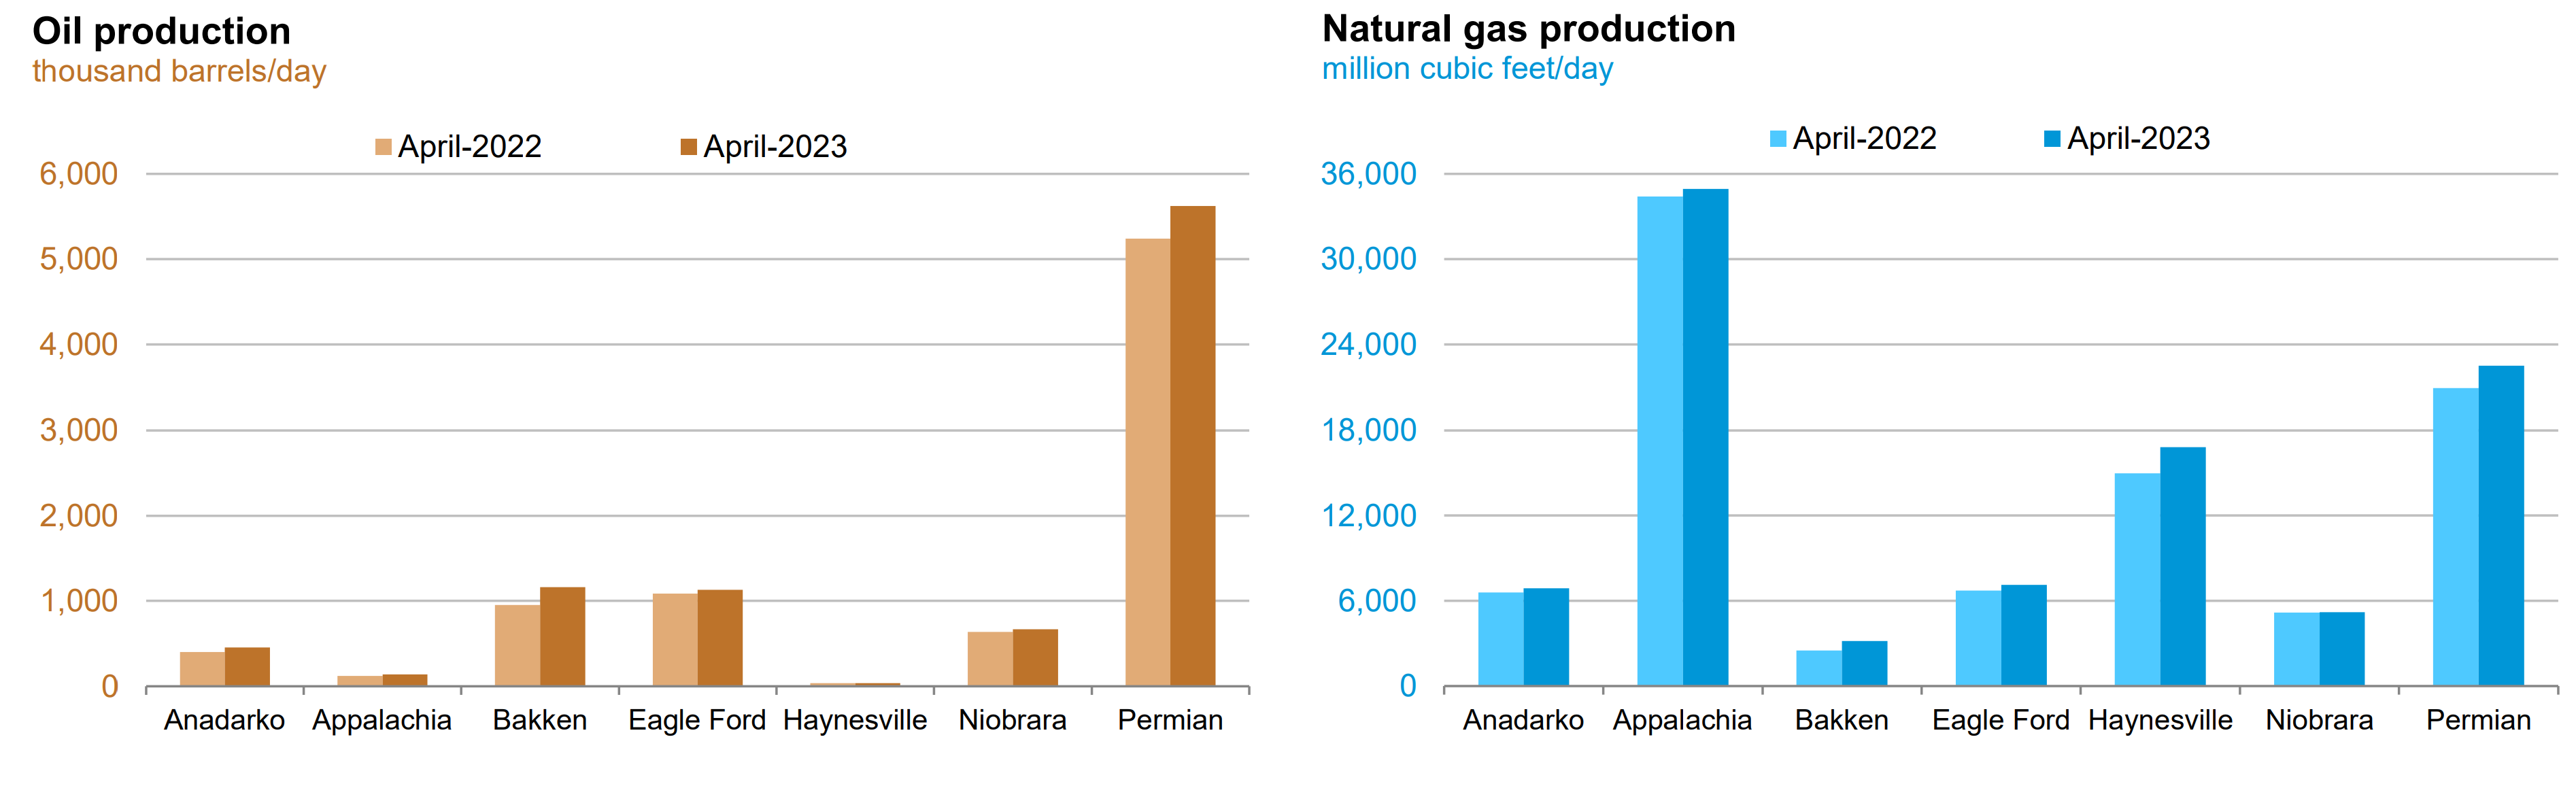
The main vectors of recent declines in energy prices are monetary policy, which has lowered demand-side inflationary pressures, and domestic production increases of oil and gas, which have lowered supply-side inflationary pressures. Apart from the United States Strategic Petroleum Reserve refilling and releases.
Figure 20. United States’ Weekly Stocks of Petroleum Products Including and Excluding the Strategic Petroleum Reserve (SPR).
")
Figure 21. United States’ Oil and Shale Gas Regions.
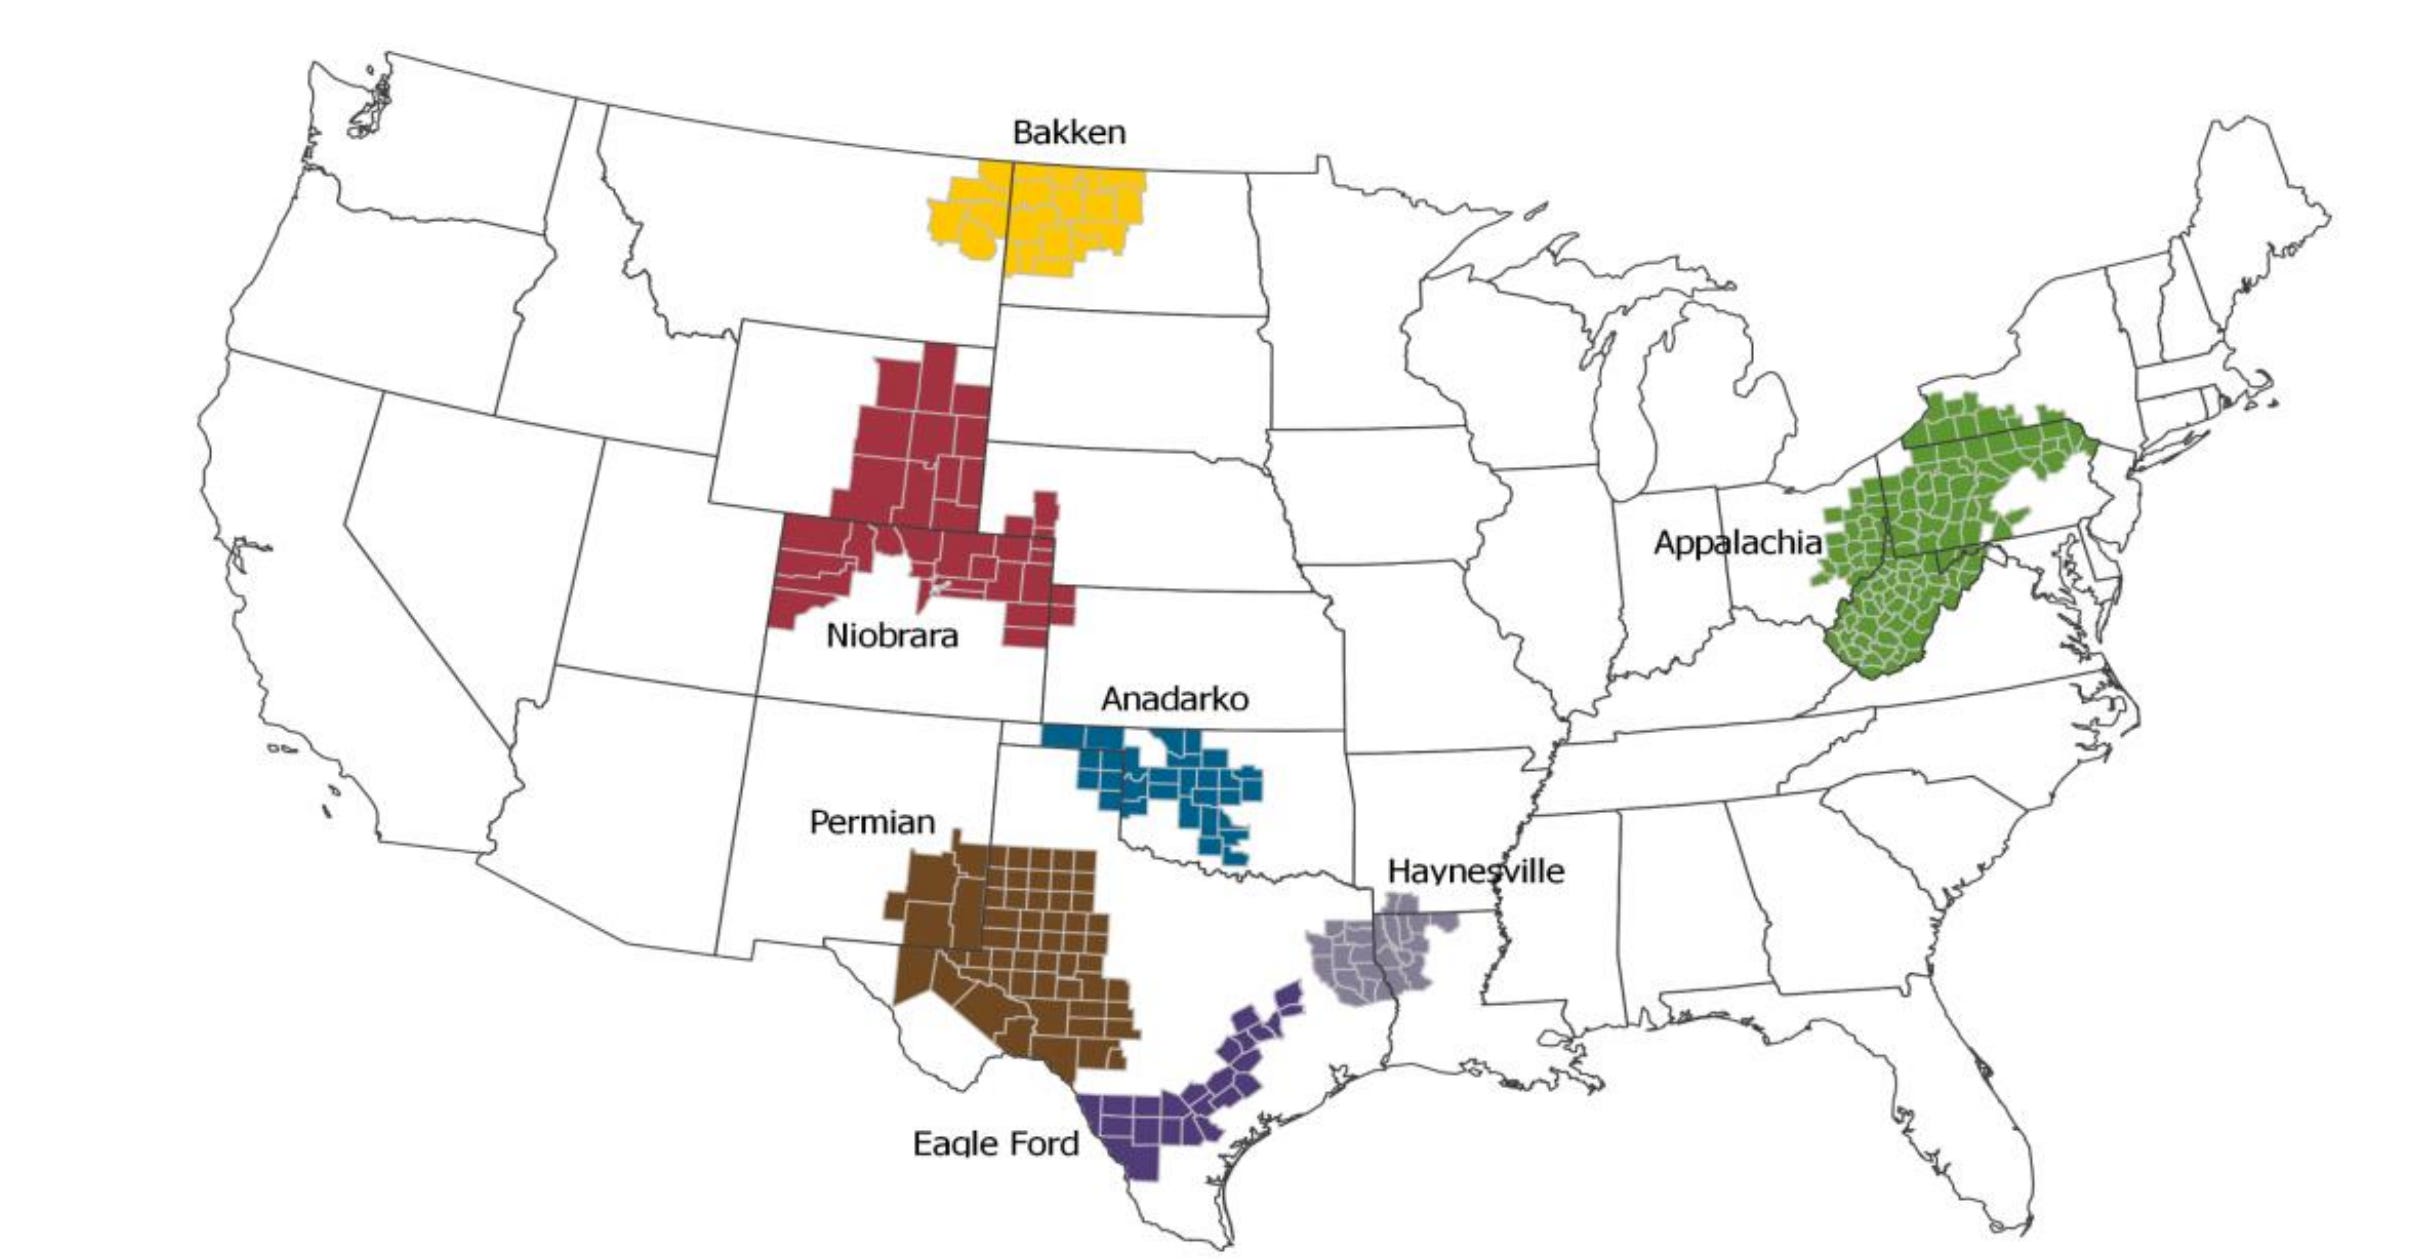
Figure 22. United States Oil and Natural Gas Production.
Some folks have asked how to hedge the disinflation environment; the answer has been these two benchmarks.
Figure 23. Brent Short Volatility III Sub Index 3.

3 Month Return (%): 14.89
6 Month Return (%): 39.21
12 Month Return (%): 73.84
YTD Return (%): 11.53
\({\displaystyle S={\frac {R-T}{DR}}}\\)\({\displaystyle S_{a}={\frac {E[R_{a}-R_{b}]}{\sigma _{a}}}={\frac {E[R_{a}-R_{b}]}{\sqrt {\mathrm {var} [R_{a}-R_{b}]}}},}\\)
(Data as of Friday 24th of March 2023, market close.)
Figure 24. Commodities Strangle Replication Strategy Natural Gas Index.

3 Month Return (%): 41.84
6 Month Return (%): 38.67
12 Month Return (%): 42.95
YTD Return (%): 34.11
\({\displaystyle S={\frac {R-T}{DR}}}\)\({\displaystyle S_{a}={\frac {E[R_{a}-R_{b}]}{\sigma _{a}}}={\frac {E[R_{a}-R_{b}]}{\sqrt {\mathrm {var} [R_{a}-R_{b}]}}},}\)
(Data as of Friday 24th of March 2023, market close.)
A lot of folks have asked what's with the moon image in the Twitter profile. The response to that question is that it represents the last time the United States fought a war against another nation without using weapons but using the brain.

Given the high probabilities of world war
World War Probabilities:

	· Prob. War starting in Q1 2023:
		· War Probabilities:
			| - Probabilities of War starting in Q1 2023: 100% (±0.5)
		· Non-War Probabilities:
			| - Probabilities of Non-War starting in Q1 2023: 0% (±0.5)
			· Vectors:
				| - Taiwan [~75%(±0.5)], Ukraine [~24% (±0.5)], Else: [~1%(±0.5)].
Source: Private Software under NDA.
To conclude
(…) "Ending inflation means freeing all Americans from the terror of runaway living costs." (…) "We have every right to dream heroic dreams. Those who say that we're in a time when there are not heroes, they just don't know where to look." (…) "Above all, we must realize that no arsenal or no weapon in the arsenals of the world is so formidable as the will and moral courage of free men and women." (…)
- Ronald Reagan
Europe:
(Previous Analysis 1 (Dec 18, 2022))
(Previous Analysis 2 (Nov 5, 2022))
(Previous Analysis 3 (Oct 31, 2022))
The European Central Bank's monetary policies have reduced the inflation numbers in European countries, but as inflation remains high, it's coherent to stay the course toward price stability by reducing demand inflationary pressures through the interest rates; further interest rate hikes are expected until European Price Inflation indexes show deflation; the European Union's measures over commodities prices have generated backwardation and disinflation in the same way that the United States' Strategic Petroleum Reserve’s releases and refillings have; thus, the European Central Bank (ECB) must be nimble given the forward expected volatile commodity price action given by legislative policy measures that don’t increase supply and increase demand-side inflationary pressures. As monetary policy can't help to increase supply nor decrease supply-side inflationary pressures but only lower demand-side inflationary pressures through the interest rates, the European Central Bank (ECB) must continue with the tightening path to lower demand-side inflationary pressures until the 2% inflation target is achieved.
Figure 25. European Central Bank (ECB) Euro Area Harmonised Index of Consumer Prices (HICP) projections.
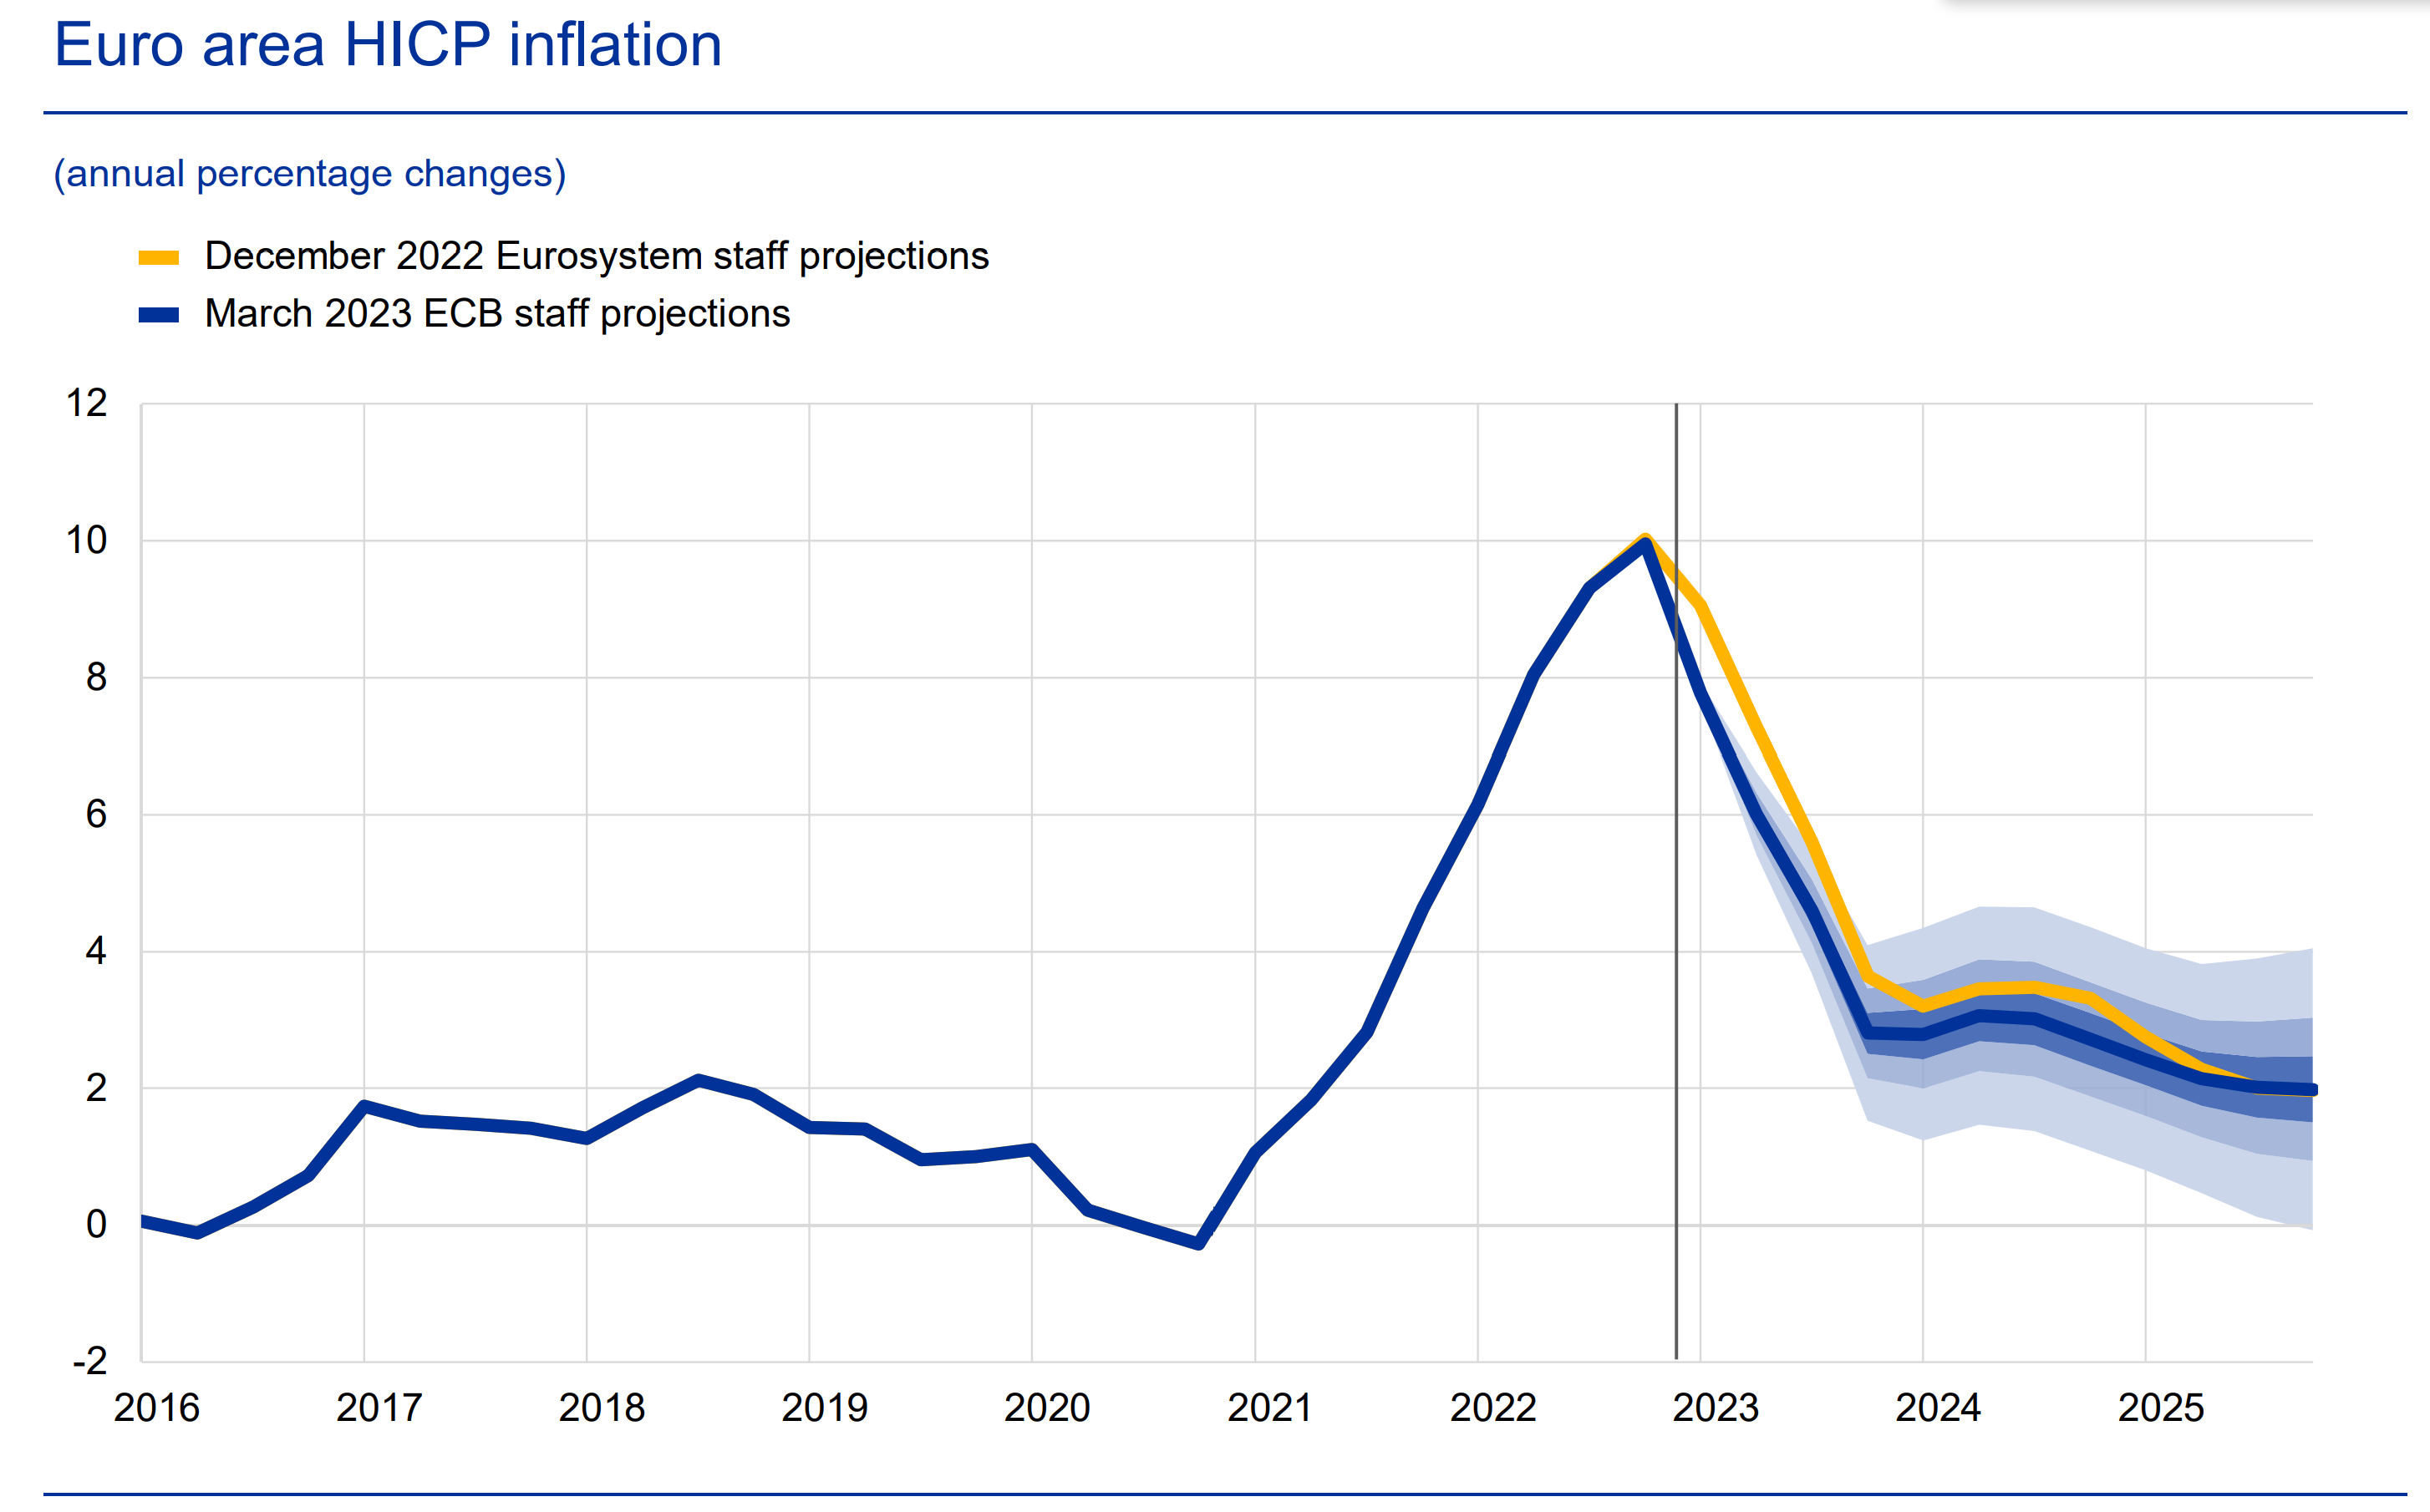
The previous European Central Bank (ECB) peak rate expectations were 5%, which is expected to be the same peak rate but higher for longer interest rates to ward off against volatile price action on consumer and producer price inflation items baskets in European countries. When disinflation ends and reflation starts on energy sector commodities prices, as the legislative measures don't increase supply of commodities to the market but rather pressurize the price of them. The China reopening increaseases the upside risk to inflation given higher demand for energy sector commodities which with the current supply and production energy sector, commodities have upside in the long term, while short term downside given recent increases in production of oil and gas in the United States.
Figure 26. OPEC and Non-OPEC liquid fuels production.
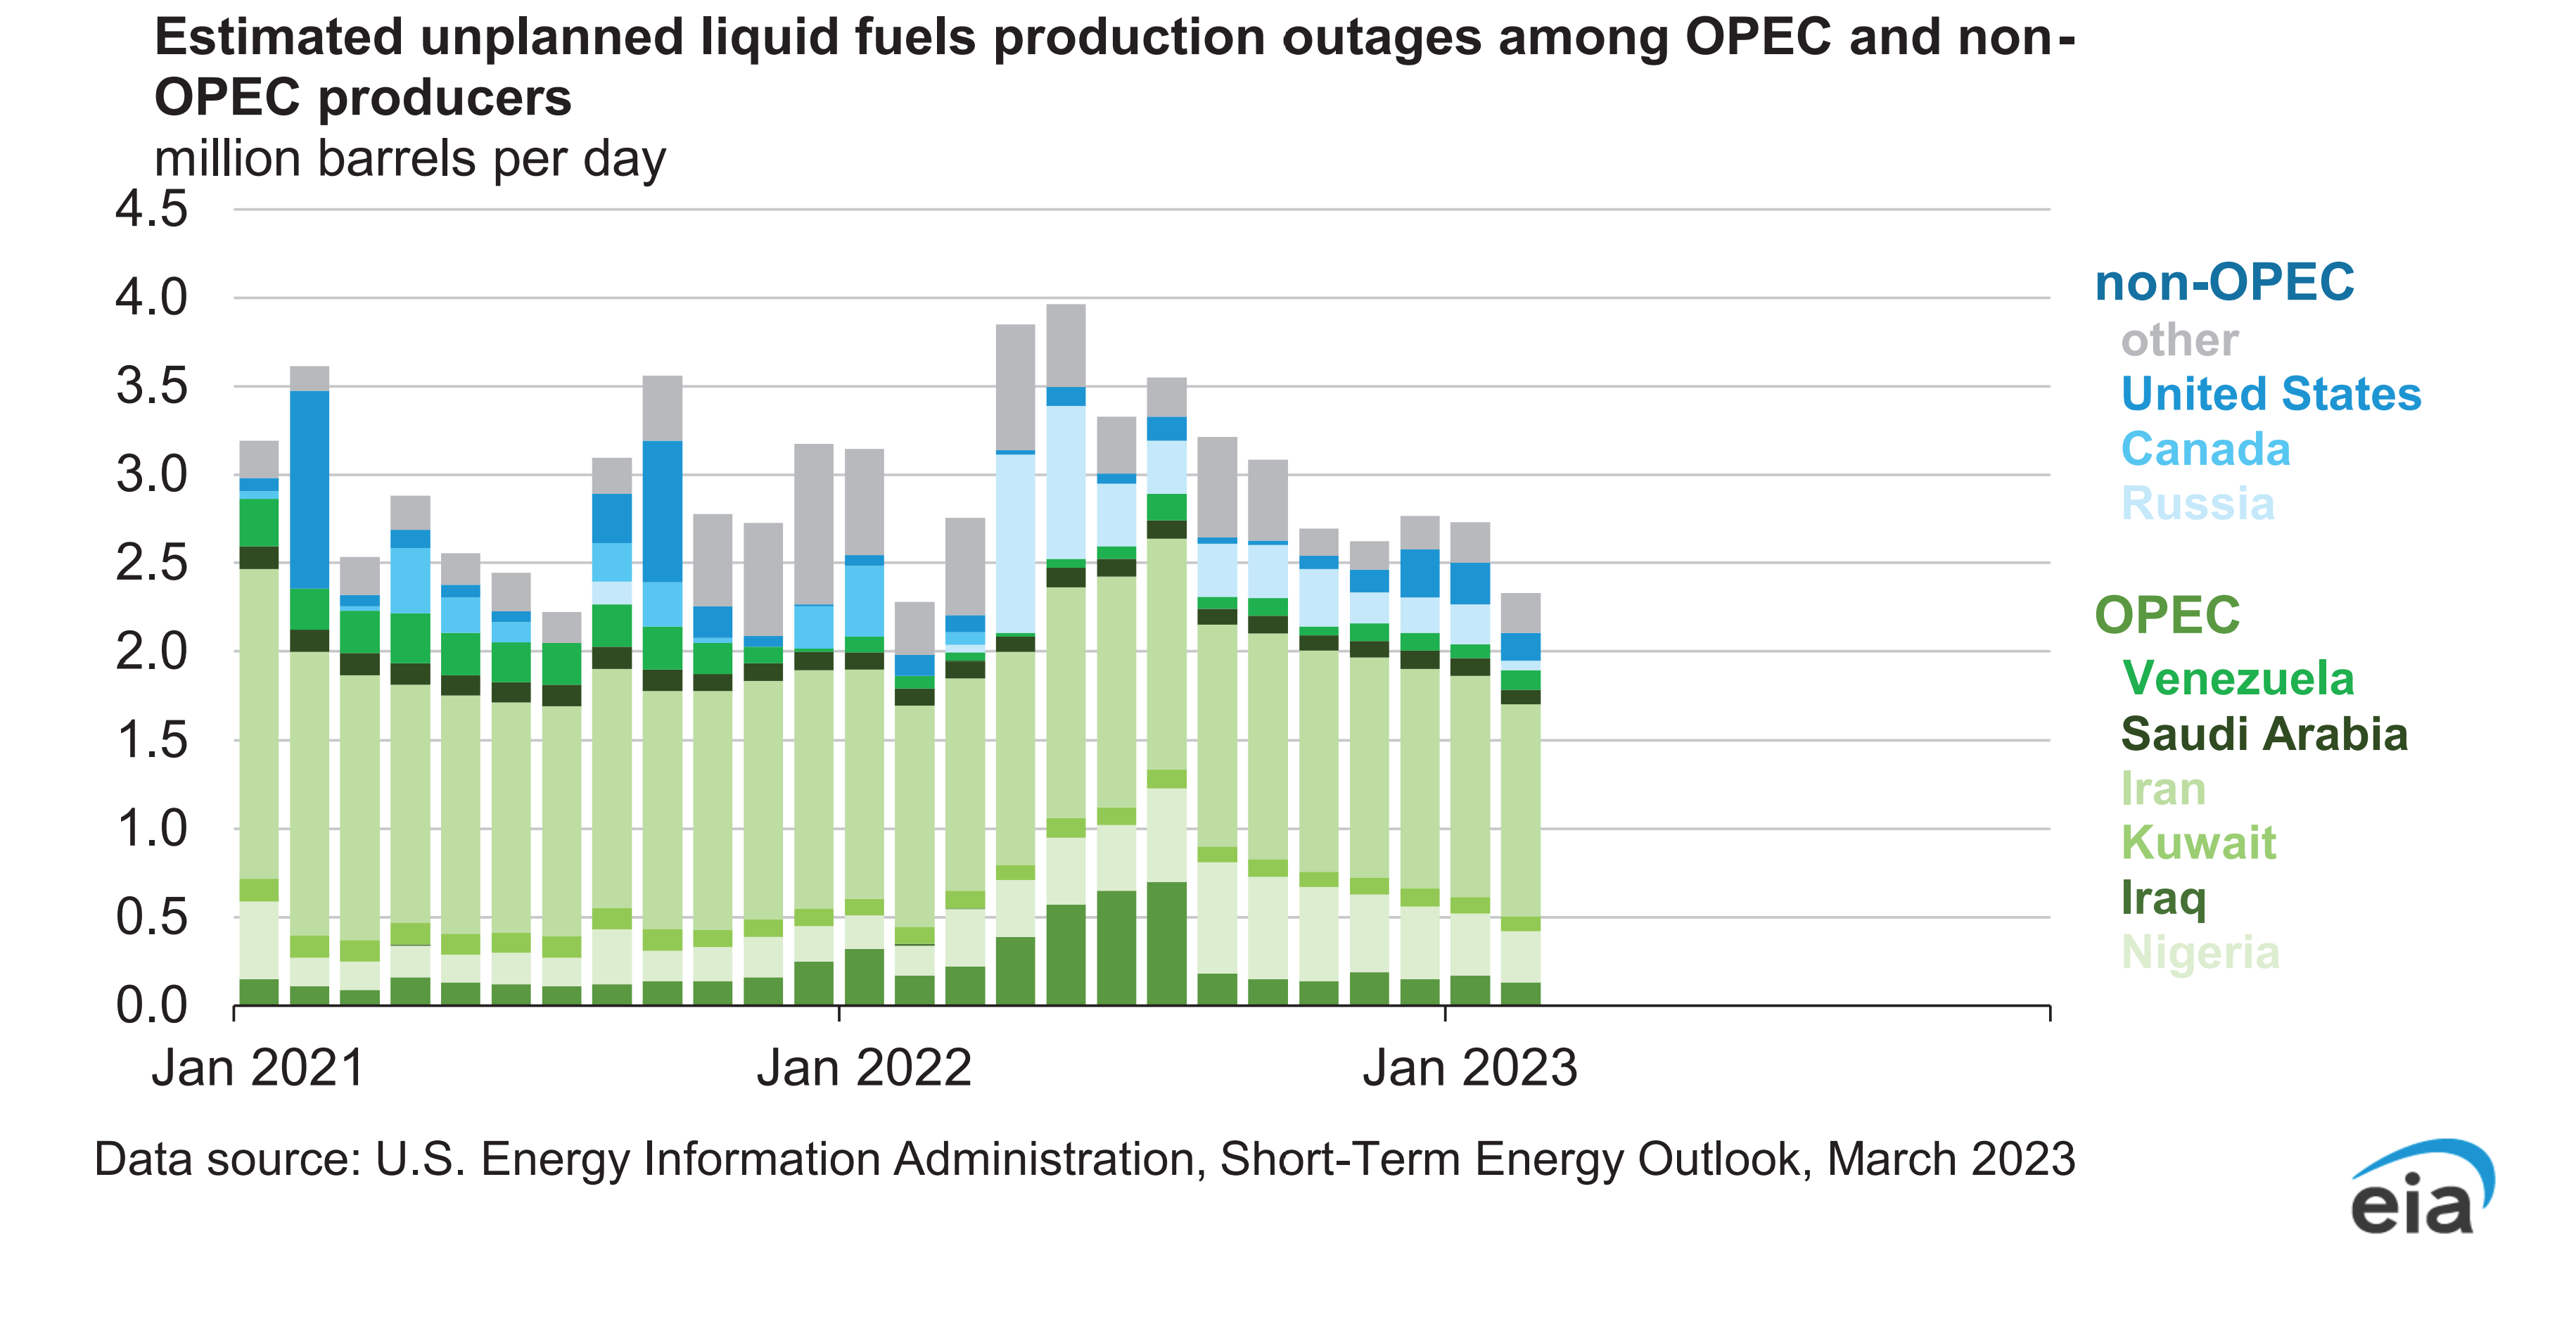
Overall, the stability over energy supply given the United States' and Norway's supply of natural gas has allowed European countries to prepare for the winter which has lowered demand for natural gas and thus lowered natural gas prices. Also, warmer weather has also allowed to reduce demand for natural gas, making the price of natural gas volatile and driven more by speculation than by fundamentals. This is reflected in the next chart.
Figure 27. Chicago Mercantile Exchange (CME) Natural Gas Volatility Index.

Natural gas has more downside as demand is low and storage of natural gas is high compared to seasonal data; thus, the only way of hedging it is the same as what has been mentioned in the figure number 24, the Natural Gas Strangle Replication Strategy Index, as long as the price of natural gas remains volatile, either to the upside or downside, the Natural Gas Strangle Replication Strategy Index will remain profitable.
United Kingdom:
(Previous Analysis 1 (Dec 18, 2022))
(Previous Analysis 2 (Nov 5, 2022))
(Previous Analysis 3 (Oct 31, 2022))
The United Kingdom economy is behaving within the range of expectations as inflation lowers given PM Rishi Sunak's legislative and fiscal policy measures, which are prudent. Those measures are lowering supply-side and demand-side inflationary pressures, allowing the Bank of England's monetary policy measures to lower demand-side inflationary pressures easier through the interest rates. There is a long path until inflation gets to the target of 2%, but government measures and monetary policy measures effects are reflected in the Consumer and Producer Price Indexes, and they're also reflected in the United Kingdom Gross Domestic Product (GDP) data. Rate hike expectations remain the same. As mentioned before, prudent fiscal, legislative, and monetary policy measures enhanced the United Kingdom Government Granted Bonds.
Asia:
China:
(Previous Analysis 1 (Dec 18, 2022))
(Previous Analysis 2 (Nov 5, 2022))
(Previous Analysis 3 (Oct 31, 2022))
(Monetary Policy, Macro/Micro-economic data Analysis part.)
The People’s Bank of China (PBoC) monetary policy stance keeps being the same, maintaining the structural monetary policy guidance, the reopening of the Chinese economy enhances various global markets sectors such as the commodities market and the Chinese consumer sectors, as previously mentioned the Chinese government measures towards enhancing infrastructure has increased the attention of the world, this enhances the forward Chinese Gross Domestic Product (GDP).
Japan:
(Previous Analysis 1 (Dec 18, 2022))
(Previous Analysis 2 (Nov 5, 2022))
(Previous Analysis 3 (Oct 31, 2022))
The coordinated measures by the G7 members over energy prices and the U.S. Federal Reserve’s, the ECB’s and the BoE’s monetary policy tightening measures have exported deflation in Japan through lowering the demand-side inflationary pressures through the interest rates in the countries with high speculative price action on and over goods; this is given by globalization.
Inflationary pressures in Japan have lowered from a four-decade high. Given Japan's industrial production of goods and the still ultra-dovish monetary policy stance of the Bank of Japan, supply-side and demand-side inflation risks are to the upside in Japan. The Japanese government's measures to counter inflationary pressures keep being inflationary as Abenomics-style fiscal policy guidance is still in place in Japan, thus the outlook remains the same.
Do feel free to share, leave a comment and subscribe to Quantuan Research Substack if you want, by using the next buttons.