


What is expected next week.

Next week there are important data releases:
United States:
Current ISM Manufacturing PMI:
50.9
Expected ISM Manufacturing PMI:
50.1
The ISM Manufacturing PMI is an index that measures the change in production levels in the United States economy. It indicates the level of demand for products by measuring the amount of ordering activity at the nation's factories in the Manufacturing sector. Which can show if the monetary policy tightening path is working or not, because the change shows the variation in demand.
The Job Openings and Labor Turnover Survey (JOLTS) Data.
Current Job Openings and Labor Turnover Survey (JOLTS):
10.053MLN
Expected Job Openings and Labor Turnover Survey (JOLTS):
10.2MLN
The Job Openings and Labor Turnover Survey (JOLTS) data is essential to identify changes in the job market, given the fact that this data shows the change in job openings, hires, quits, layoffs, and discharges. Which can show if the monetary policy tightening path is working or not, because the change shows if the tightening path is harming the job market or not.
The ADP Employment Change Data.
Current ADP Employment Change:
+208K
Expected ADP Employment Change:
+190K
The ADP Employment data shows the change in employment data all over the United States’ private sector. The variation of it shows the strength of the private sector job market. Which can show if the monetary policy tightening path is working or not, because the change shows if the tightening path is harming the job market or not.
United States Federal Reserve Interest Rate Decision.
Current Interest Rate:
3.25%
Expected Interest Interest Rate Decision:
4%
ISM Non-Manufacturing PMI Data.
Current ISM Non-Manufacturing PMI:
56.70
Expected ISM Non-Manufacturing PMI:
56.10
The ISM Non-Manufacturing PMI is an index that measures the change in production levels in the United States economy. It indicates the level of demand for products by measuring the amount of ordering activity in the United States' Non-Manufacturing sector. Which can show if the monetary policy tightening path is working or not, because the change shows the variation in demand.
Current Non Farm Payrolls (NFP):
+263K
Expected Non Farm Payrolls (NFP):
+240K
The Non Farm Payroll data shows the change in employment data all over the United States; the variation of it shows the strength of the job market. Which can show if the monetary policy tightening path is working or not, because the change shows if the tightening path is harming the job market or not.
Current Unemployment Rate:
Year over Year: 3.5%
Expected Unemployment Rate:
Year over Year: 3.5%
The Unemployment Rate data shows the change in employment data all over the United States; the variation of it shows the strength of the job market. Which can show if the monetary policy tightening path is working or not, because the change shows if the tightening path is harming the job market or not.
The ISM Manufacturing PMI data and Non-Manufacturing PMI data will show if demand is cooling or not with the rate hiking and monetary policy tightening path. The job market is strong, as mentioned before. The Job Openings and Labor Turnover Survey (JOLTS) data, the Non Farm Payroll data, and ADP Employment data will show if the tightening path is harming the job market or not.
The last Gross Domestic Product (GDP) data showed that the United States economy is not slowing down, the 2.6% Gross Domestic Product increase was mostly driven by trade, given the energy and defense systems trade of the United States to Europe.
Figure 1. Taylor Rule Fed Funds Prescription Heatmap for 2022:Q4
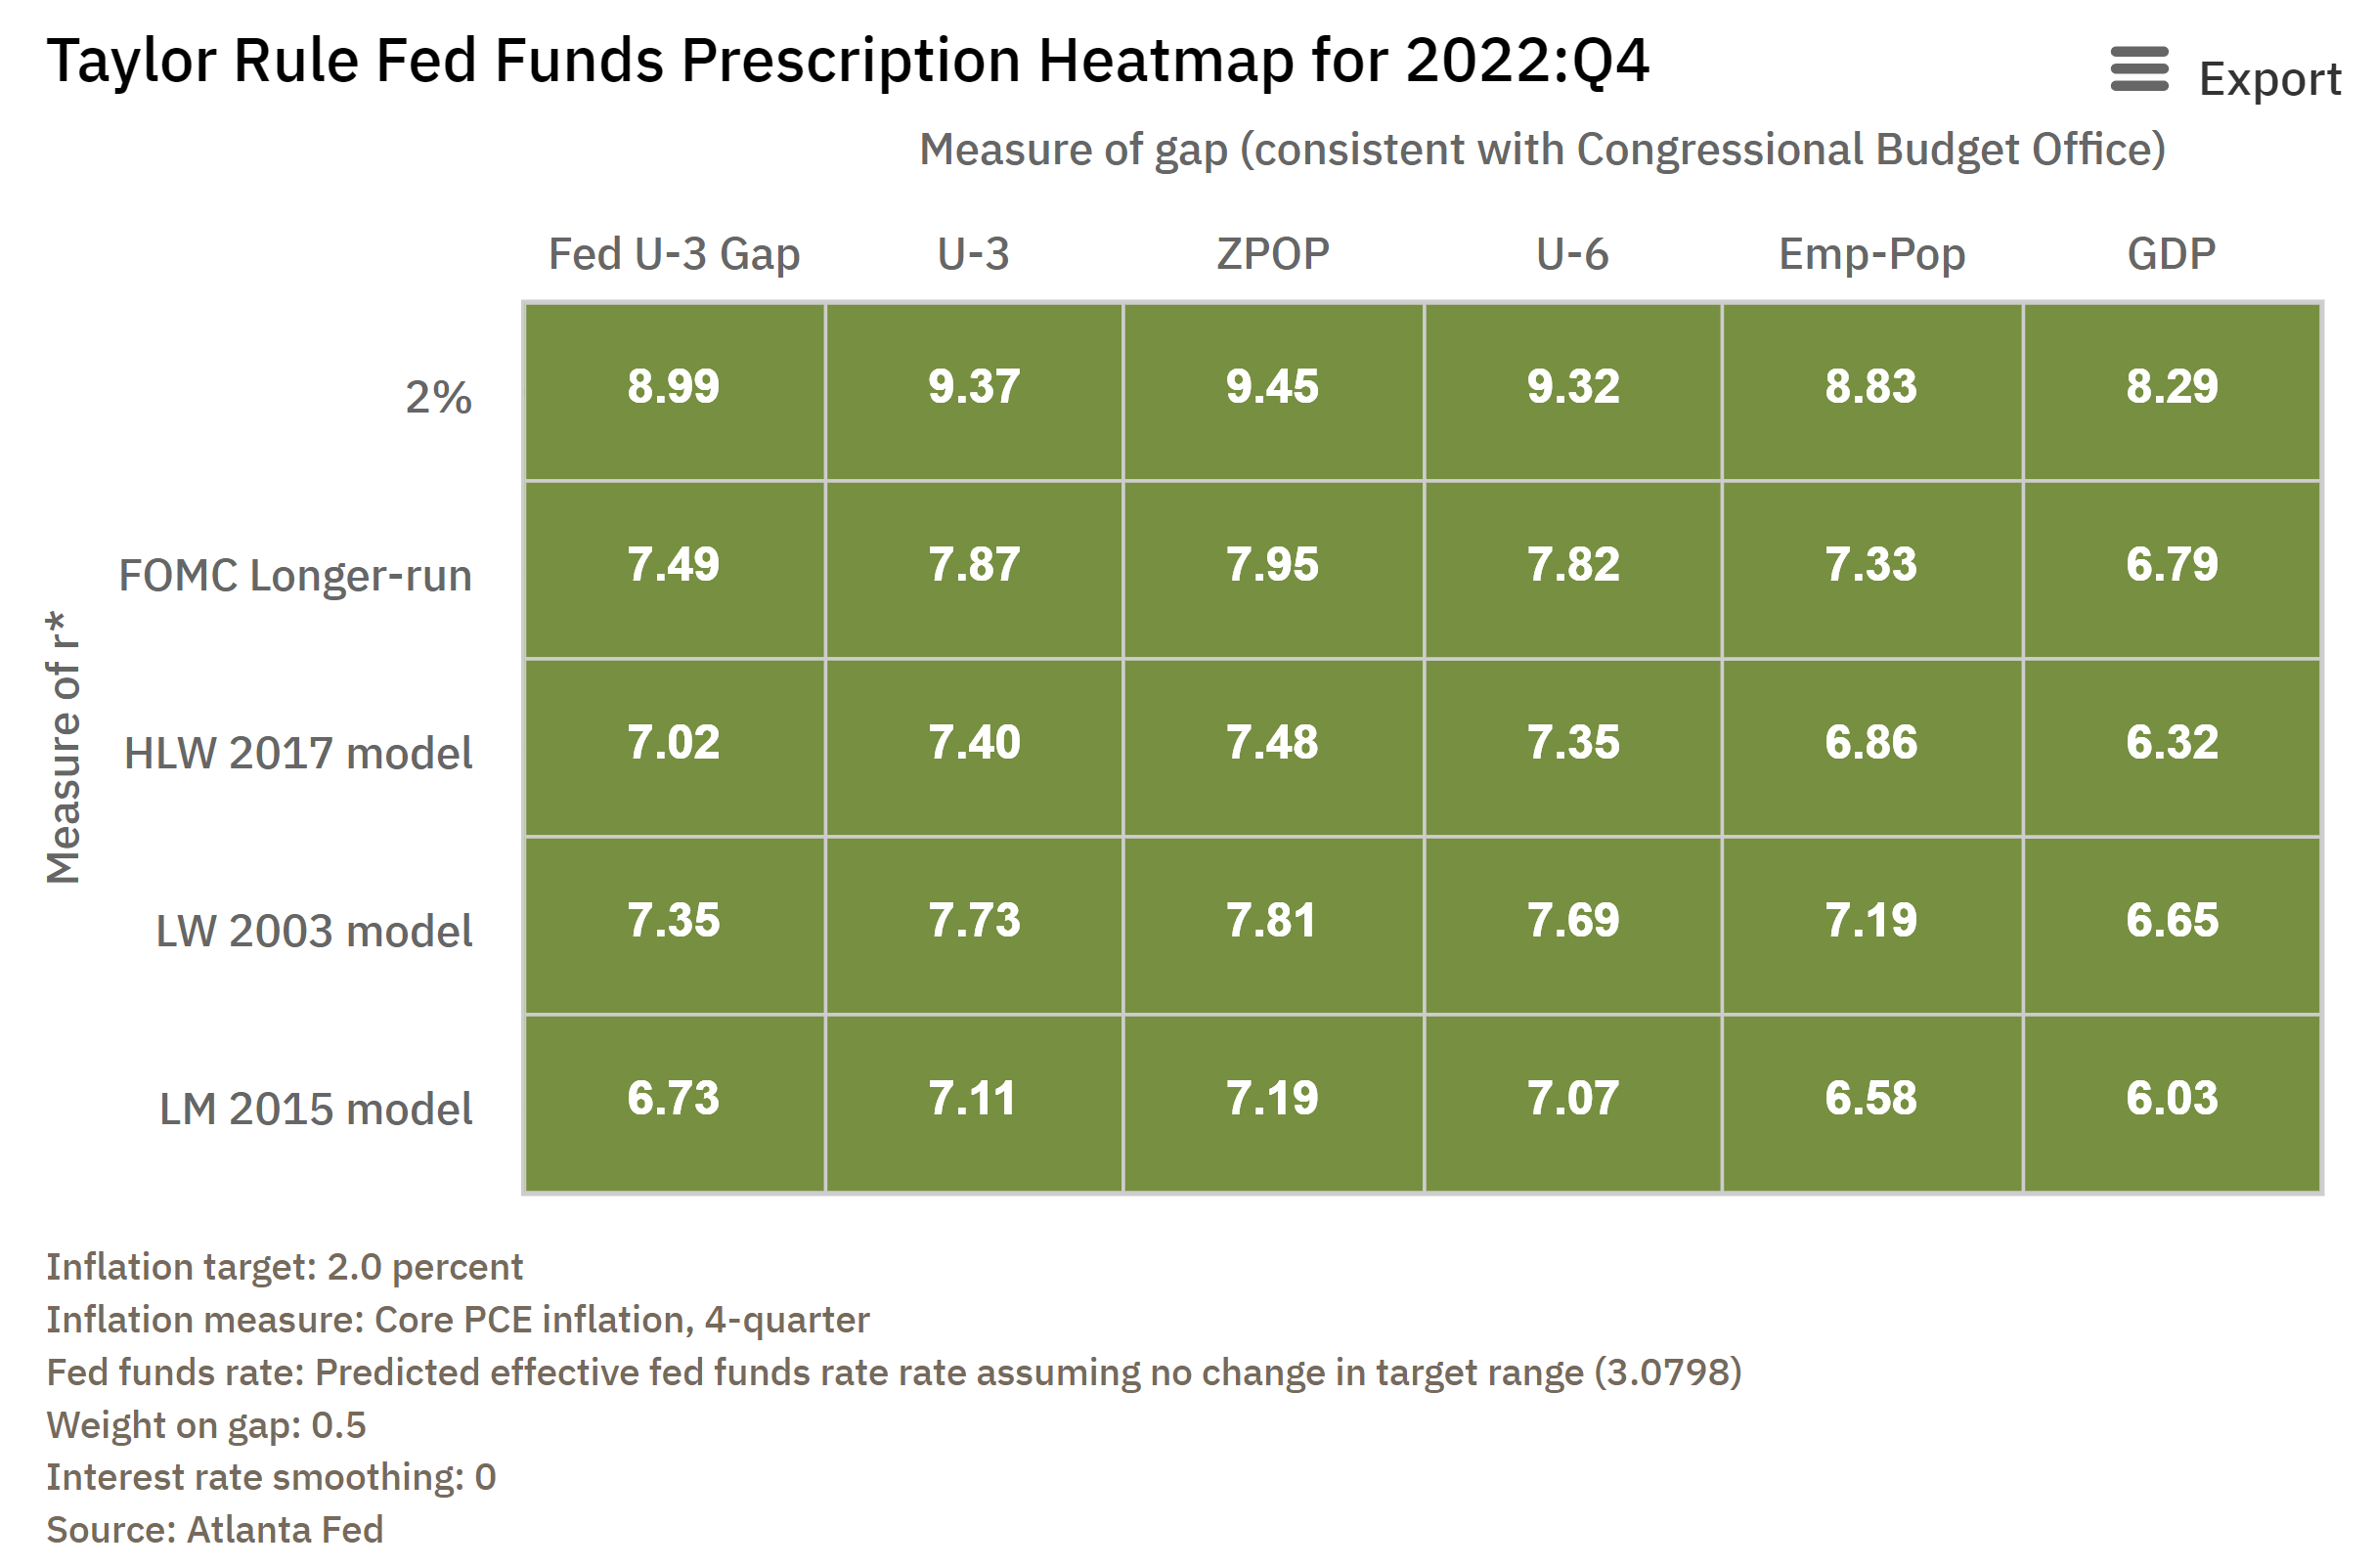
Given the fact that inflation is mostly driven by supply and demand side inflationary pressures caused by the Biden Administration's legislative and fiscal policy measures as mentioned before, and the Federal Reserve doesn’t have the tools to lower supply-side inflationary pressures nor make the government lower spending as much as it wants.
"There is nothing to prevent the government from creating as much money as it wants."
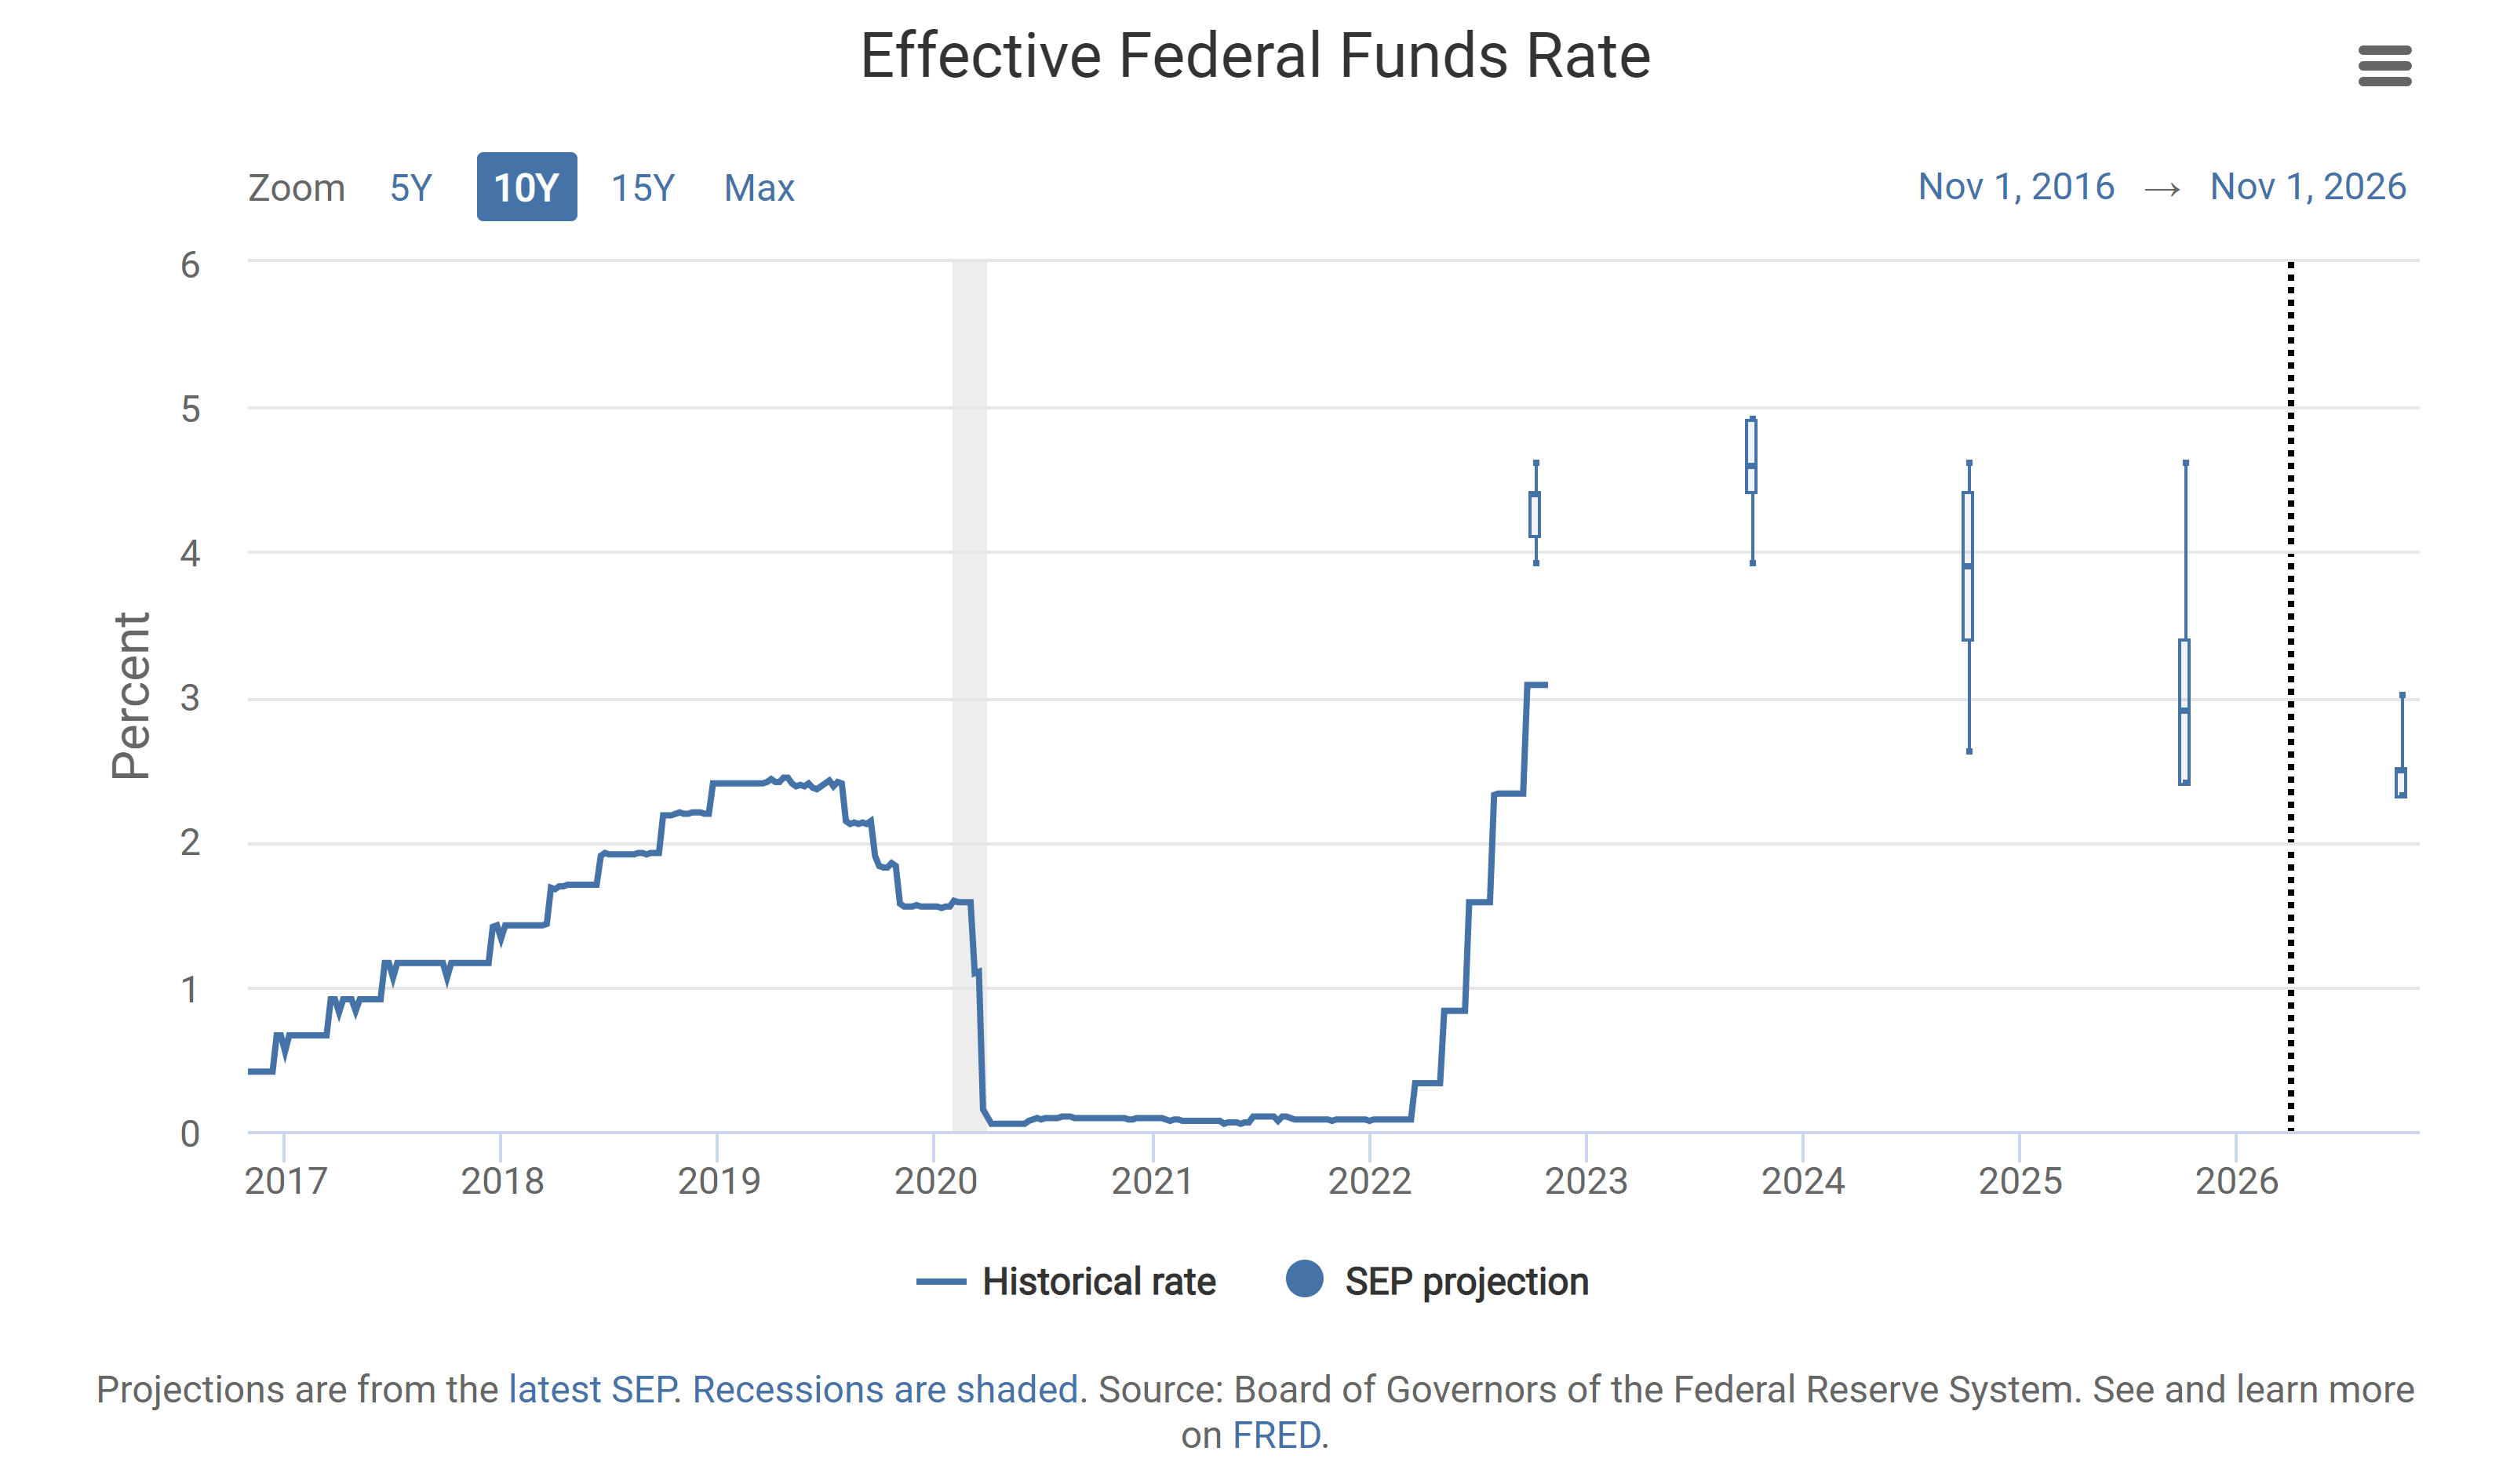
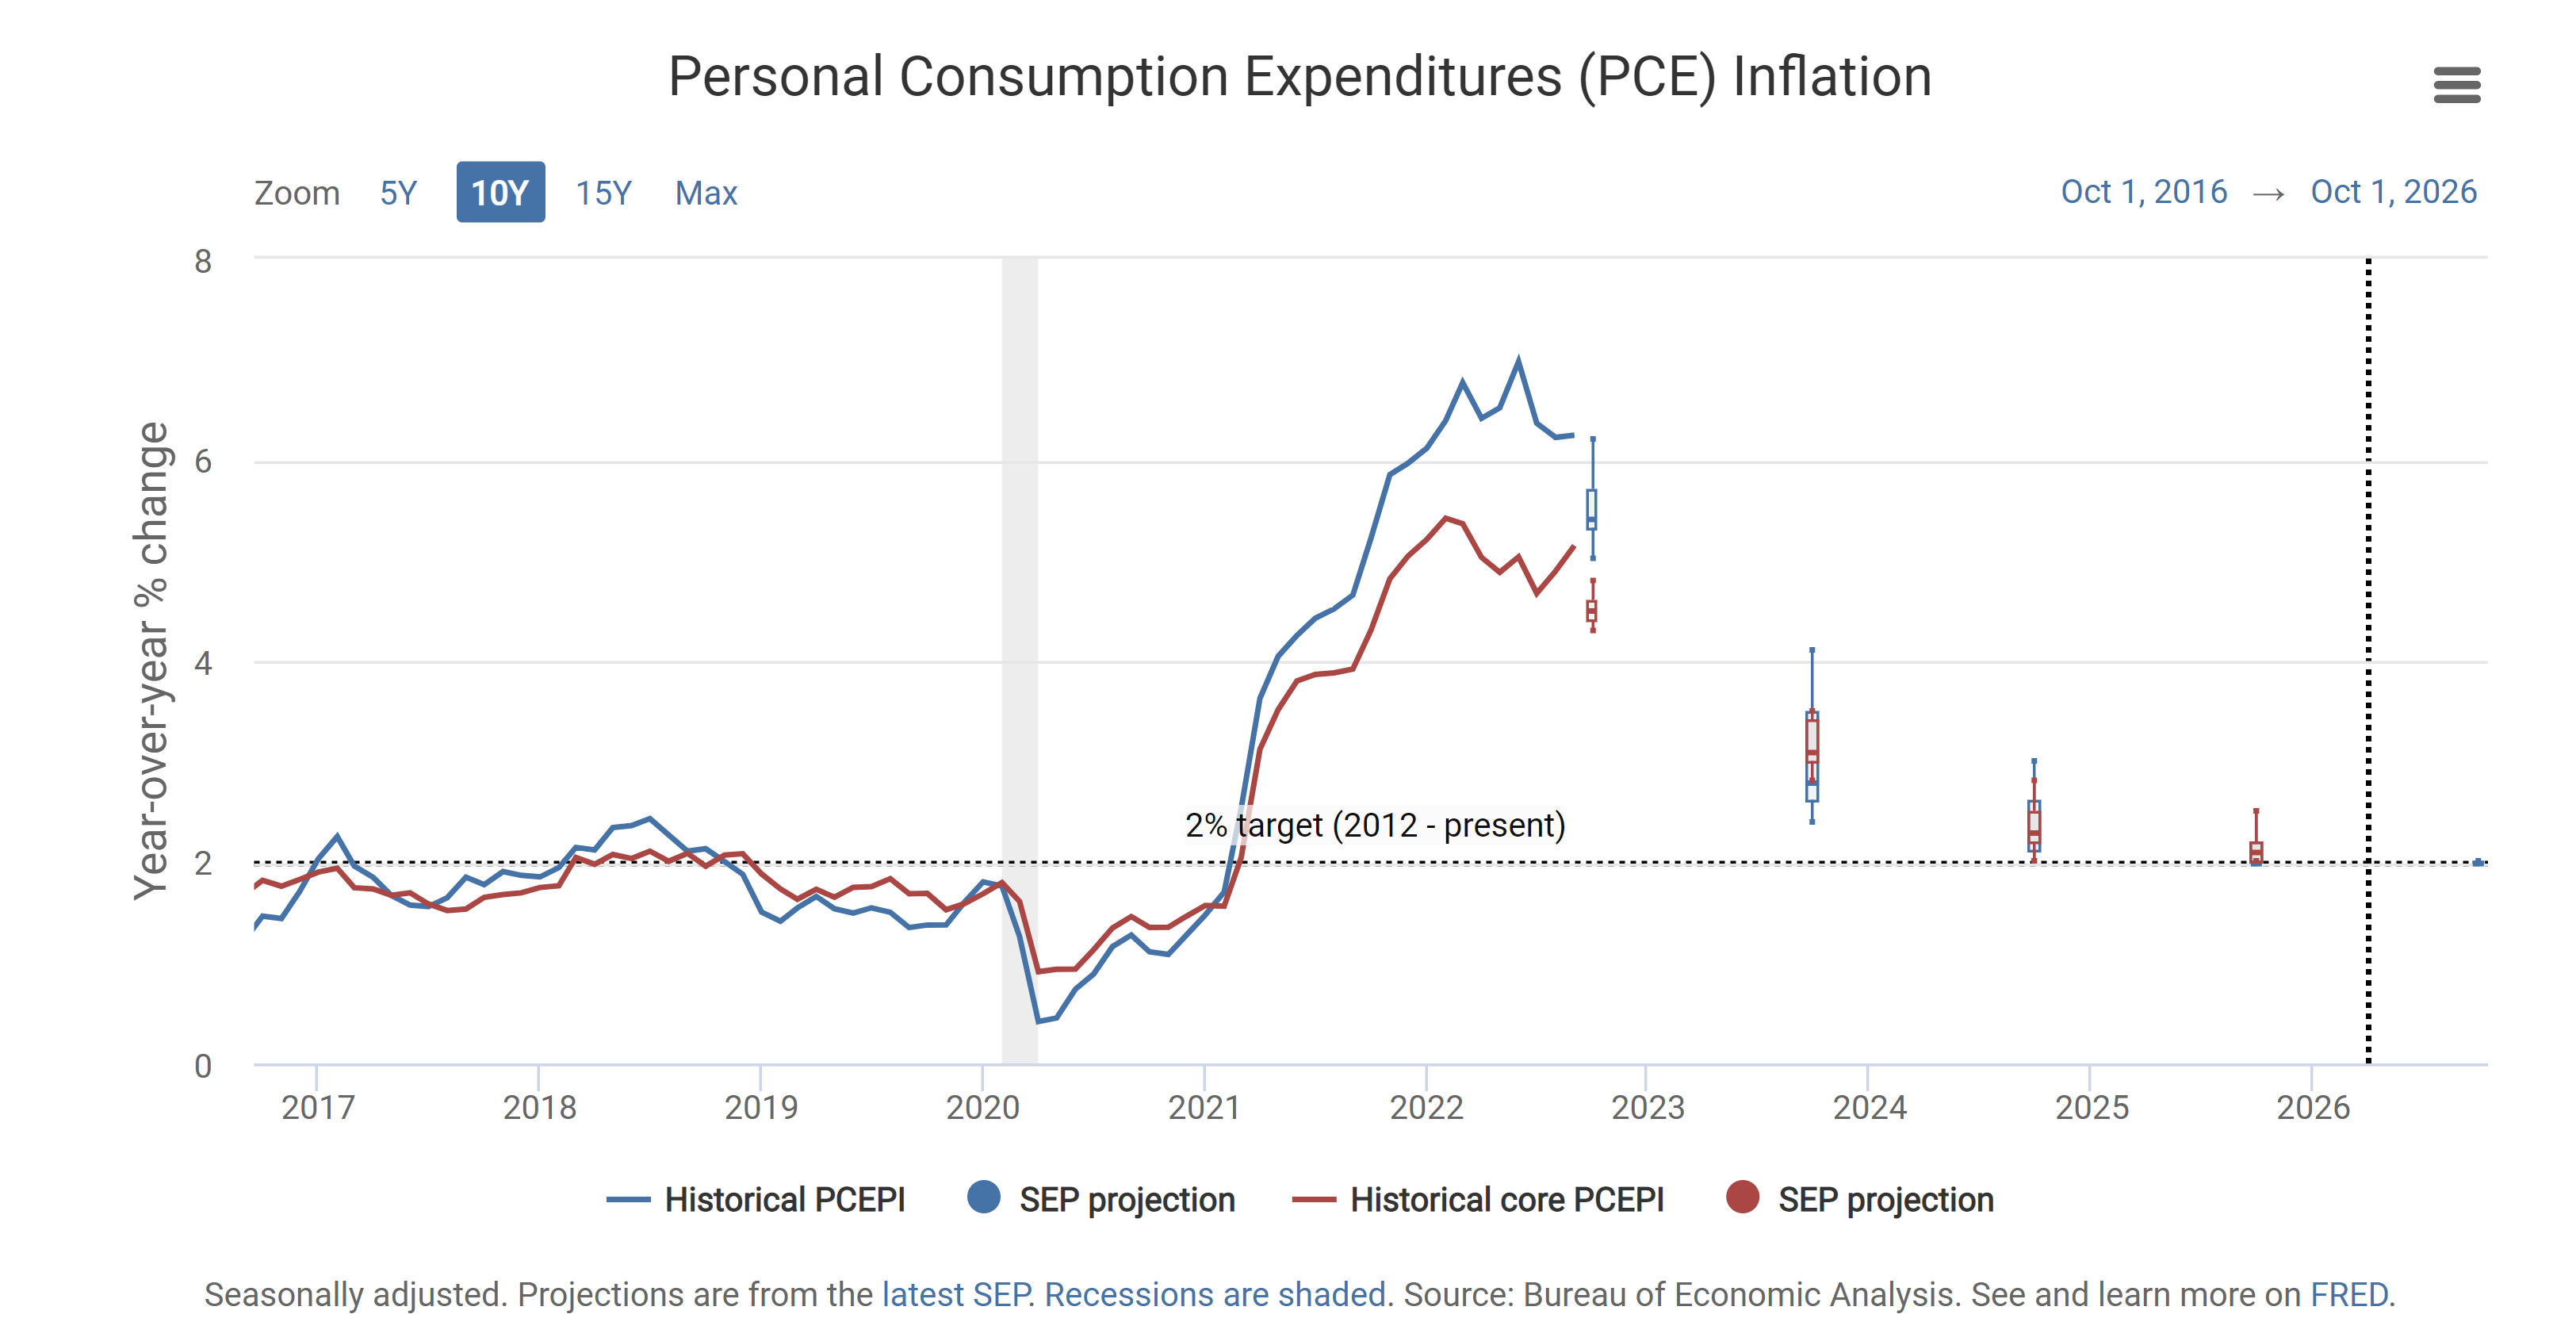
It’s coherent that the forward guidance by the Federal Open Market Committee (FOMC) is hawkish but nimble to lower inflation without causing a recession, as shown by the data in the next two charts.
Figure 2. Effective Federal Funds Rate Projections
Fifure 3. Personal Consumption Expenditures (PCE) Inflation Projections
To conclude
(…) “Ending inflation means freeing all Americans from the terror of runaway living costs.” (…) “We have every right to dream heroic dreams. Those who say that we're in a time when there are not heroes, they just don't know where to look.” (…) “Above all, we must realize that no arsenal or no weapon in the arsenals of the world is so formidable as the will and moral courage of free men and women.” (…)
Source: Ronald Reagan Presidential Library & Museum
Europe:
Current Inflation Rate:
Year over Year: 9.9%
Month over Month: 1.2%
Expected Inflation Rate:
Year over Year: 10.4%
Month over Month: 1.3%
The change in the Inflation Rate data shows the rate in which the currency depreciates by the rise in goods cost due to de-equilibrums between supply and demand. Which can show if the monetary policy tightening path is working or not, because the change shows if the tightening path is lowering inflation by decreasing demand-side inflationary pressures or not.
Gross Domestic Product (GDP) Growth Rate Data.
Current Gross Domestic Product (GDP) Growth Rate:
Year over Year: 4.1%
Expected Gross Domestic Product (GDP) Growth Rate:
Year over Year: 2.5%
The change in the Gross Domestic Product data shows the health of the economy by increasing or decreasing depending on the conditions on which the economy is behaving. Which can show if the monetary policy tightening path is working or not, because the change shows if the tightening path is harming the economy or not.
Current Unemployment Rate:
Year over Year: 6.6%
Expected Unemployment Rate:
Year over Year: 6.6%
The Unemployment Rate data shows the change in employment data all over Europe; the variation of it shows the strength of the job market. Which can show if the monetary policy tightening path is working or not, because the change shows if the tightening path is harming the job market or not.
The recent increases in inflation in Europe are given by supply-side inflationary pressures caused by politicians in Europe. Which the European Central Bank can’t help to decrease supply-side inflationary pressures. Like any other central bank, the European Central Bank has the tools to lower demand-side inflationary pressures through Quantitative Tightening and interest rate increases, in order to reduce the M2 quantity going after goods and to reduce speculative demand for goods, which allows them to build inventories of goods in demand, which eventually makes inflation lower as the supply rate of goods increases and the rate of demand for goods lower.
As mentioned before in this thread:


The forward inflation in Europe will be determined by European countries’ governments' efforts towards increasing domestic production of goods in demand by the consumer. The energy situation in Europe has solutions for countries that have below or equal to 50% dependence on Russian natural gas to have energy. The rest of European countries have a high probability of recession.
As mentioned before in this thread:


The natural gas inventories of European countries are high, which is what has recently pushed down natural gas prices. The price caps on commodities will never work because price caps don’t increase supply but increase demand as buying becomes cheaper, which causes backwardation of the prices under the price cap and allows a monopoly on physical prices of the commodities or goods under the price cap.
Lagarde called on governments not to adopt measures that will fuel inflation on the 16th of September 2022, which is coherent and proves that She doesn’t want a recession. Also, the press conference of Lagarde on the 27th of October 2022, reaffirmed her commitment to lower inflation without causing a recession by saying what She said.
United Kingdom:
Bank of England Interest Rate Decision.
Current Interest Rate:
2.25%
Expected Interest Rate Decision:
3%
The recent increases in inflation in the United Kingdom are adhered to fiscal policy and legislative policies by the previous PM of the United Kingdom Liz Truss, which Liz Truss has resingned as She should given the harm that Liz Truss has made to the United Kingdom by her fiscal and legislative policies that have increased supply-side and demand-side inflation in the United Kingdom.
Liz Truss’ tax cuts increased demand side inflation as it boosted demand over goods by allowing the consumer increase spending by the decrease in taxes, which lowered supply which resulted in higher inflation. Apart from the legislative measures such as the spending on energy bills support for the consumer which boosted demand-side inflationary pressures by making the consumer consume essential base goods such as energy, increased inflation.
The whole thread, if you want to read it.
The Bank of England doesn’t have the tools to make supply-side inflationary pressures lower. Like any other central bank, the Bank of England has the tools to lower demand-side inflationary pressures through Quantitative Tightening and interest rate increases, in order to reduce the M2 quantity going after goods and to reduce speculative demand for goods, which allows them to build inventories of goods in demand, which eventually makes inflation lower as the supply rate of goods increases and the rate of demand for goods lowers.
A coherent change in fiscal and legislative policies is expected given the new PM of the United Kingdom, Rishi Sunak. He must focus on increasing the supply of goods through legislative actions to allow an increase in domestic production of goods to match the UK’s supply and demand curve, allowing a better path for the Bank of England in which to lower inflation without causing recession.
The whole thread, if you want to read it.
Congratulations to Rishi Sunak for being the new PM of the United Kingdom.
To conclude
(…) “the price of greatness is responsibility” (…)
Asia:
China:
Caixin Manufacturing PMI Data.
Current Caixin Manufacturing PMI:
48.1
Expected Caixin Manufacturing PMI:
50.3
The Caixin Manufacturing PMI is an index that measures the change in production levels in China’s economy. It indicates the level of demand for products by measuring the amount of ordering activity at the nation's factories in the Manufacturing sector.
Congratulations to Xi Jinping on his third term.
The commentary over China is the same as in August.
Japan:
Current Consumer Confidence:
30.8
Expected Consumer Confidence:
30
The change in the Consumer Sentiment data is important given the fact that it shows the consumers' confidence in their government and monetary policy regulators, which are the ones that manage the economy and the currency.
The Bank of Japan's continuous use of the Modern Monetary Theory (MMT) even though it is devaluing the Japanese Yen and is also increasing inflation in Japan, is what will make Japanese consumer confidence fall. The non-existing coherence of the Bank of Japan and the Japanese government towards decreasing inflation is what is and will keep devaluing the Japanese Yen until the Bank of Japan’s Kuroda and Japan’s PM Fumio wind down Abenomics and MMT.
Figure 4. Japanese Yen Devaluation:

Figure 5. Tokyo inflation
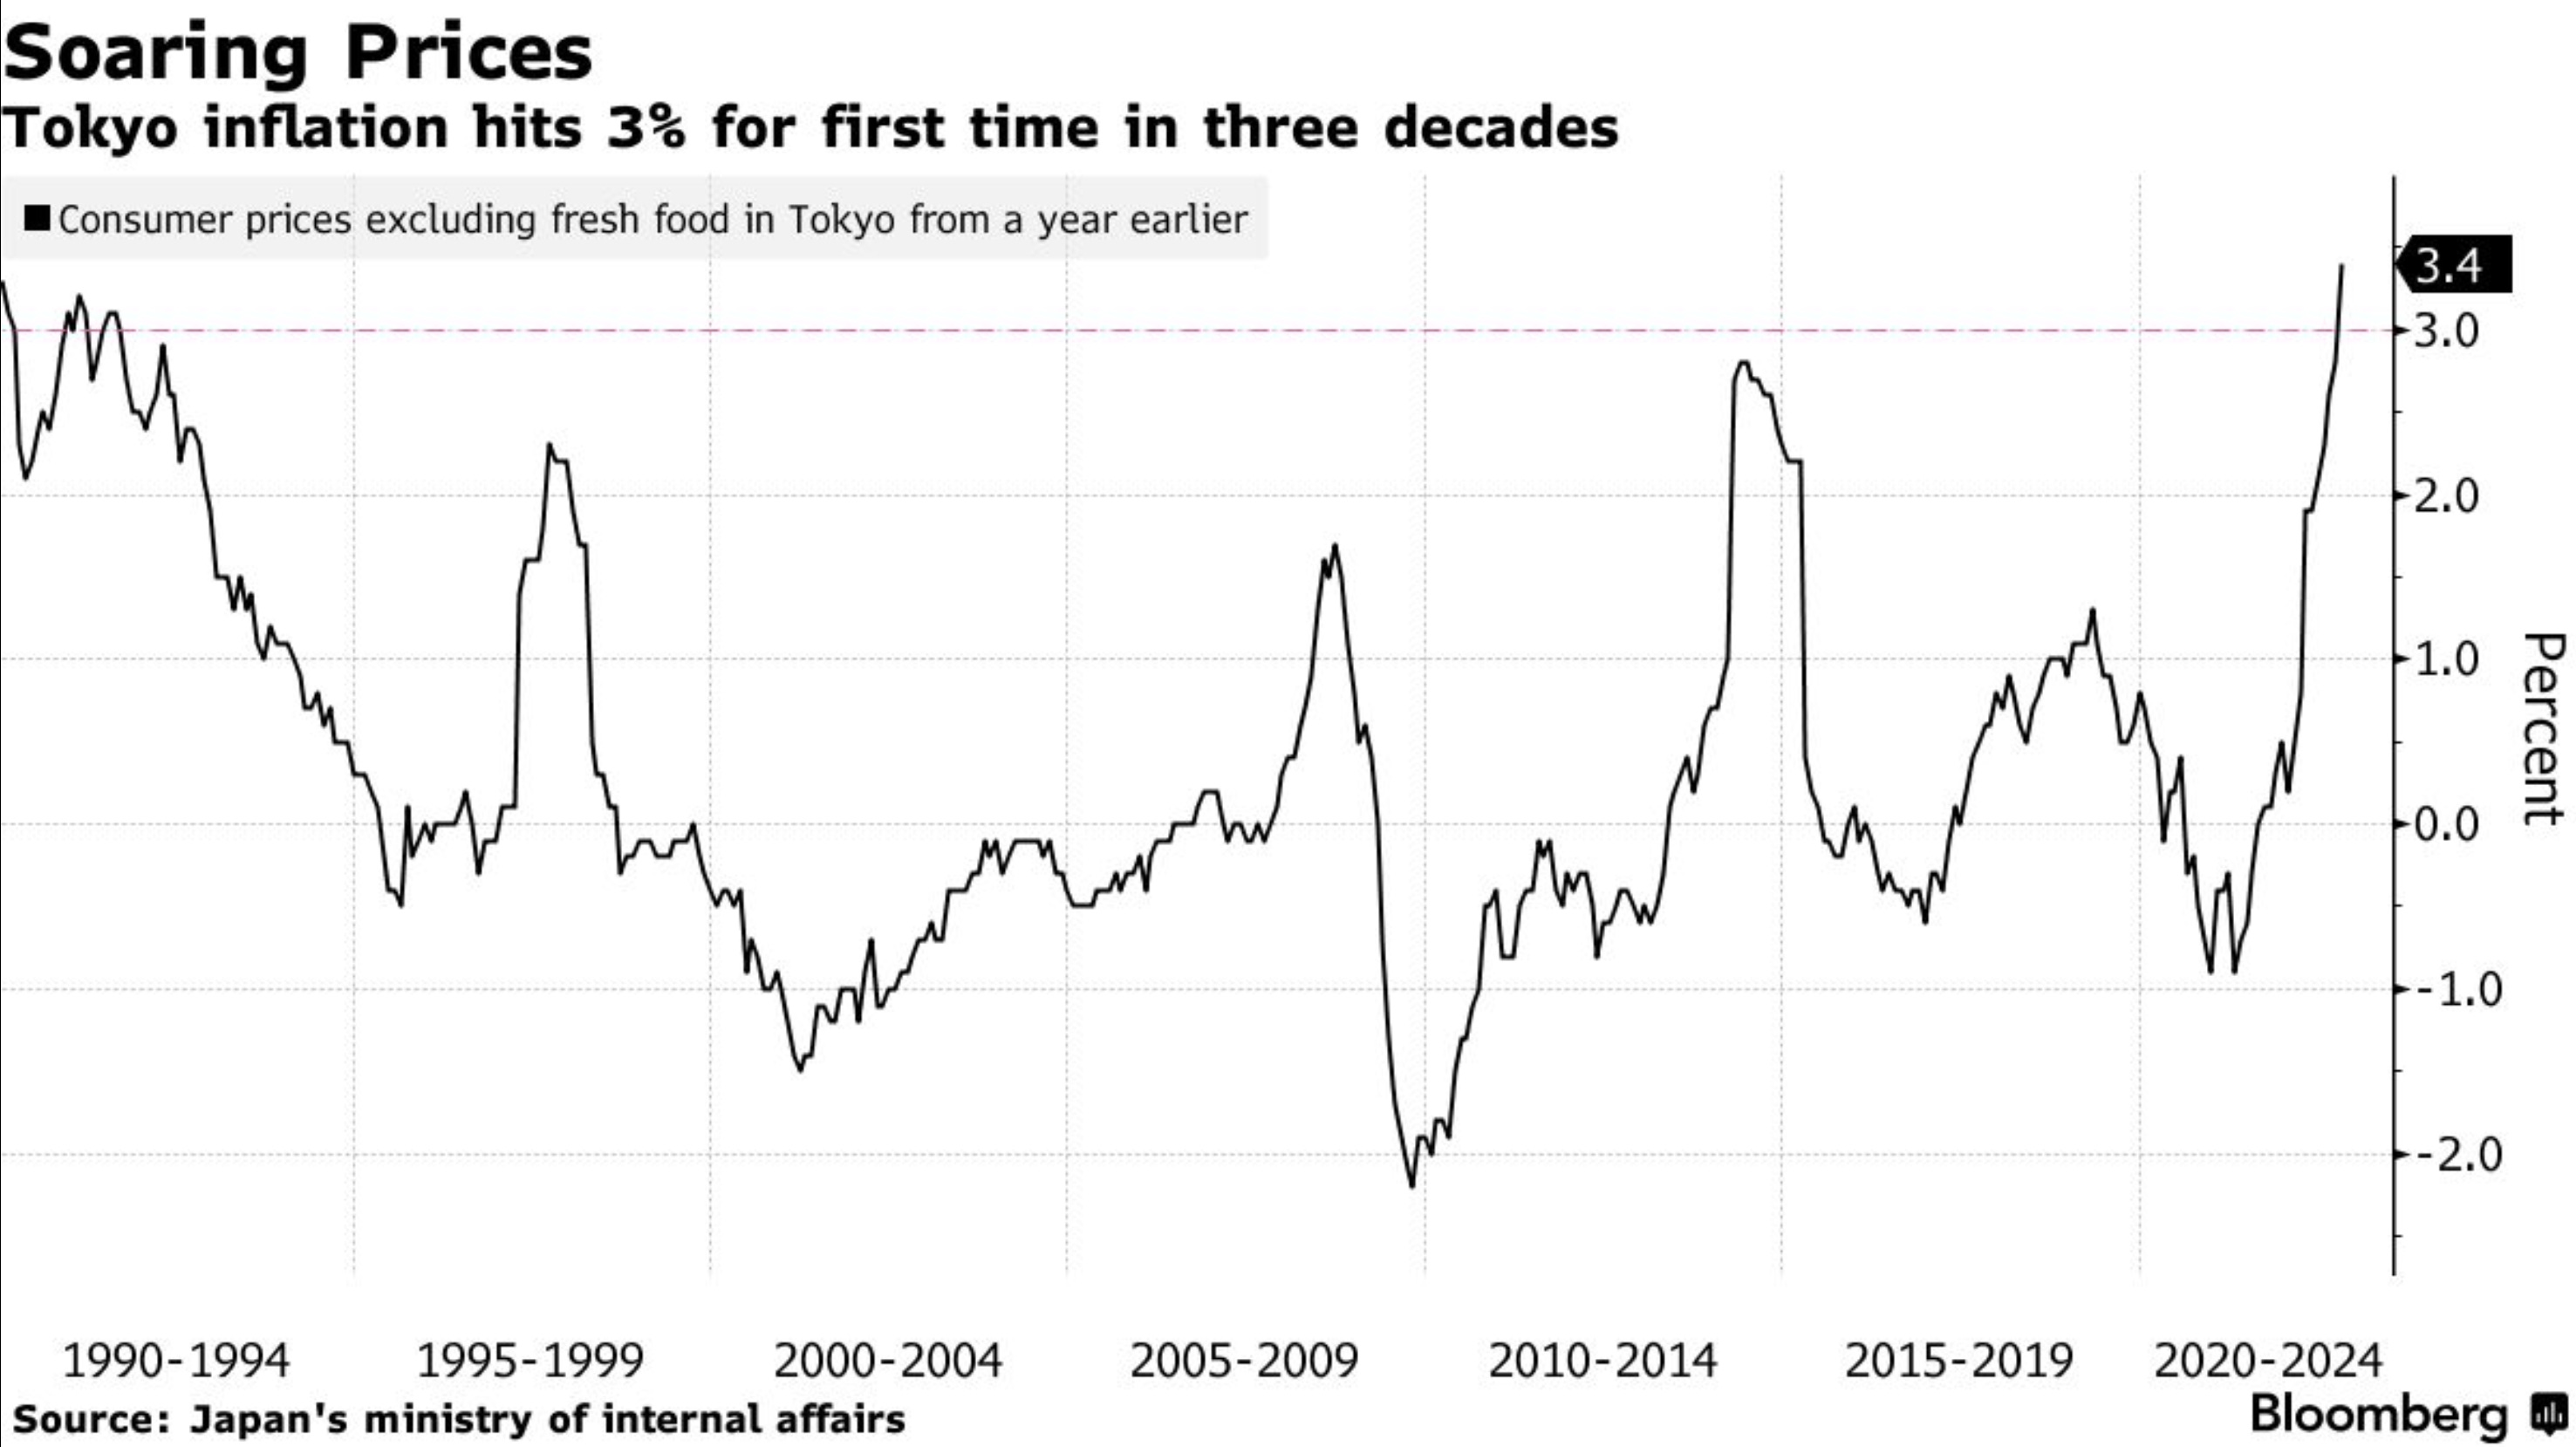
To put this in perspective, a piece of paper on which you can write has more value than the Japanese Yen. Kuroda has chosen the hyperinflation path.
¥1 Japanese Yen equals to $0.0068 United States Dollars
(Data as of Friday, 28th October 2022 Market Close.)

The current volatility in the market:
Figure 6. CME E-Mini S&P 500, volatility cone:

Figure 7. E-mini S&P 500, ESZ2 (16 December 2022 Expiration) Max Pain* at 3900

*The “Max Pain” or “Maximum Pain” of an option series is the underlying price at option expiration that results in minimum total intrinsic value for all outstanding options in the series. The Max Pain for option buyers is also the “Max Pleasure” for option sellers.
Figure 8. E-mini S&P 500, ESZ2 (16 December 2022 Expiration) Open Interest change and Volume change:

Figure 9. E-mini S&P 500, ESZ2 (16 December 2022 Expiration) Churn (Open Interest Change/Volume) and Expected Volatility Ranges by Delta:

Figure 10. E-mini S&P 500, ESZ2 (16 December 2022 Expiration) Volatility Ranges by strike:

Figure 11. E-mini S&P 500, EWV2 (31 October 2022 Expiration) Max Pain* at 3810

*The “Max Pain” or “Maximum Pain” of an option series is the underlying price at option expiration that results in minimum total intrinsic value for all outstanding options in the series. The Max Pain for option buyers is also the “Max Pleasure” for option sellers.
Figure 12. E-mini S&P 500, EWV2 (31 October 2022 Expiration) Open Interest change and Volume change:

Figure 13. E-mini S&P 500, EWV2 (31 October 2022 Expiration) Churn (Open Interest Change/Volume) and Expected Volatility Ranges by Delta:

Figure 14. E-mini S&P 500, EWV2 (31 October 2022 Expiration) Volatility Ranges by strike:

Figure 15. CME E-Mini Nasdaq 100, volatility cone:

Figure 16. E-mini NASDAQ 100, NQZ2 (16 December 2022 Expiration) Max Pain* at 12100

*The “Max Pain” or “Maximum Pain” of an option series is the underlying price at option expiration that results in minimum total intrinsic value for all outstanding options in the series. The Max Pain for option buyers is also the “Max Pleasure” for option sellers.
Figure 17. E-mini NASDAQ 100, NQZ2 (16 December 2022 Expiration) Open Interest change and Volume change:

Figure 18. E-mini NASDAQ 100, NQZ2 (16 December 2022 Expiration) Churn (Open Interest Change/Volume) and Expected Volatility Ranges by Delta:

Figure 19: E-mini NASDAQ 100, NQZ2 (16 December 2022 Expiration) Volatility Ranges by strike:

Figure 20. E-mini NASDAQ 100, NEV2 (31 October 2022 Expiration) Max Pain* at 11600

*The “Max Pain” or “Maximum Pain” of an option series is the underlying price at option expiration that results in minimum total intrinsic value for all outstanding options in the series. The Max Pain for option buyers is also the “Max Pleasure” for option sellers.
Figure 21. E-mini NASDAQ 100, NEV2 (31 October 2022 Expiration) Open Interest change and Volume change:

Figure 22. E-mini NASDAQ 100, NEV2 (31 October 2022 Expiration) Churn (Open Interest Change/Volume) and Expected Volatility Ranges by Delta:

Figure 23. E-mini NASDAQ 100, NEV2 (31 October 2022 Expiration) Volatility Ranges by strike:

Figure 24. Market QuikDNA™ Volatility Statistics:

It’s remarkable that the current market environment isn’t as volatile as it normally is, seasonality and data driven volatility has been more notable in commodities and index futures than in other markets, given geo-political driven data and political driven measures that have an impact on commodities and index market futures prices and spot prices, which isn’t something new.
As explained before:

The whole thread, if you want to read it:
Do feel free to share, leave a comment and subscribe to Quantuan Research Substack if you want, by using the next buttons.