


Remarks over this week's data.
Analysis of this week's microeconomic data, macroeconomic data, political data, geo-political data and monetary policy with commentary on it.

United States:
This week’s United States ISM Manufacturing PMI data has come above market expectations, which has pushed the dollar higher. As it showed no drastic slow down in the United States manufacturing sector, which meant that the demand-side inflationary pressures are decreasing but not at a fast pace nor at the pace that the market was expecting, i.e., the pace of the monetary policy tightening path is not slowing down the economy but rather slowly decreasing inflation without harming the manufacturing sector.
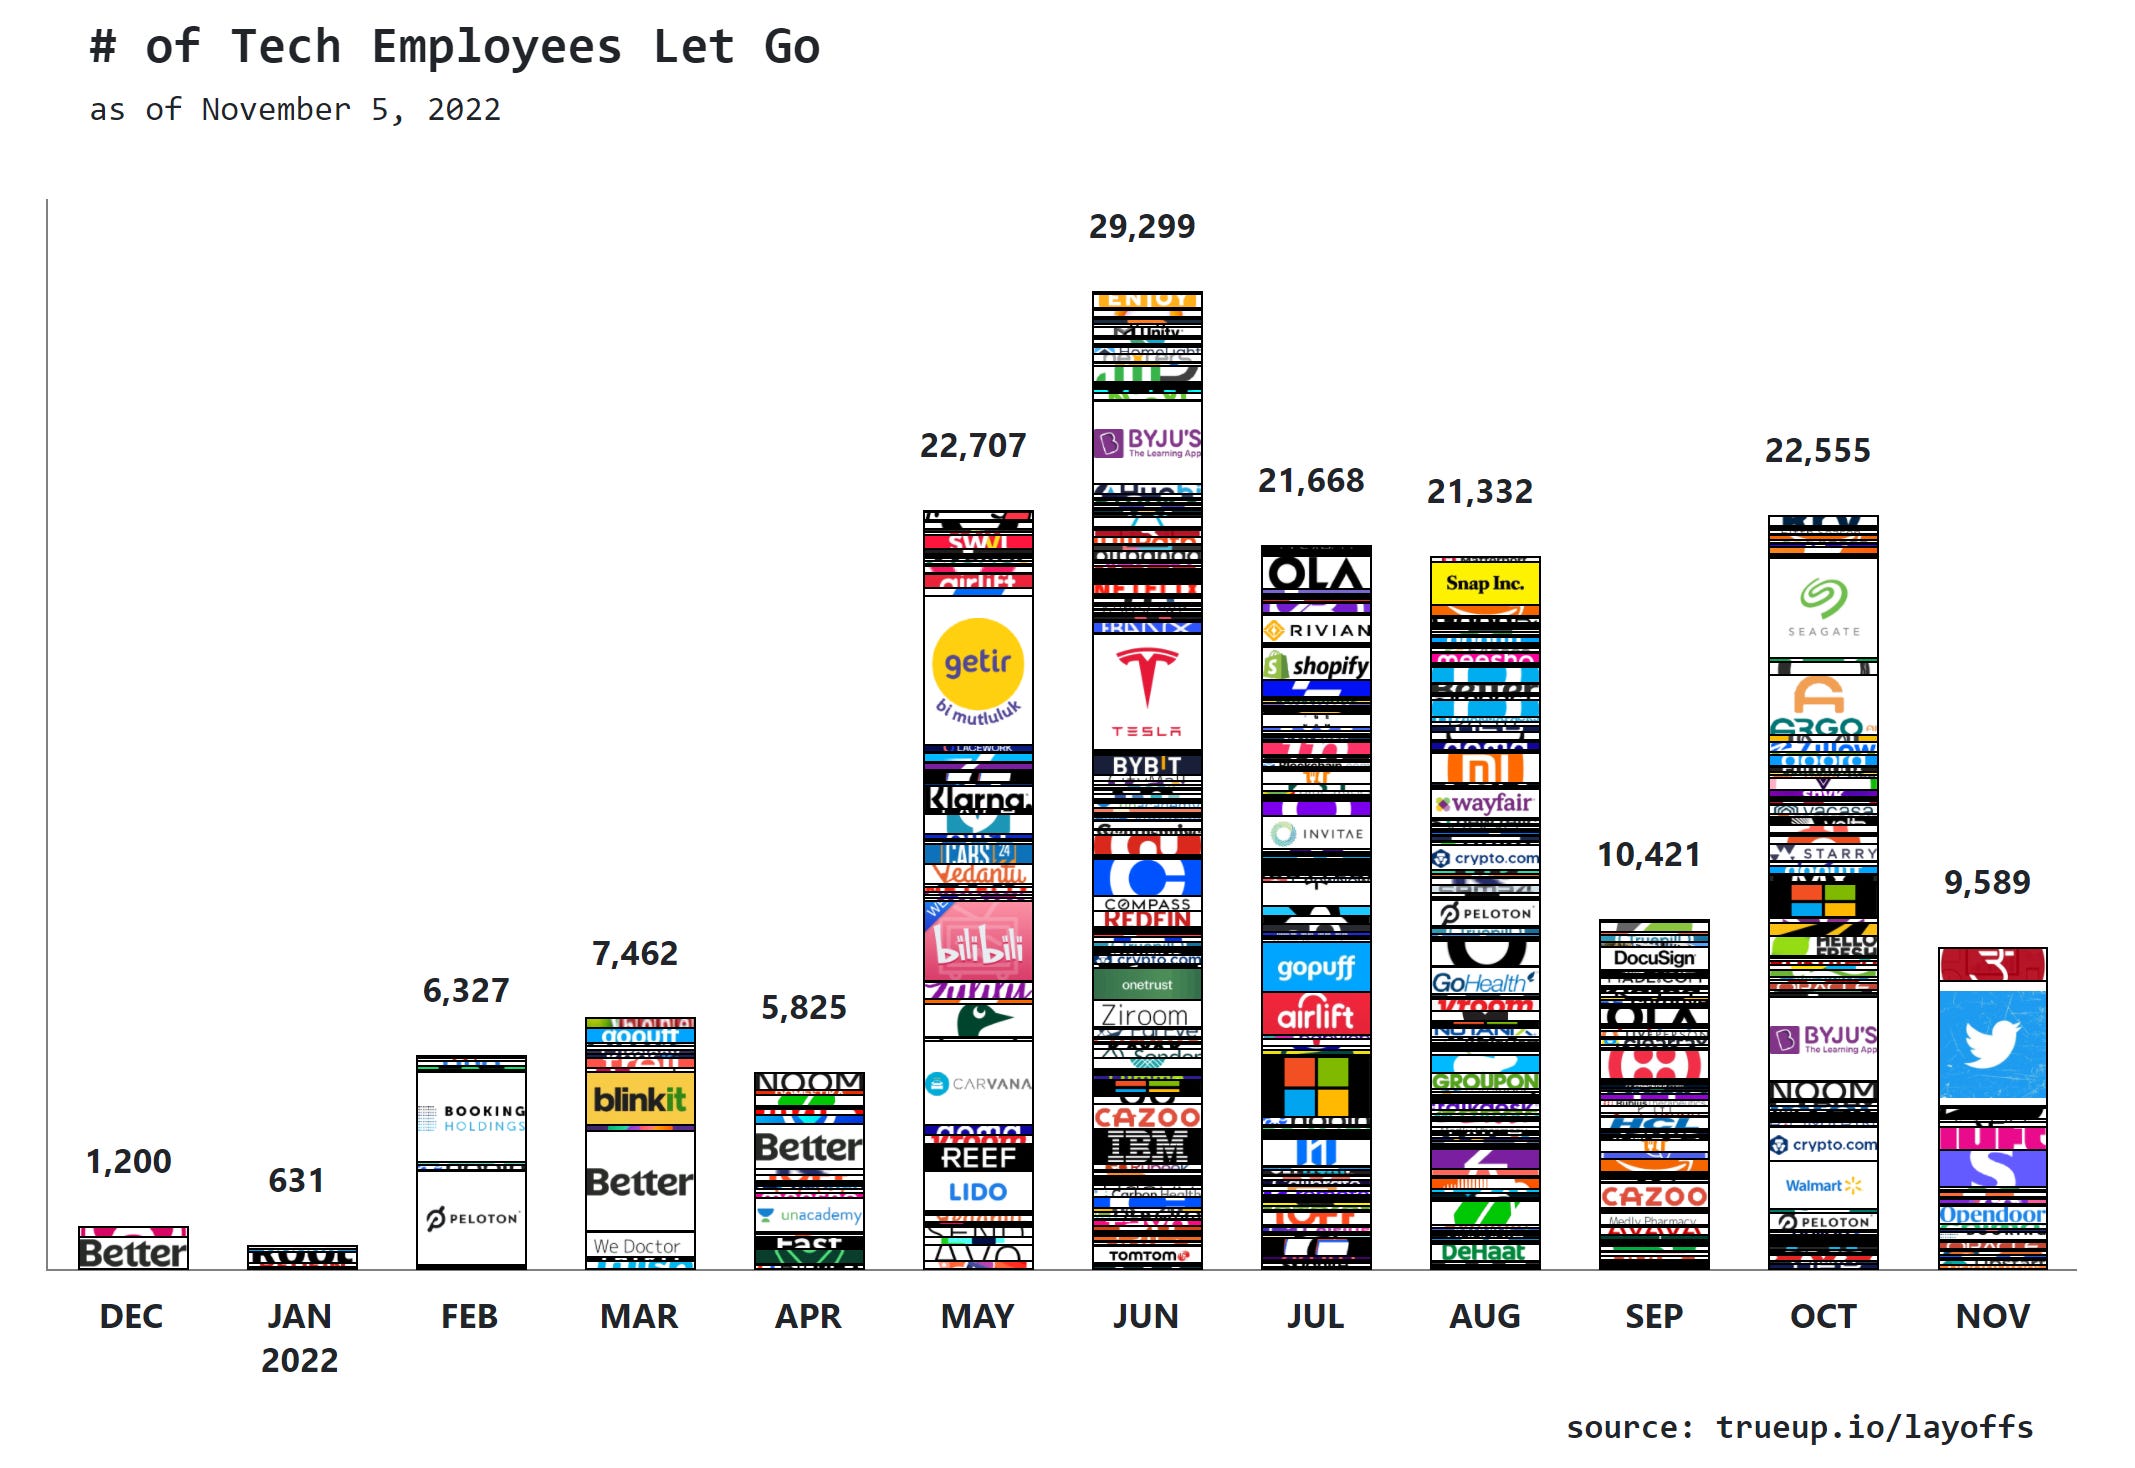
The higher than expected Job Openings and Labor Turnover Survey (JOLTS) Data enhanced the rhetoric toward a more nimble path towards approaching the job market, given the fact that hires slowed while job openings increased. Tech sector companies issuing statements in which they mentioned a stop in hiring with increases in layoffs on tech companies also put downward pressure on the dollar and the tech sector.
Figure 1. Tech sector layoffs statistics:


The higher than expected United States ADP Nonfarm Employment Change data proved to show that private sector employment in the United States is not slowing down but rather exceeding Americans’ expectations over the strength of the job market. This data also increased the rhetoric towards a more hawkish stance while remaining nimble given the Job Openings data. Also, the higher than expected Non Farm Payroll (NFP) data proved to show that overall, not only private sector employment, in the United States remains above Americans’ expectations. The United States unemployment rate has been above market expectations which has put downward pressure on the dollar.
The Federal Reserve’s interest rate decision toward an increase of 75 basis points was expected, and Jerome Powell’s press conference showed a nimble but hawkish monetary policy stance, as expected.
Jerome Powell's remarks were coherent given the constant changes in microeconomic and macroeconomic data that make the path of monetary policy change as it remains data-dependent. The monetary policy tightening path still remains on a soft landing, but that path has narrowed. The comment from Jerome Powell towards the willingnes to increase the policy rate towards positive territory proves to show that Jerome Powell is hawkish, while maintaining a nimble stance. Which is good for the United States economy because, as interest rates rise above the inflation rate, the value of the currency recovers above the rate of depreciation adhered to inflation.
The variation of the FX strength of the currency does also increase or decrease the value above or below the rate of depreciation of the currency adhered to inflation, making inflation less or more noticeable as the volume of trade of international goods from other countries increases or decreases in the country under high FX strength while the rest of the countries with weaker FX strength have an import/export supply and demand side inflationary pressure impact.
As BIS has showed the divergent pace between countries monetary policy tightening.


Setting the interest rates above the inflation rate means that the rate at which the currency depreciates given inflation, recovers its value given a lower speculative demand over it as access to speculative growth becomes more expensive and the currency becomes more valuable.
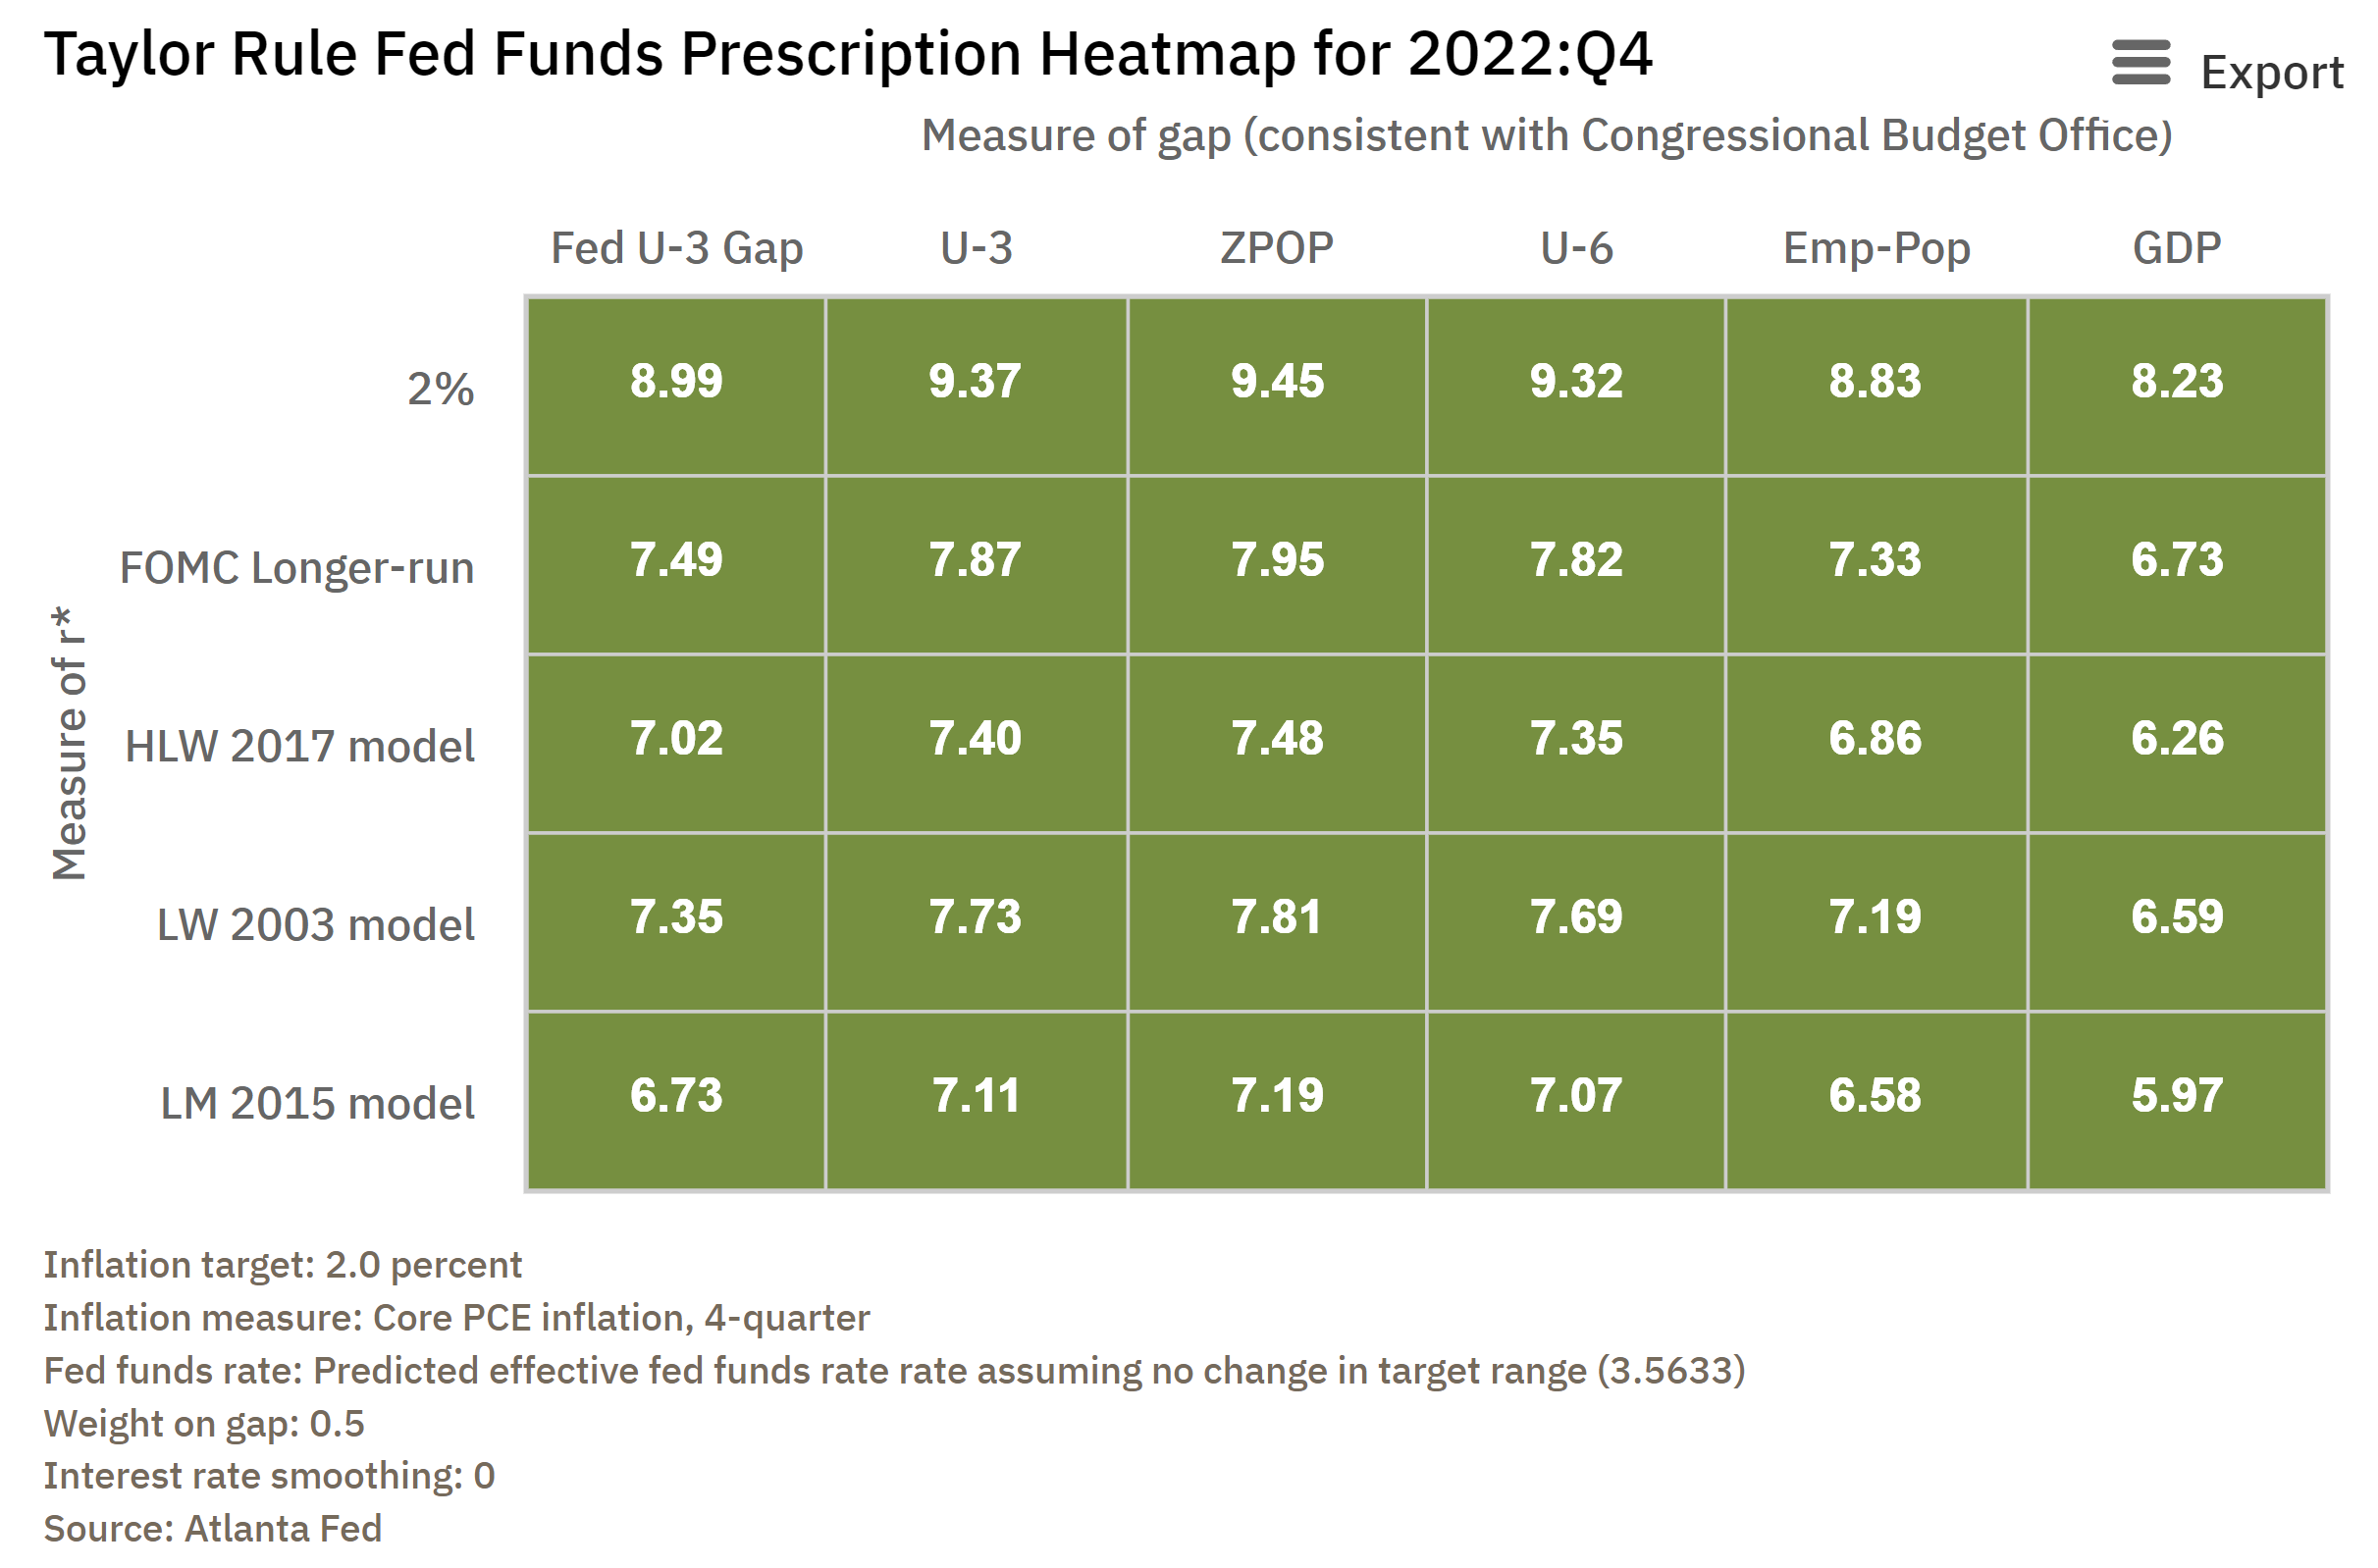
Figure 2. This is where interest rates should be, by using John Taylor’s Taylor rule.
Quantitative Tightening also enhances the value of the dollar because, as the M2 decreases, so does the quantity of M2 going after goods, which, given the current supply of goods given the domestic production of them, Quantitative Tightening should be done at a faster pace until supply from goods production increases.
(Do read Milton Friedman’s Quantity Theory of Money to comprehend it better.)
(…) “Inflation is caused by too much money chasing after too few goods.” (…)
- Milton Friedman
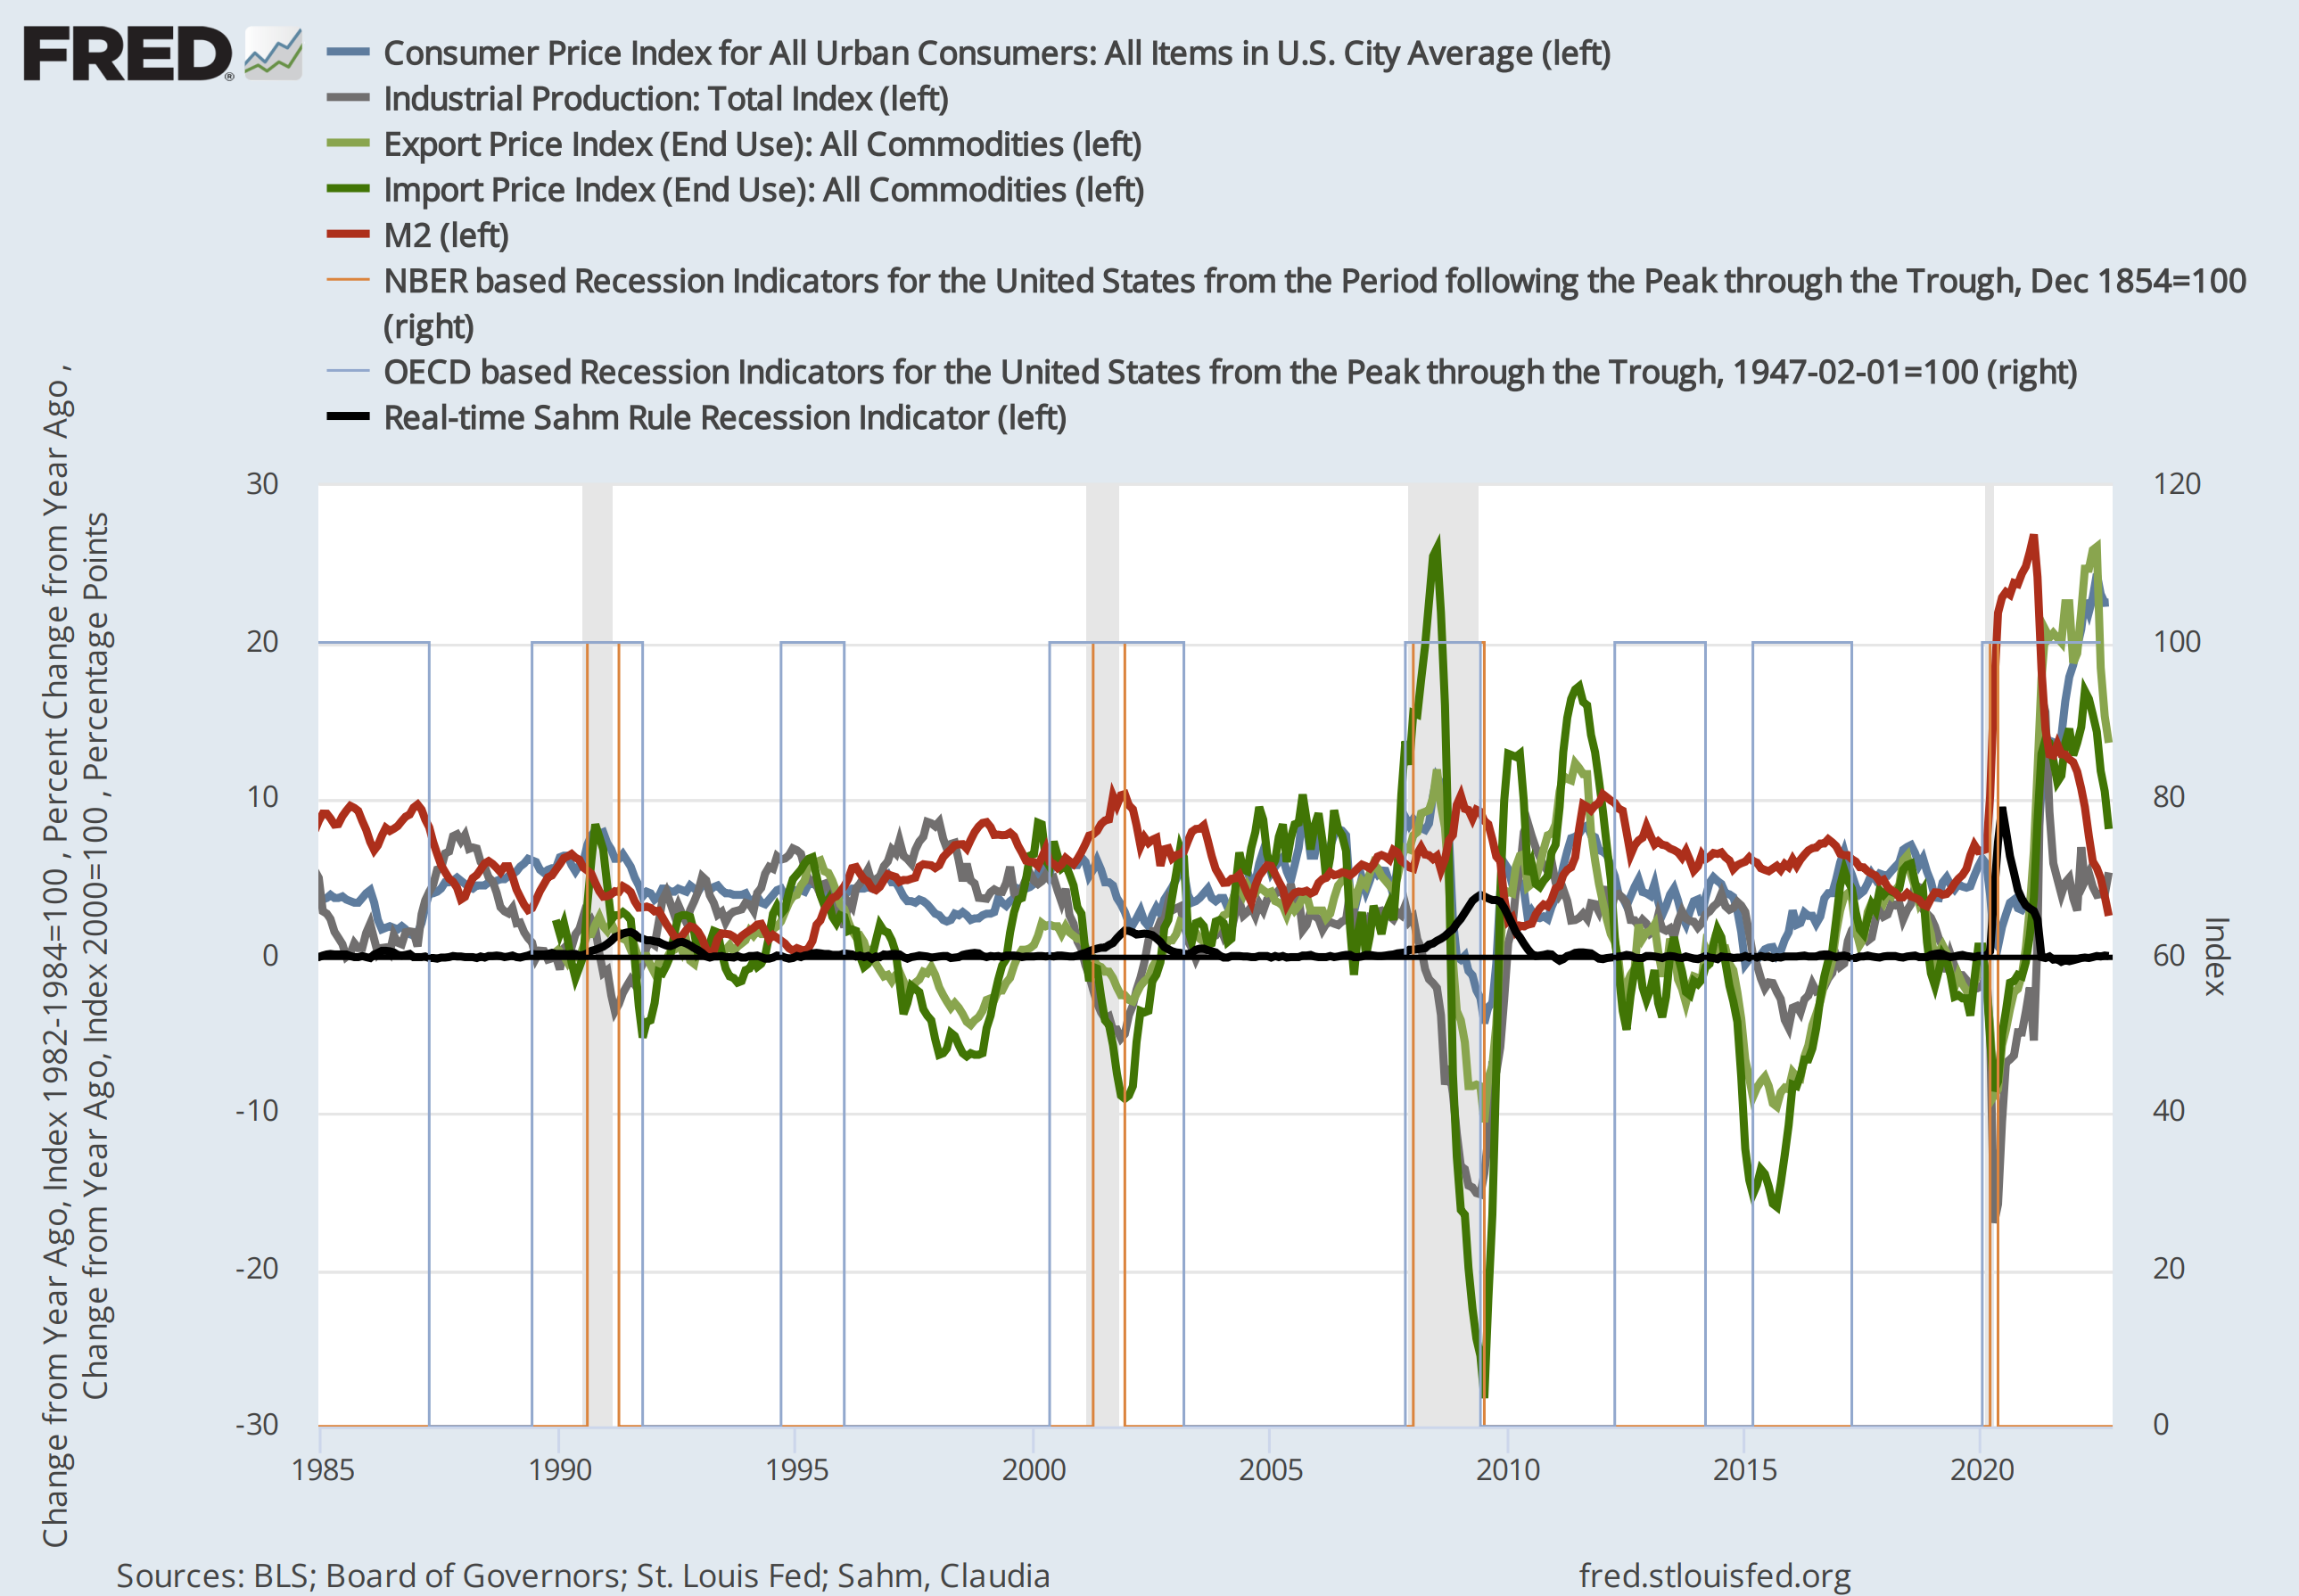
Export prices and import prices in the United States slowed as the M2 change slowed given the Quantitative Tightening which is part of the monetray policy normalization. The next chart shows the change in the consumer price index, which is directly correlated to the change in industrial production, which affects import and export prices as the variation in production increases or decreases prices given the supply and demand dynamics. The M2 change does affect goods prices given the fact that the more M2 is supplied, the higher the prices will be; the slowdown in M2 given the Quantitative Tightening affects the change in prices but in a lagged way, as can be seen on the next chart. The NBER, OECD, and Sahm Rule recession indicators are also in the chart.
Figure 3. This chart shows that the monetary policy tightening path is working.
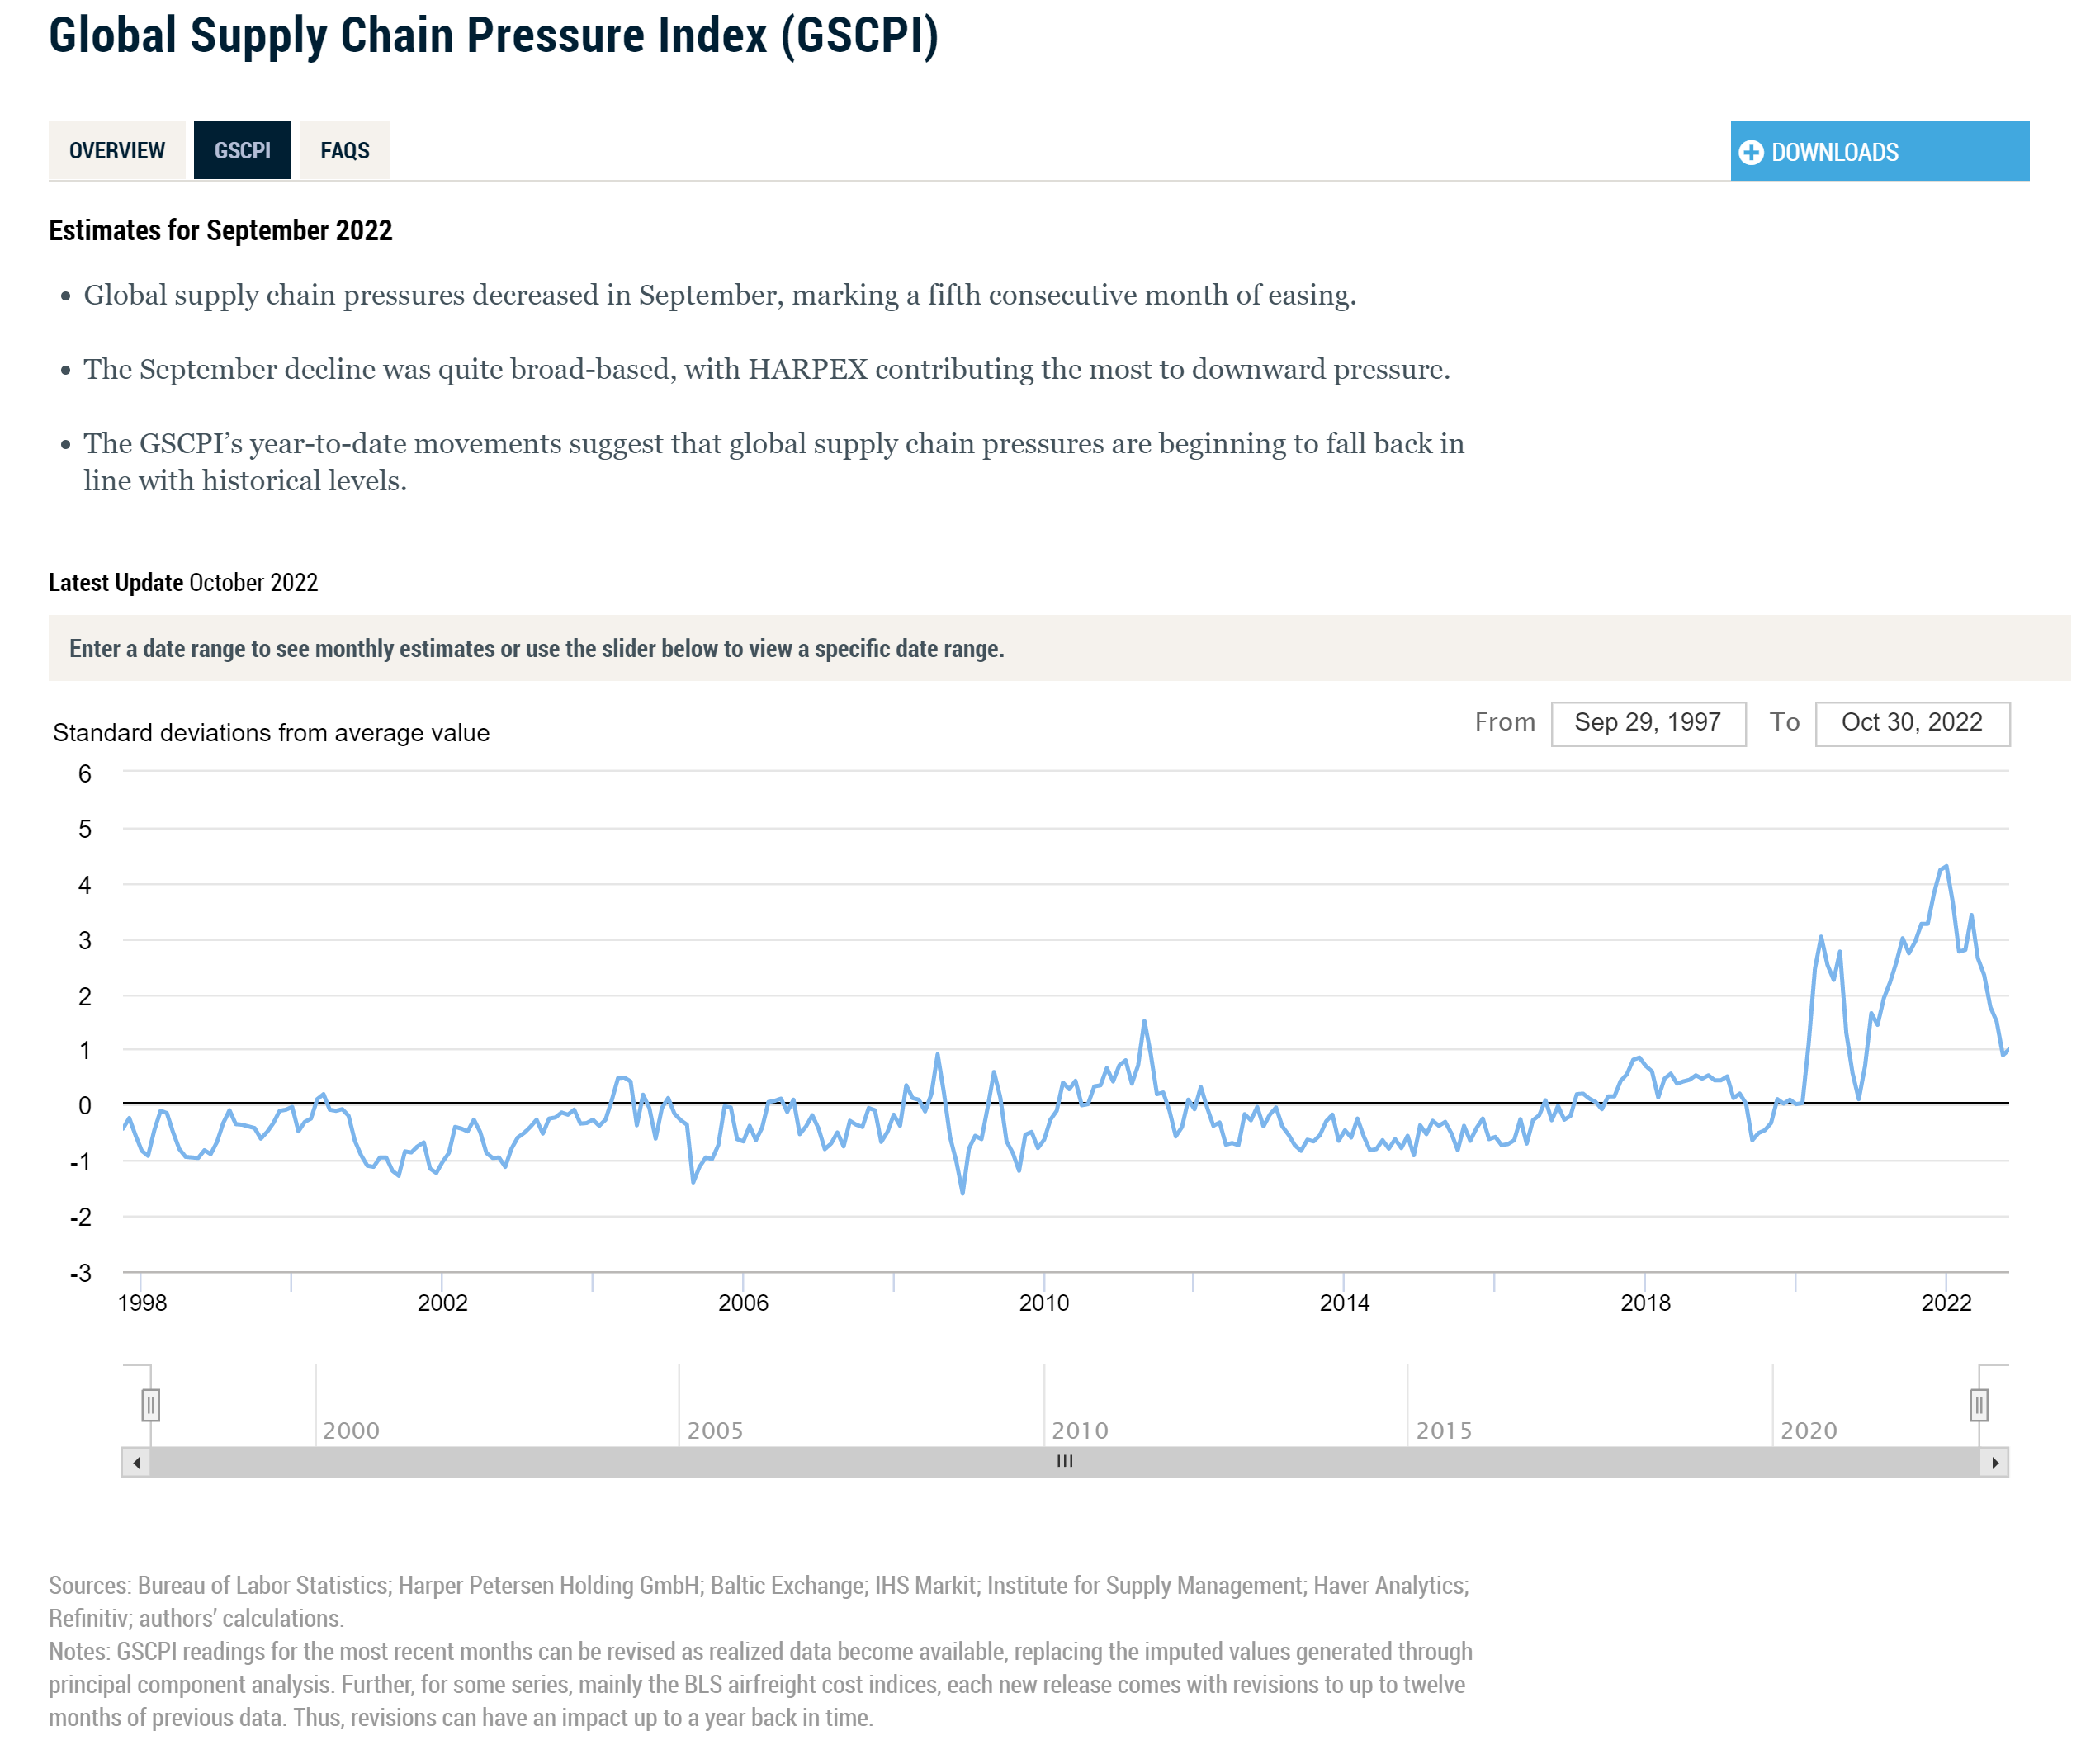
Further import and export prices decreases are expected as M2 has a lagged effect on them, also as the Global Supply Chain Pressure Index lowers given the improvements in the supply chains in countries all around the world due to the de-escalation of measures from the pandemic, the inflationary pressures from the supply chains have lowered as the supply from global trade supply chains has increased.
Figure 4. Federal Reserve Bank of New York Global Supply Chain Pressure Index
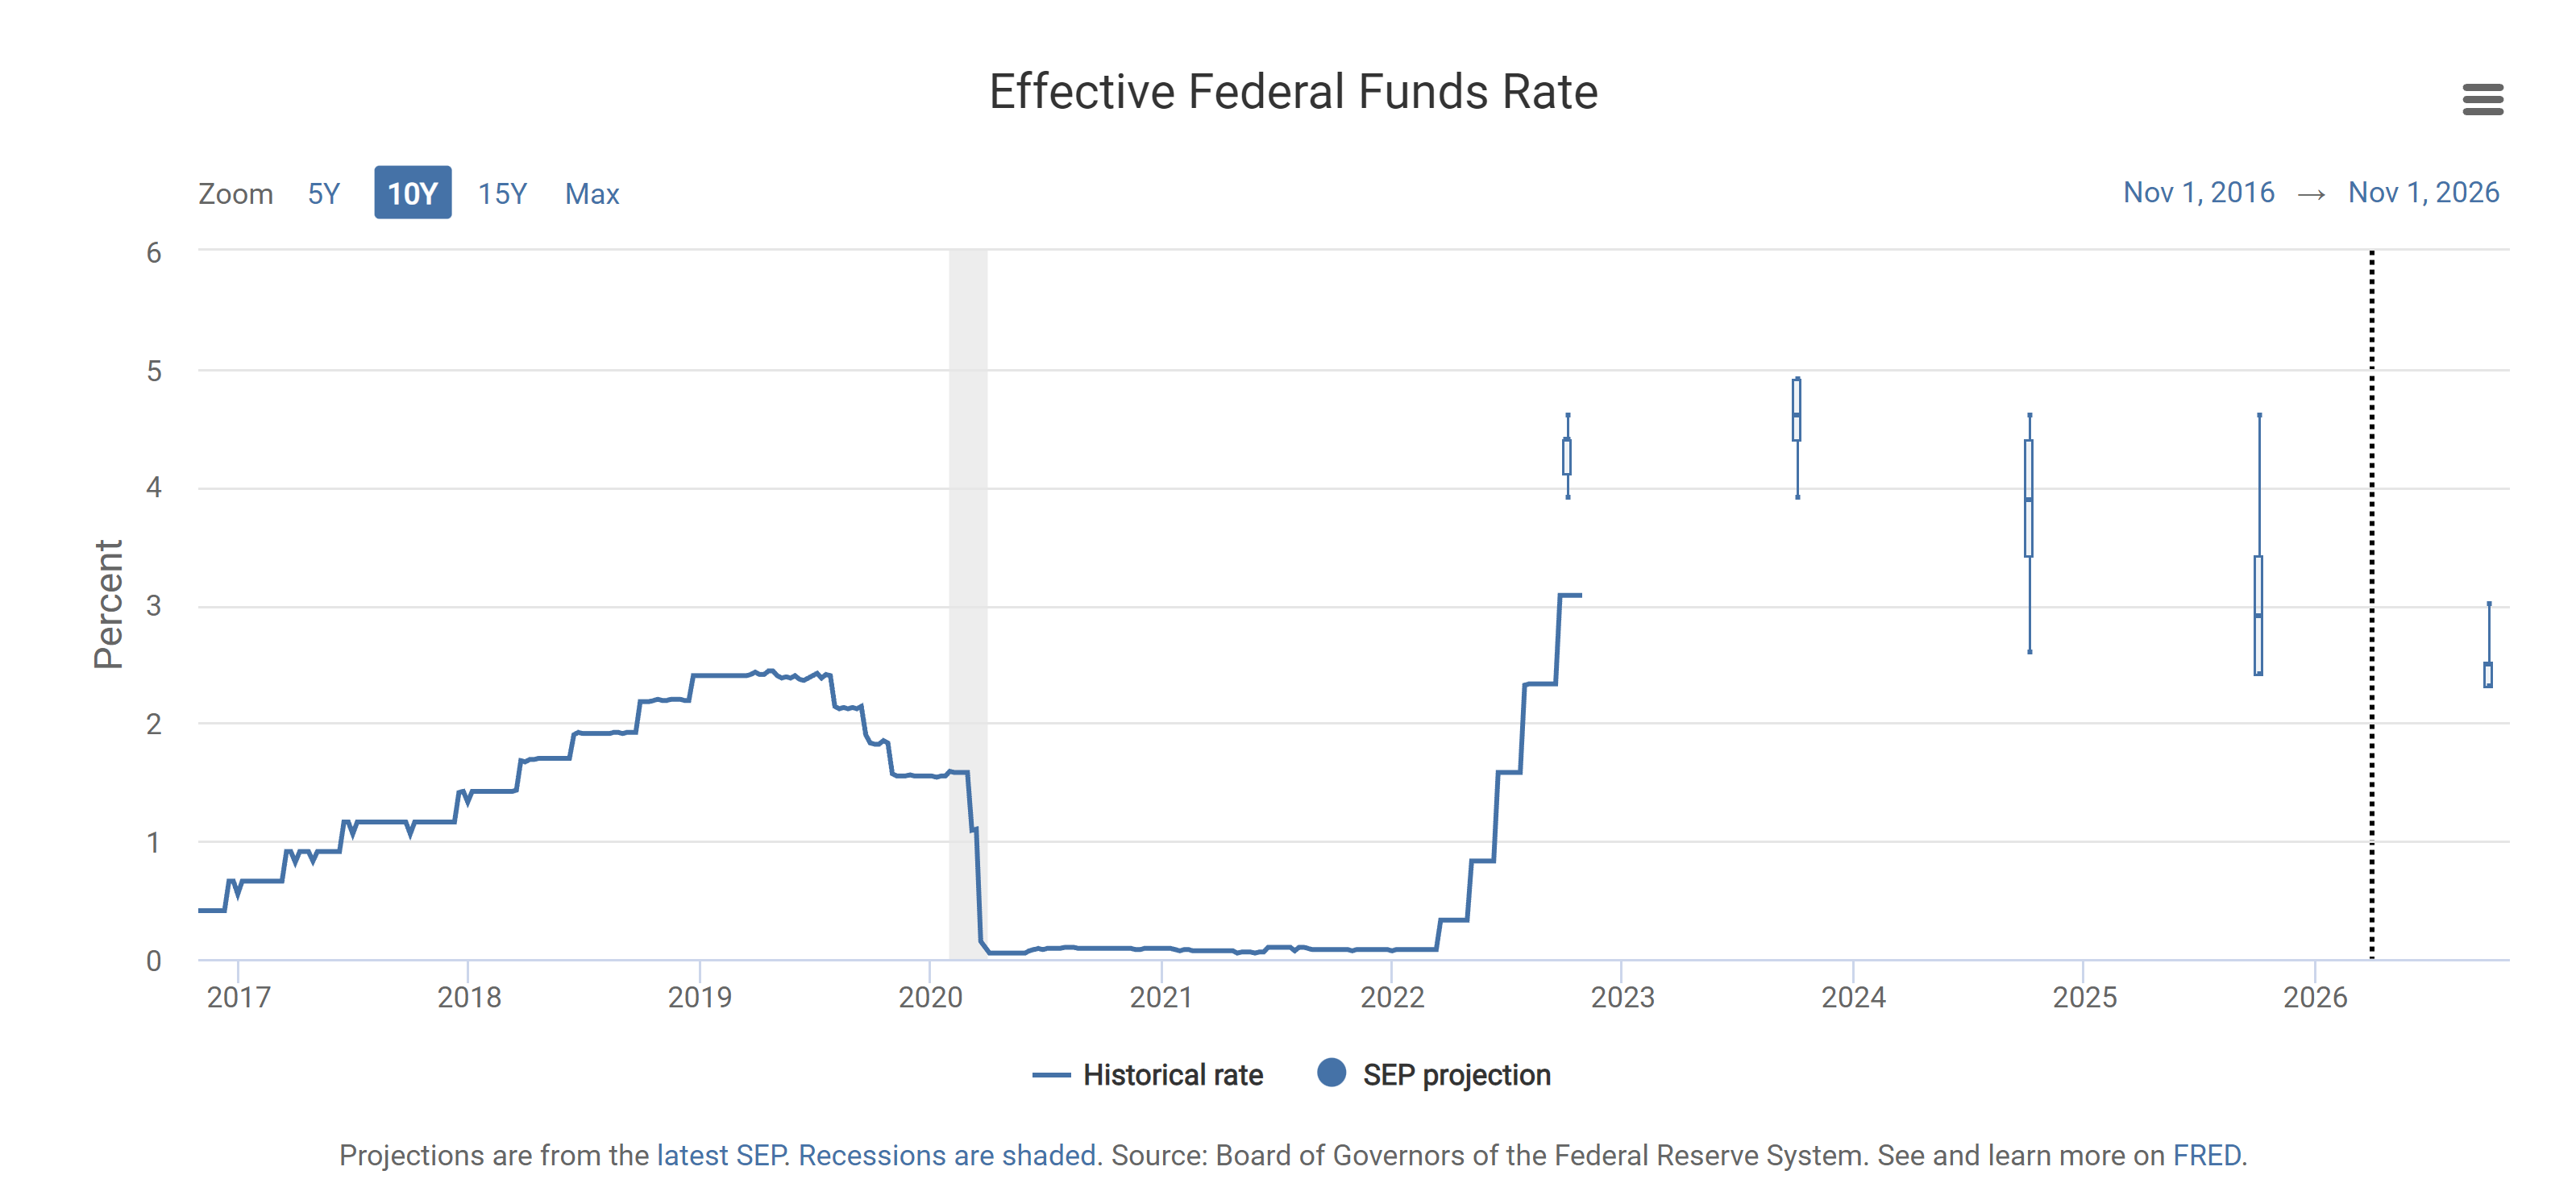
The year-end interest rate target is expected to be hawkish at 4.5%, but nimble in Q1 and Q2 of 2023 given the improvements in the macroeconomic and microeconomic data that show decreases in prices adhered to monetary policy actions that have a lagged effect, such as the effects of Quantitative Tightening on imports and export prices, which consequently lower inflation. The next two charts show what the market is pricing and what the FOMC officials have projected.
Figure 5. Effective Federal Funds Rate Projections by the Market
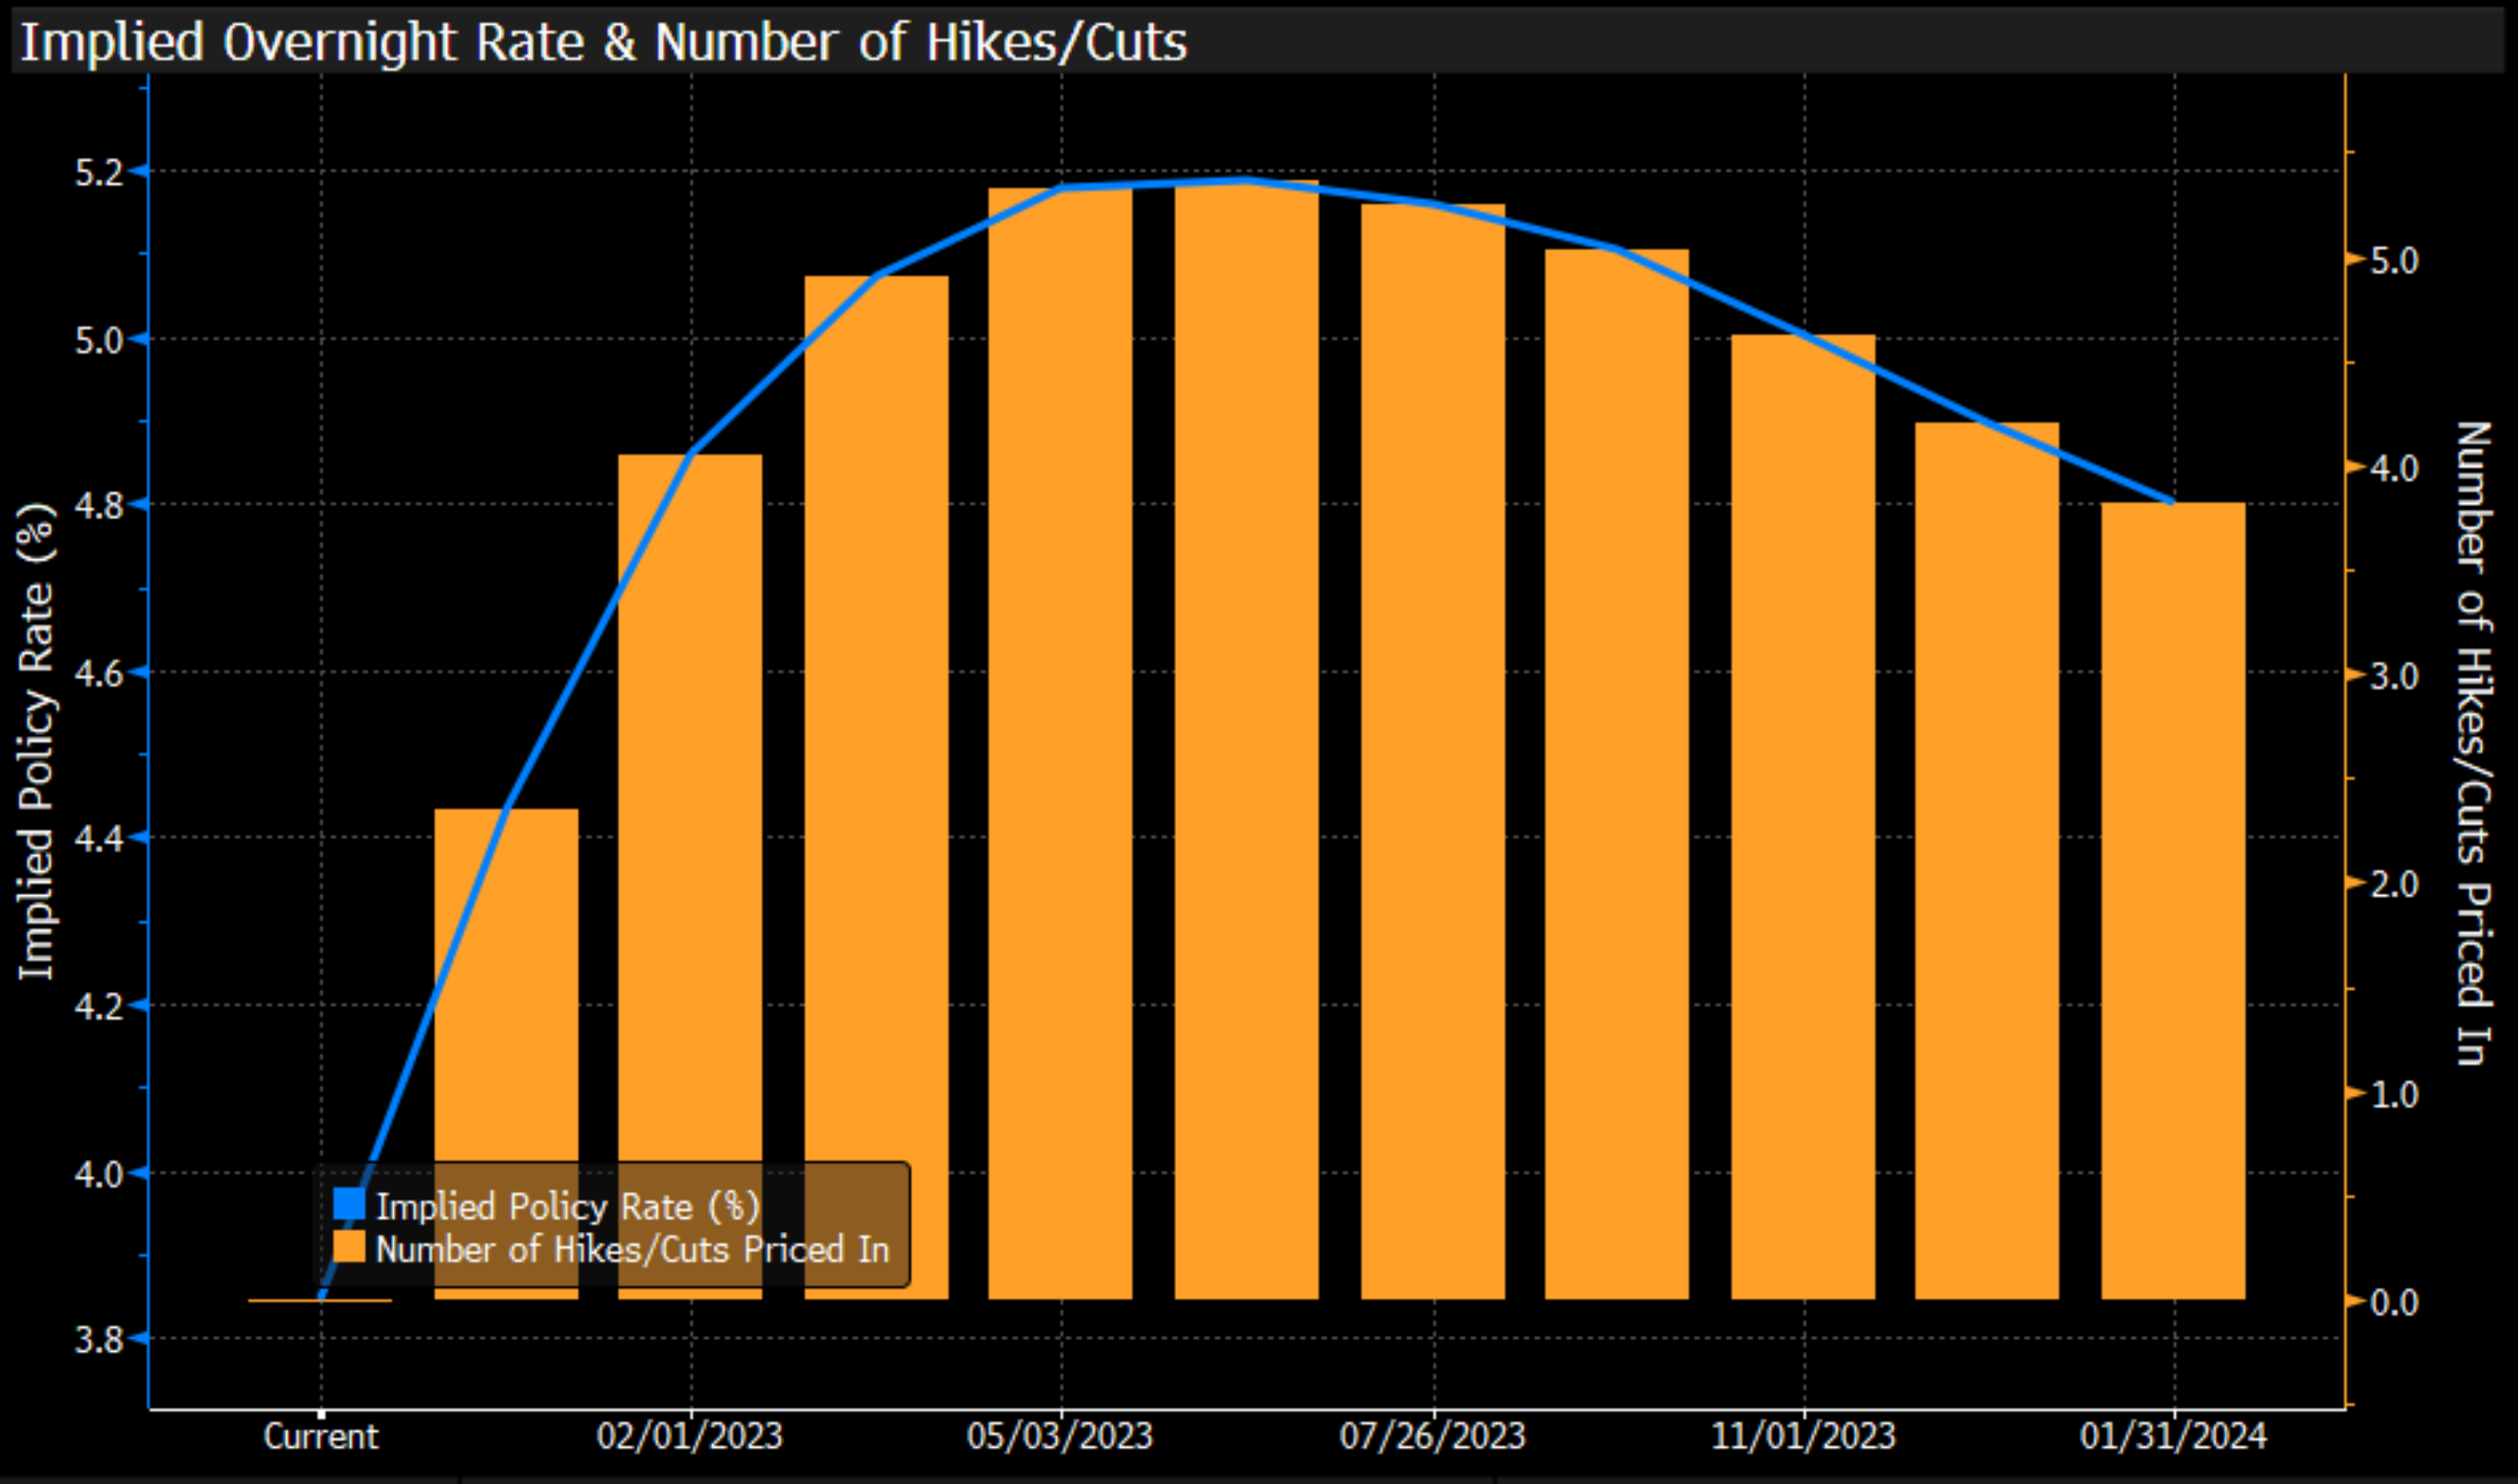
Figure 6. Effective Federal Funds Rate Projections by the FOMC
As mentioned before, the Federal Reserve can’t control domestic production of goods and doesn't have the tools to help in that aspect. Given that it only has the tools to control demand-side inflationary pressures through the interest rates, the Federal Reserve doesn’t have the tools to lower supply-side inflationary pressures. The president of the United States does have the tools to increase domestic production of goods, which can lower supply-side inflationary pressures.

Today’s economy is similar to that of the early 1980s, given the current disinflation environment, which is similar to then, with a United States president similar to that of the mid-1970s, given the energy and gasoline situation in the United States.
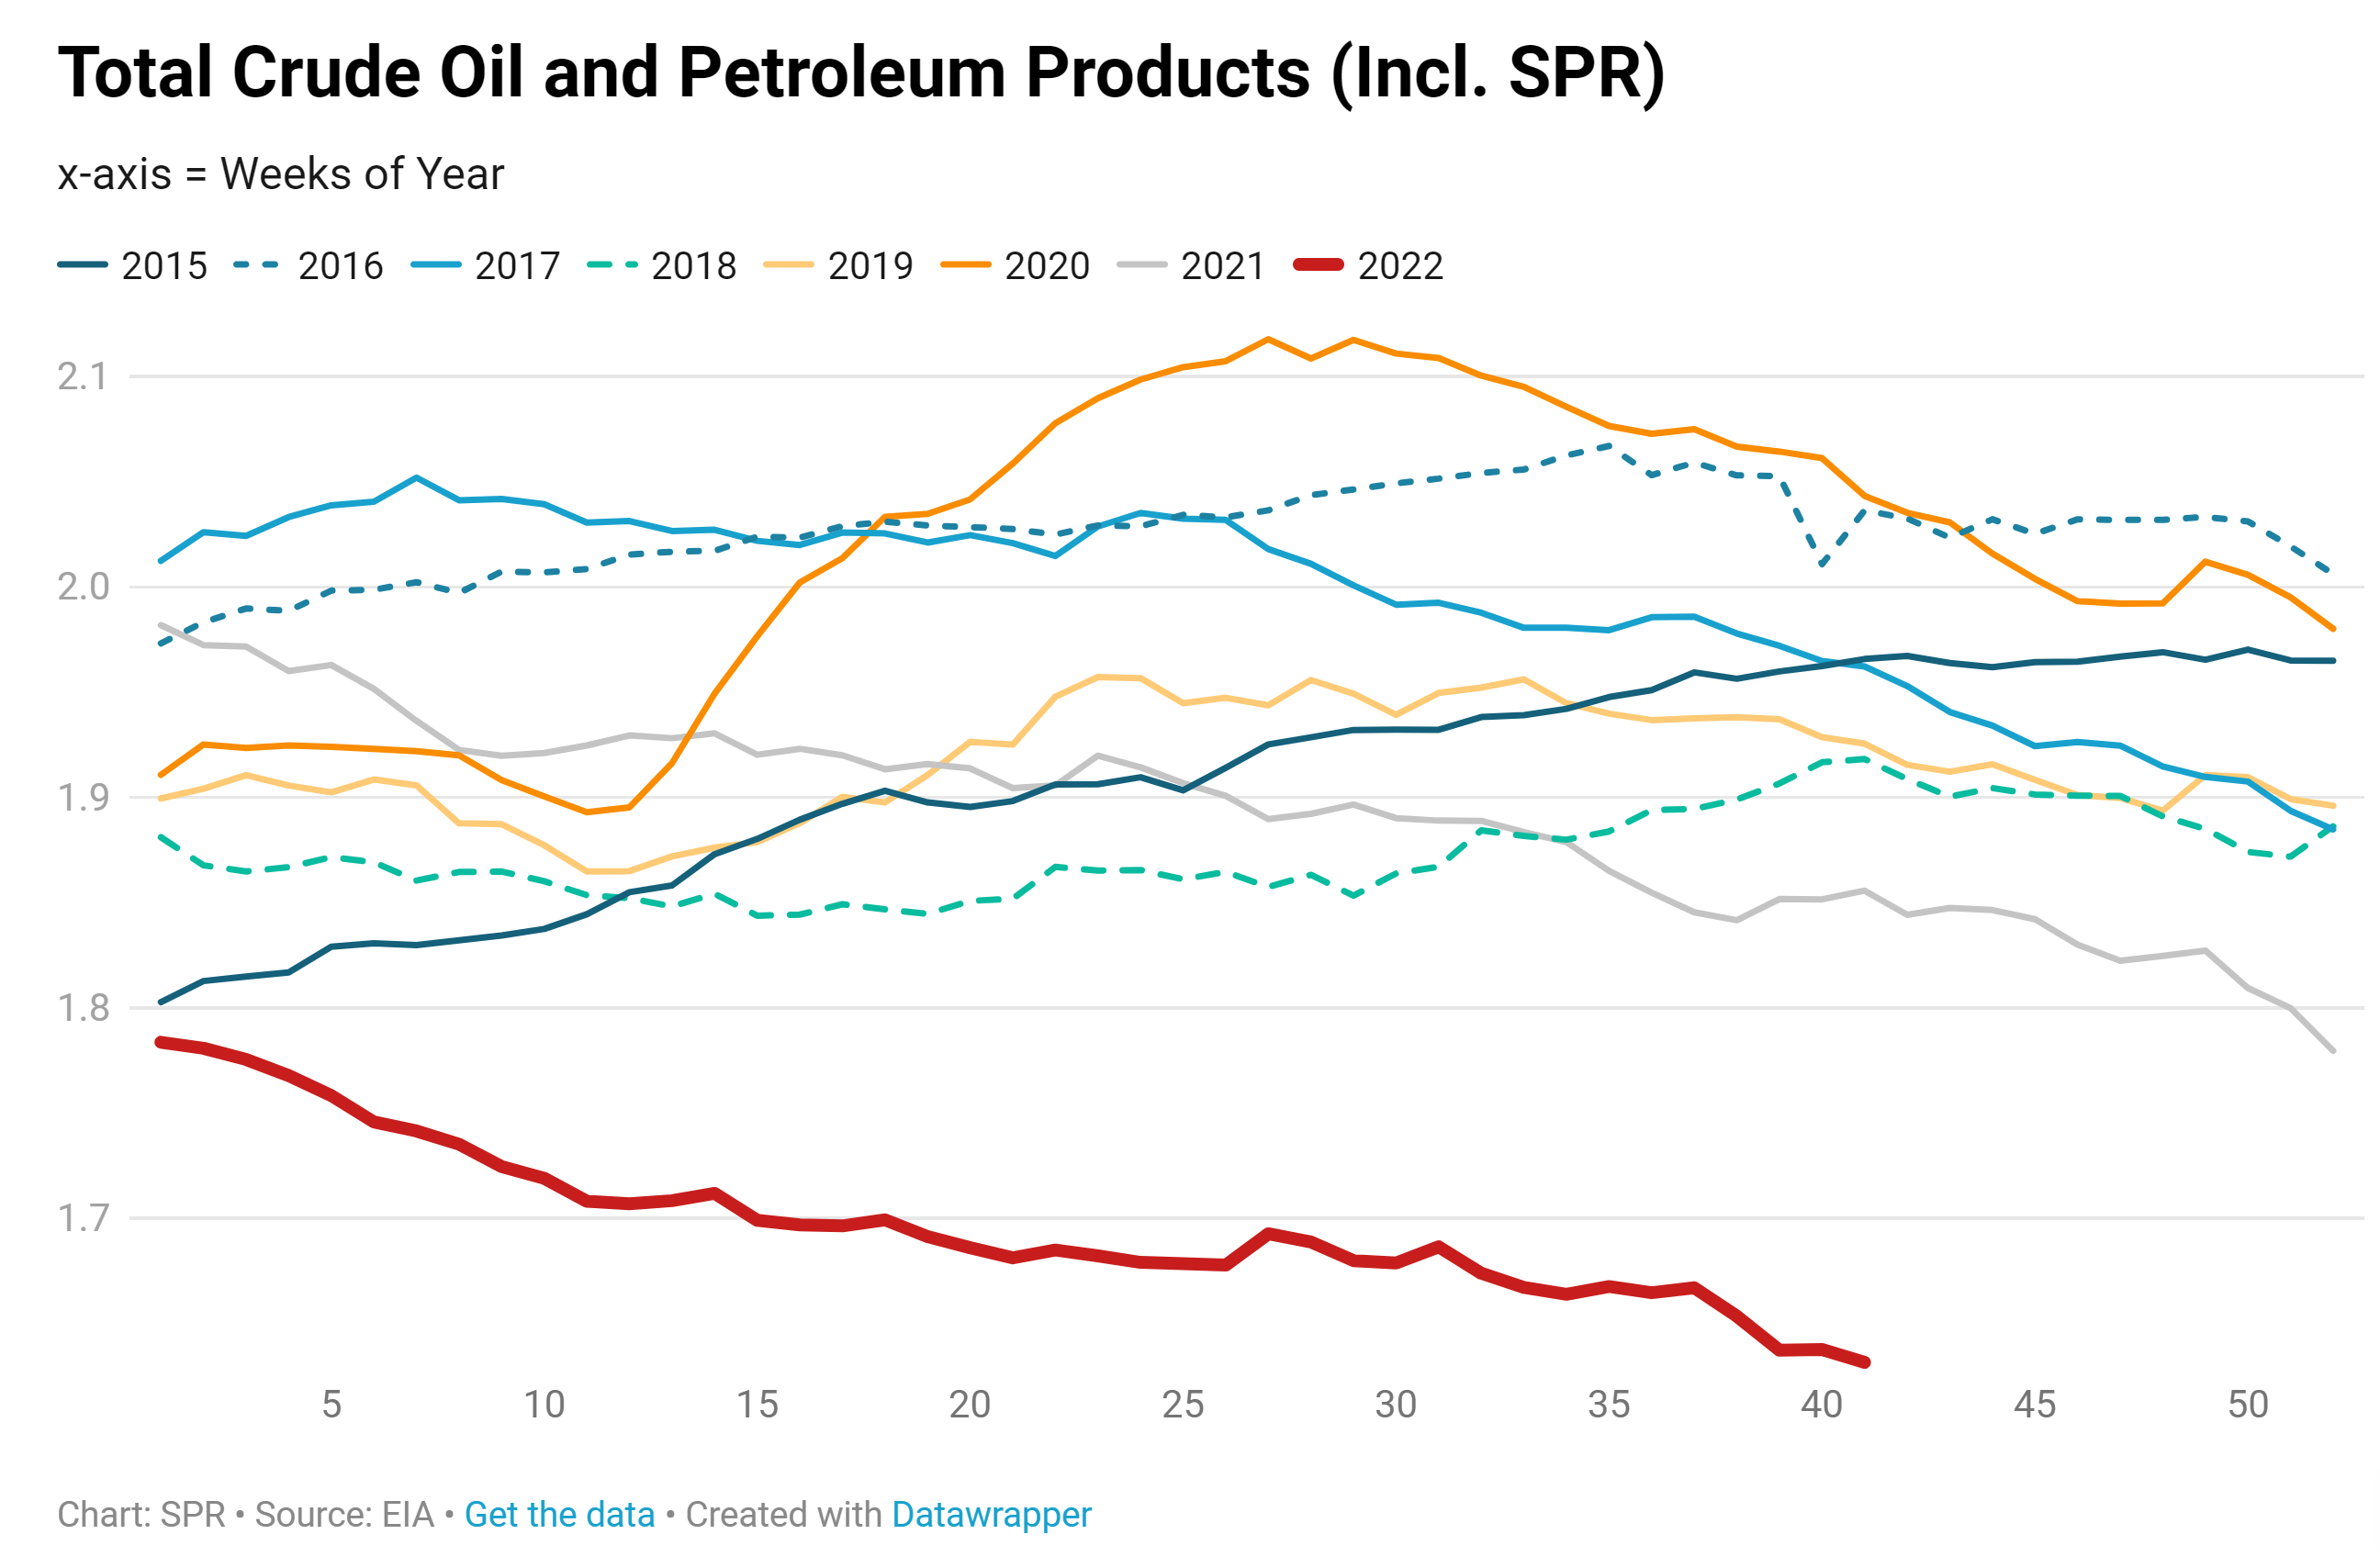
The current energy situation and gasoline situation in the United States are a result of the Biden Administration’s energy policies and domestic production of energy sector commodities policies that have caused a disinflationary environment due to the Department of Energy Strategic Petroleum Reserve releases. The United States was energy independent under the previous administration, which the Biden Administration has put in danger.
Figure 7. The total crude oil and petroleum products in the United States, including the United States Department of Energy Strategic Petroleum Reserve, are below where they were seven years ago.
The Biden Administration instead of refilling the SPR or increasing domestic production of liquid fuels that are essential for the backbone of the United States, which are the people that go to work every day with their cars, because not every American does have electric cars, nor are supply chains fully electric, and the United States' electric grid is not fully renewable, which makes the use of electric cars function with non-renewable energy, as can be seen in the next 2 charts.
Figure 8. United States Primary Energy Consumption by Energy Source, Percentages.
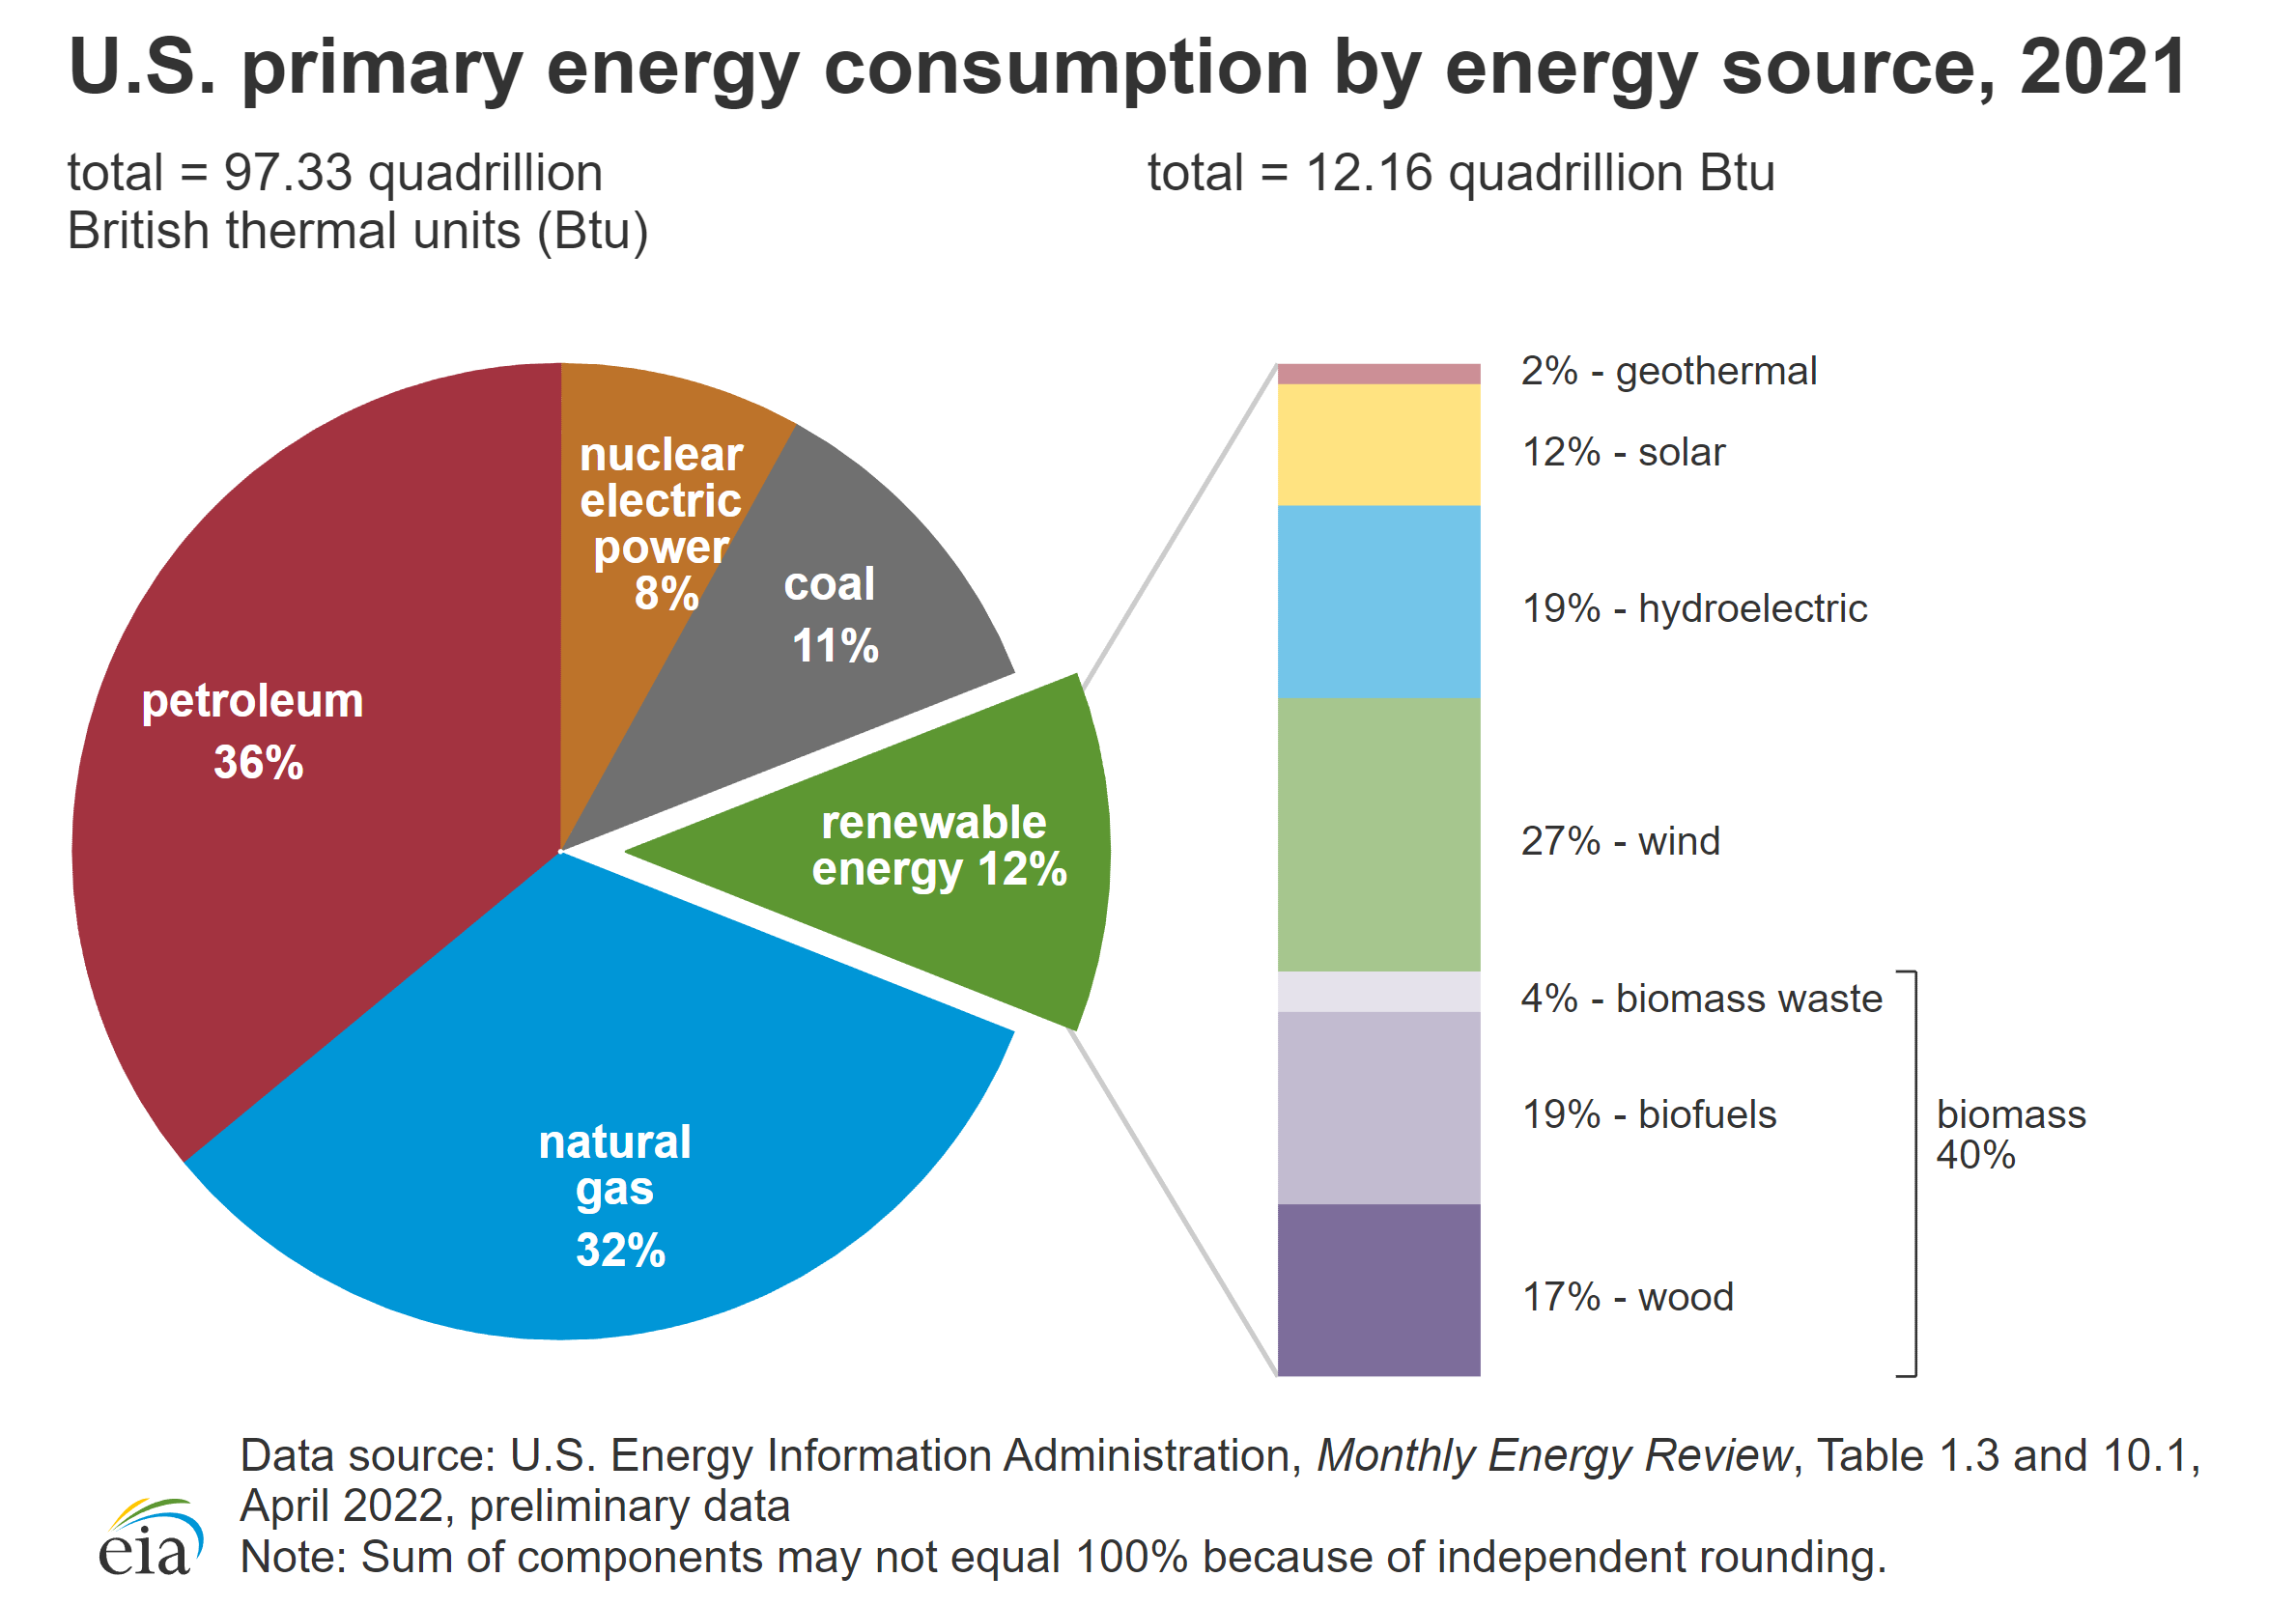
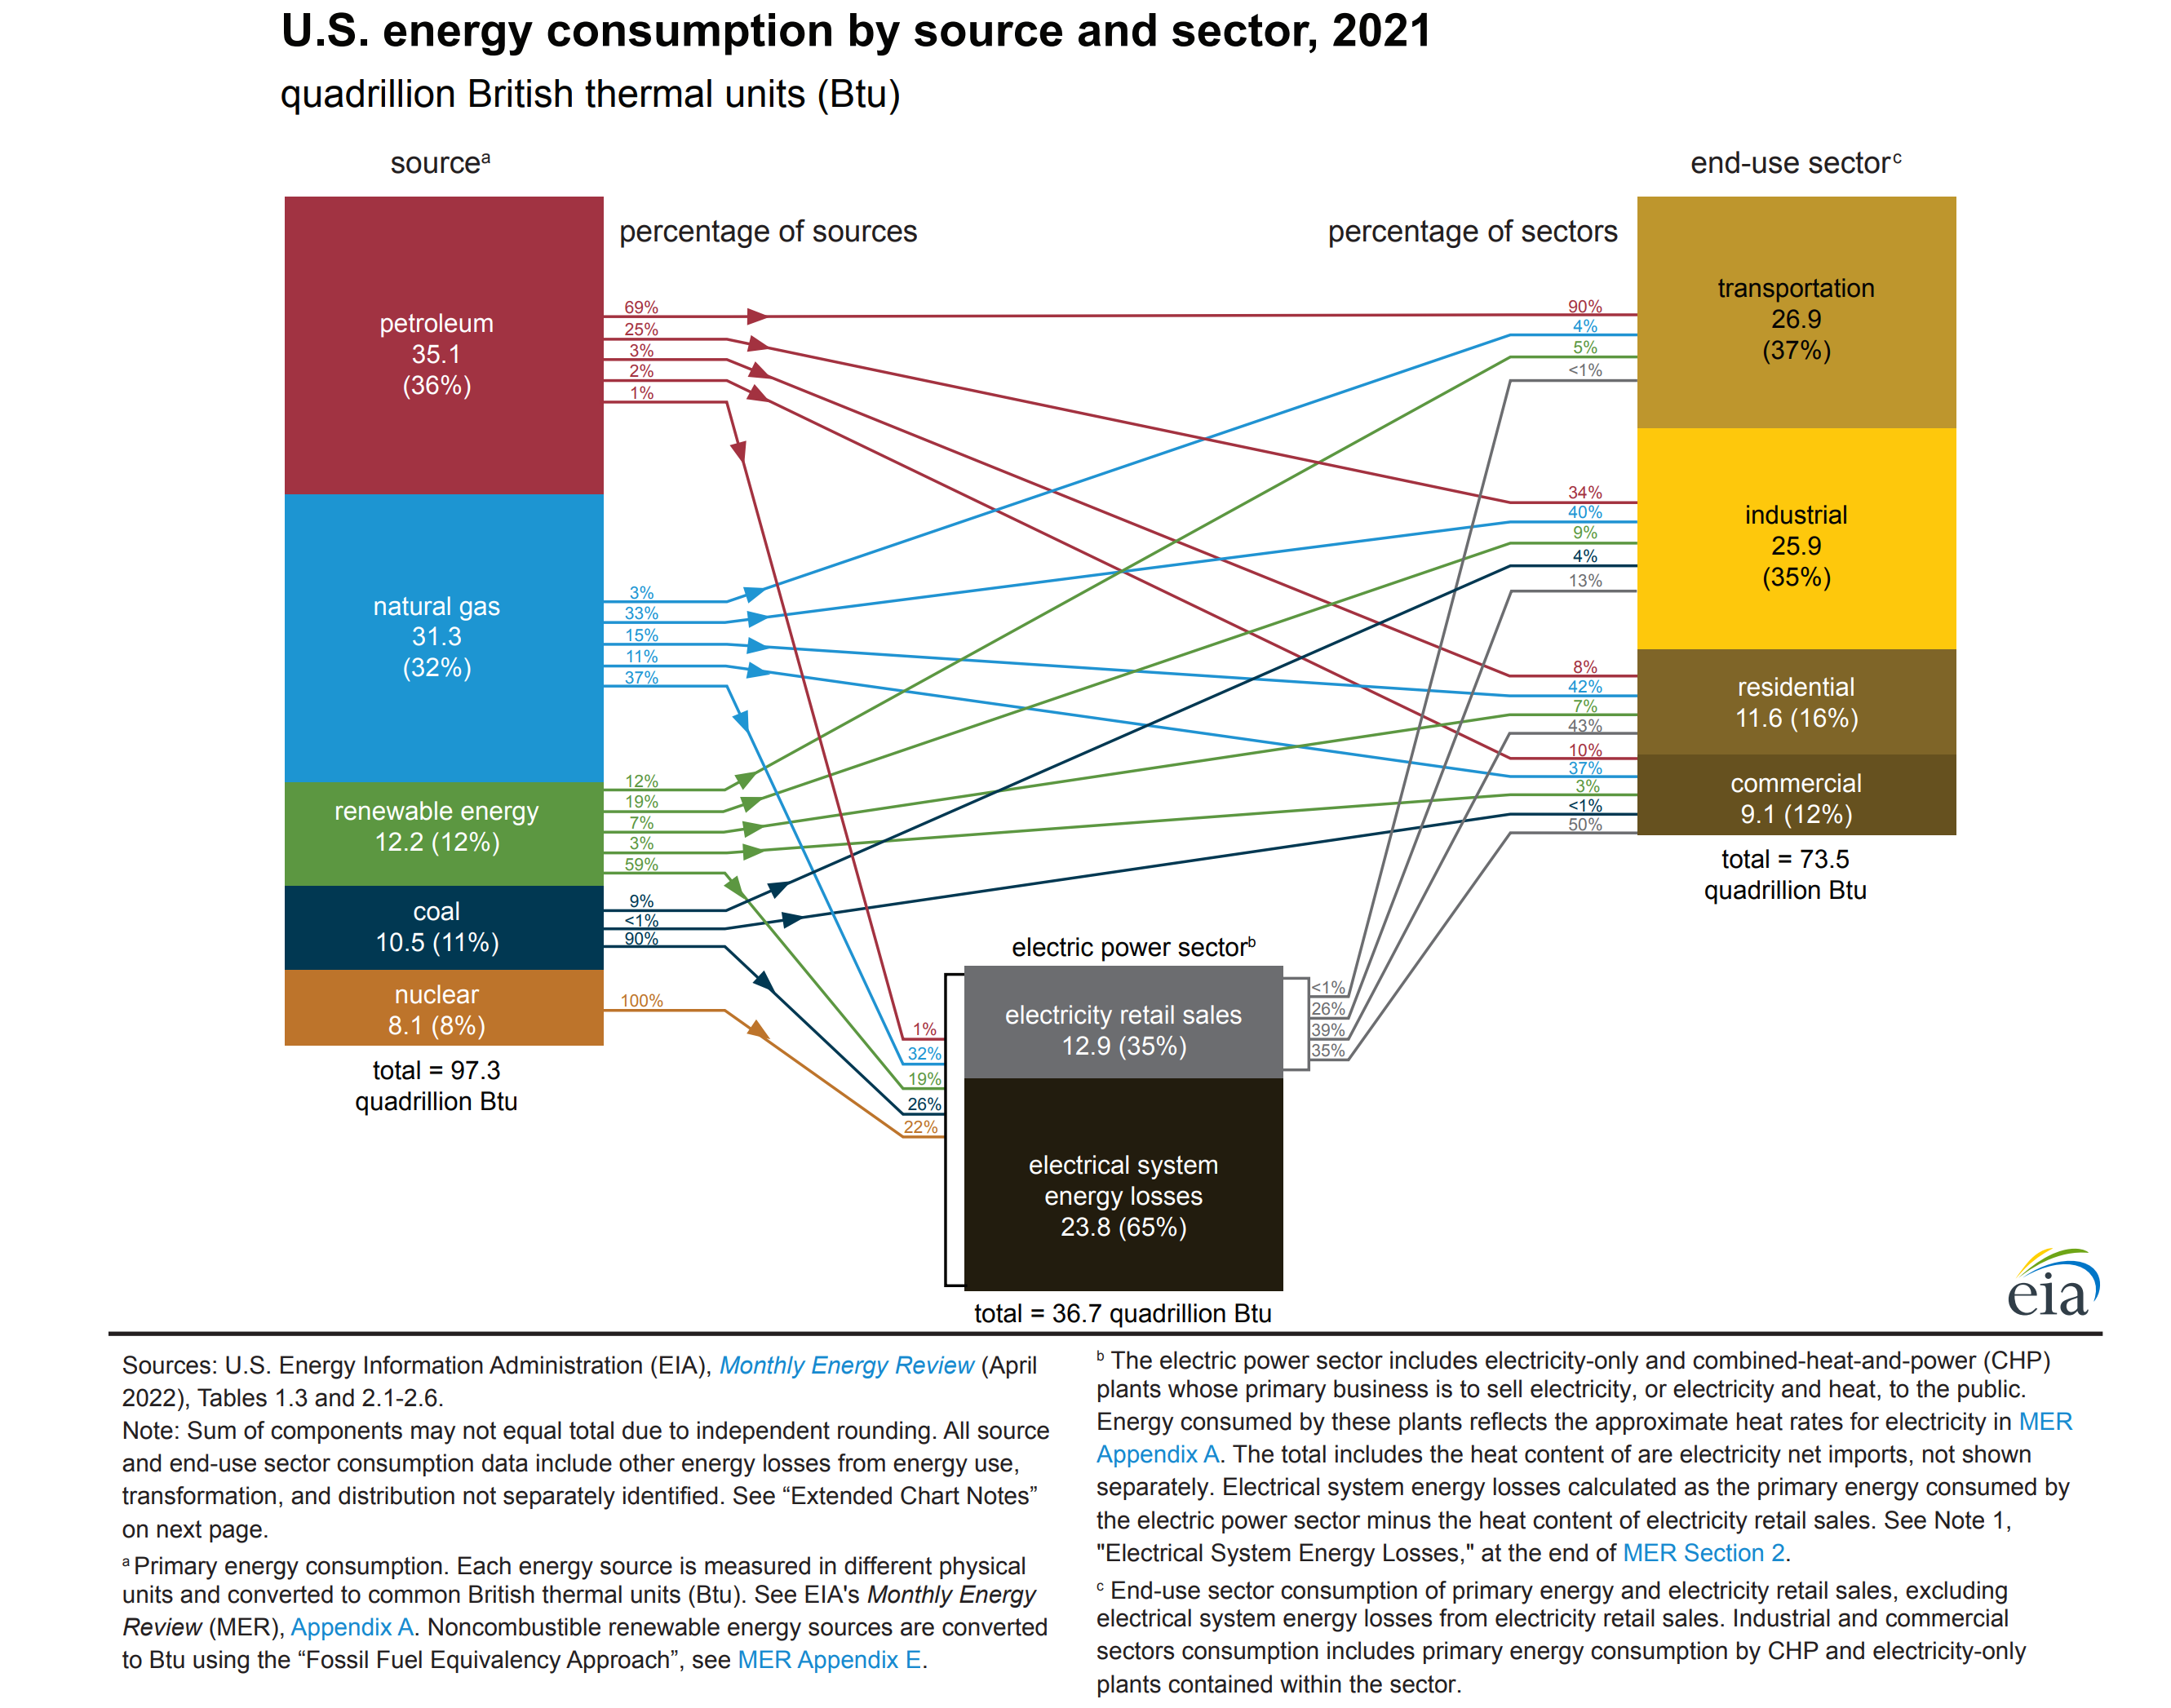
Figure 9. United States Energy Consumption by Source and Sector, Flow Diagram
The political situation in the United States is similar to that of the early 1980s, given the change in people’s thinking towards conservatism, as in the 1980s, which was the decade of political conservatism.
The geo-political situation is similar to that of the late 1970s; the North Atlantic Treaty Organization (NATO) proxy war in Europe is nothing different from Vietnam. Also, the geo-political risks are similar to those of the late 1930s, given the risks of World War given the Biden Administration’s measures over international relations with China, as explained before.
World War III is inevitable, given the fact that Joe Biden said that "United States men and women would defend Taiwan in the event of a Chinese invasion".

Jimmy Carter admitted that Taiwan is part of China on December 15, 1978, and Richard Nixon admitted that Taiwan is part of China on February 27, 1972, which the Biden Administration has buried up. Joe Biden’s approval rating is below Jimmy Carter’s and Richard Nixon’s approval rate at this point in his presidency. As shown in the next two charts.
Figure 10. Joe Biden's Approval Rate compared to Jimmy Carter Approval rate
Figure 11. Joe Biden's Approval Rate compared to Richard Nixon Approval rate
To put it this way, Joe Biden is a mix of Carter and Nixon, given government domestic fiscal and legislative policies and international measures that have resulted in the same kind of scenarios that were under the Carter and Nixon Administrations. The statistics show that the American people are willing to choose a Reagan (Trump or DeSantis), rather than a Nixon or Carter (Biden). As the statistics show in the next two charts.
Figure 12. Once again, the statistics prove to show how the people does and feels about the government.

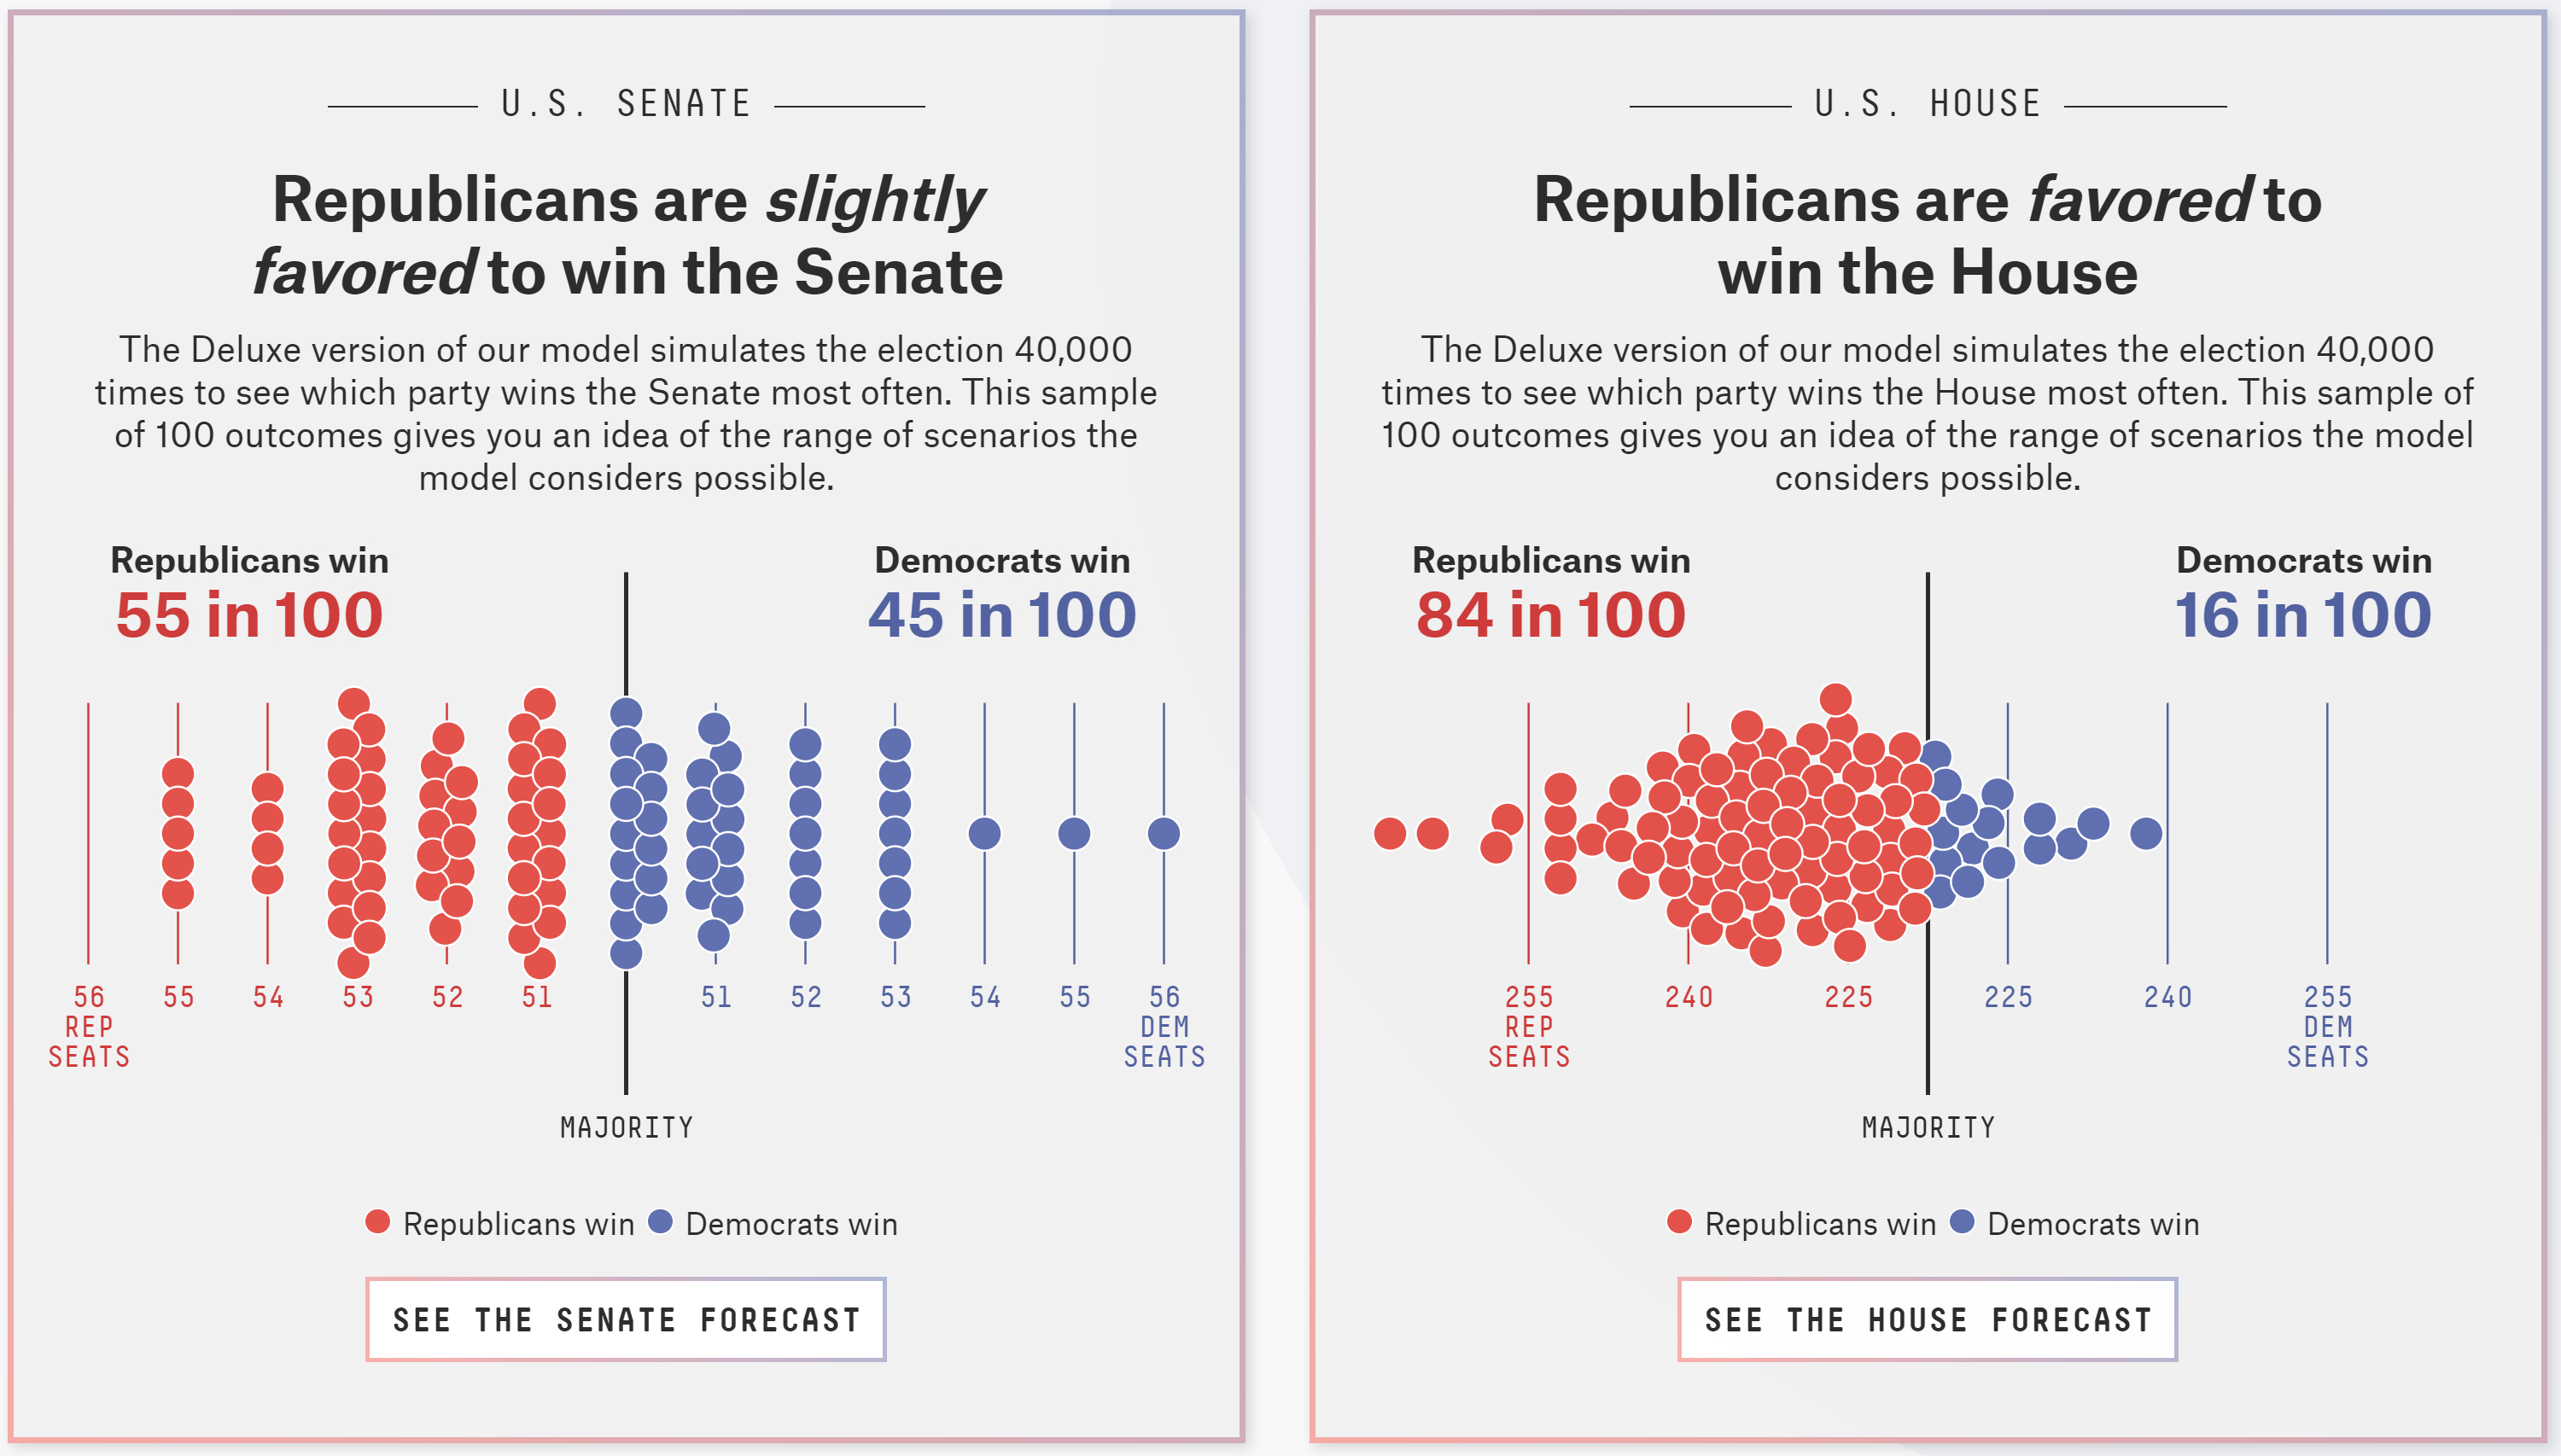
Figure 13. Republicans are slightly favored to win the Senate, and Republicans are favored to win the House of Representatives.
To better understand what is expected of the outcome of the political analysis, read this post.
Europe:
The European unemployment data came as expected, and the market reacted in a positive way, given the fact that it showed no harm from the European Central Bank monetary policy tightening path. The Eurozone Gross Domestic Product data came higher than expected, which made the market rally as it showed a better than expected economic recovery in the Eurozone, even though the inflation rate data came higher than market expectations, which made European yields rise in a frontloading of rate hikes rally. The forward expectations over Ms. Lagarde measures over monetary policy are the same as the previous week.
United Kingdom:
The Bank of England’s interest rate decision toward an increase of 75 basis points was expected, and Bank of England’s MPC remarks during the press conference showed a nimble but hawkish monetary policy stance, as expected.
The Bank of England governors proved that the Bank of England is committed to bringing inflation down while maintaining a hawkish but nimble stance, which proves that the Bank of England governors are aware of the plausible changes in economic indicators, which is good and enhances the forward outlook. The new PM of the United Kingdom, Rishi Sunak, also enhanced the outlook, given the forward changes in fiscal and legislative policies that will lower supply-side inflationary pressures, as mentioned before.
Asia:
China:
The Caixin Manufacturing PMI data has come below expectations but above market expectations, which made the Chinese market rally. The Hong Kong interest rate decision mirrored the rest of the world's central banks' decisions, which showed that the Hong Kong monetary authority cares about the inflation rate in Hong Kong, which affects the Chinese people in Hong Kong. The Hong Kong interest rate decision caused a risk-off rally on the Chinese markets as it signaled a plausible change in the People's Bank of China's monetary policy stance, also as the COVID zero policy starts to relax on the mainland and in Hong Kong. All of this made the Chinese Yuan rally and the Chinese market rally on the normalization of both monetary policy and COVID policy guidance.
Germany’s Chancellor Scholz and China’s President Xi Jinping are ensuring global stability and prosperity in Eurasia, which is good news.


Japan:
The Japanese Consumer Confidence data came in line with expectations and were no surprise given the Bank of Japan measures that are still devaluing the Japanese Yen, even though the Bank of Japan is doing FX interventions to try to lower the devaluation of the Japanese currency. There will be no change in the outlook for Japan until Abenomics and MMT are winded down in Japan, as explained before.
Folks, enjoy the weekend; the market volatility data will be posted on Sunday, along with expectations for next week’s data.
Do feel free to share, leave a comment and subscribe to Quantuan Research Substack if you want, by using the next buttons.