


Hawkishness surges, but long-term expectations remain dovish as inflationary pressures ease towards the price stability goal, although reflationary risk persists given warfare.
Analysis of the current scenario with forward data expectations.

I planned to post this on Sunday, but ended up taking more time than expected to post it. As mentioned before, this is my hobby, not my job; enjoy the read, folks.
United States:
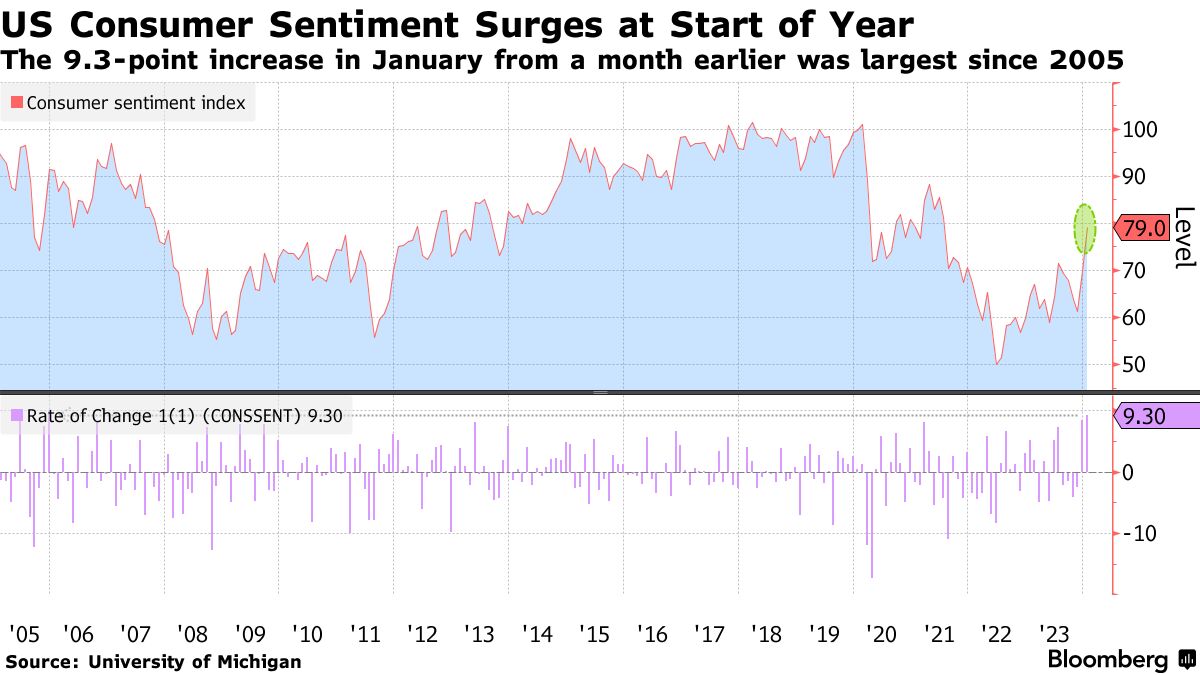
The United States is performing in the range of expectations; statistics continue to show the strength of the consumer and consequently the health of the economy; this is reflected in the continuing improvements in consumer sentiment. Democratic-affiliated Americans’ sentiment is almost at lustrum highs, while Republican-affiliated Americans’ sentiment stalls. Overall, Americans’ sentiment has risen, as can be seen in the next two charts.
Figure 1. Democratic-Affiliated Americans’ Sentiment Is More Optimistic Than Republican-Affiliated Americans’ Sentiment.
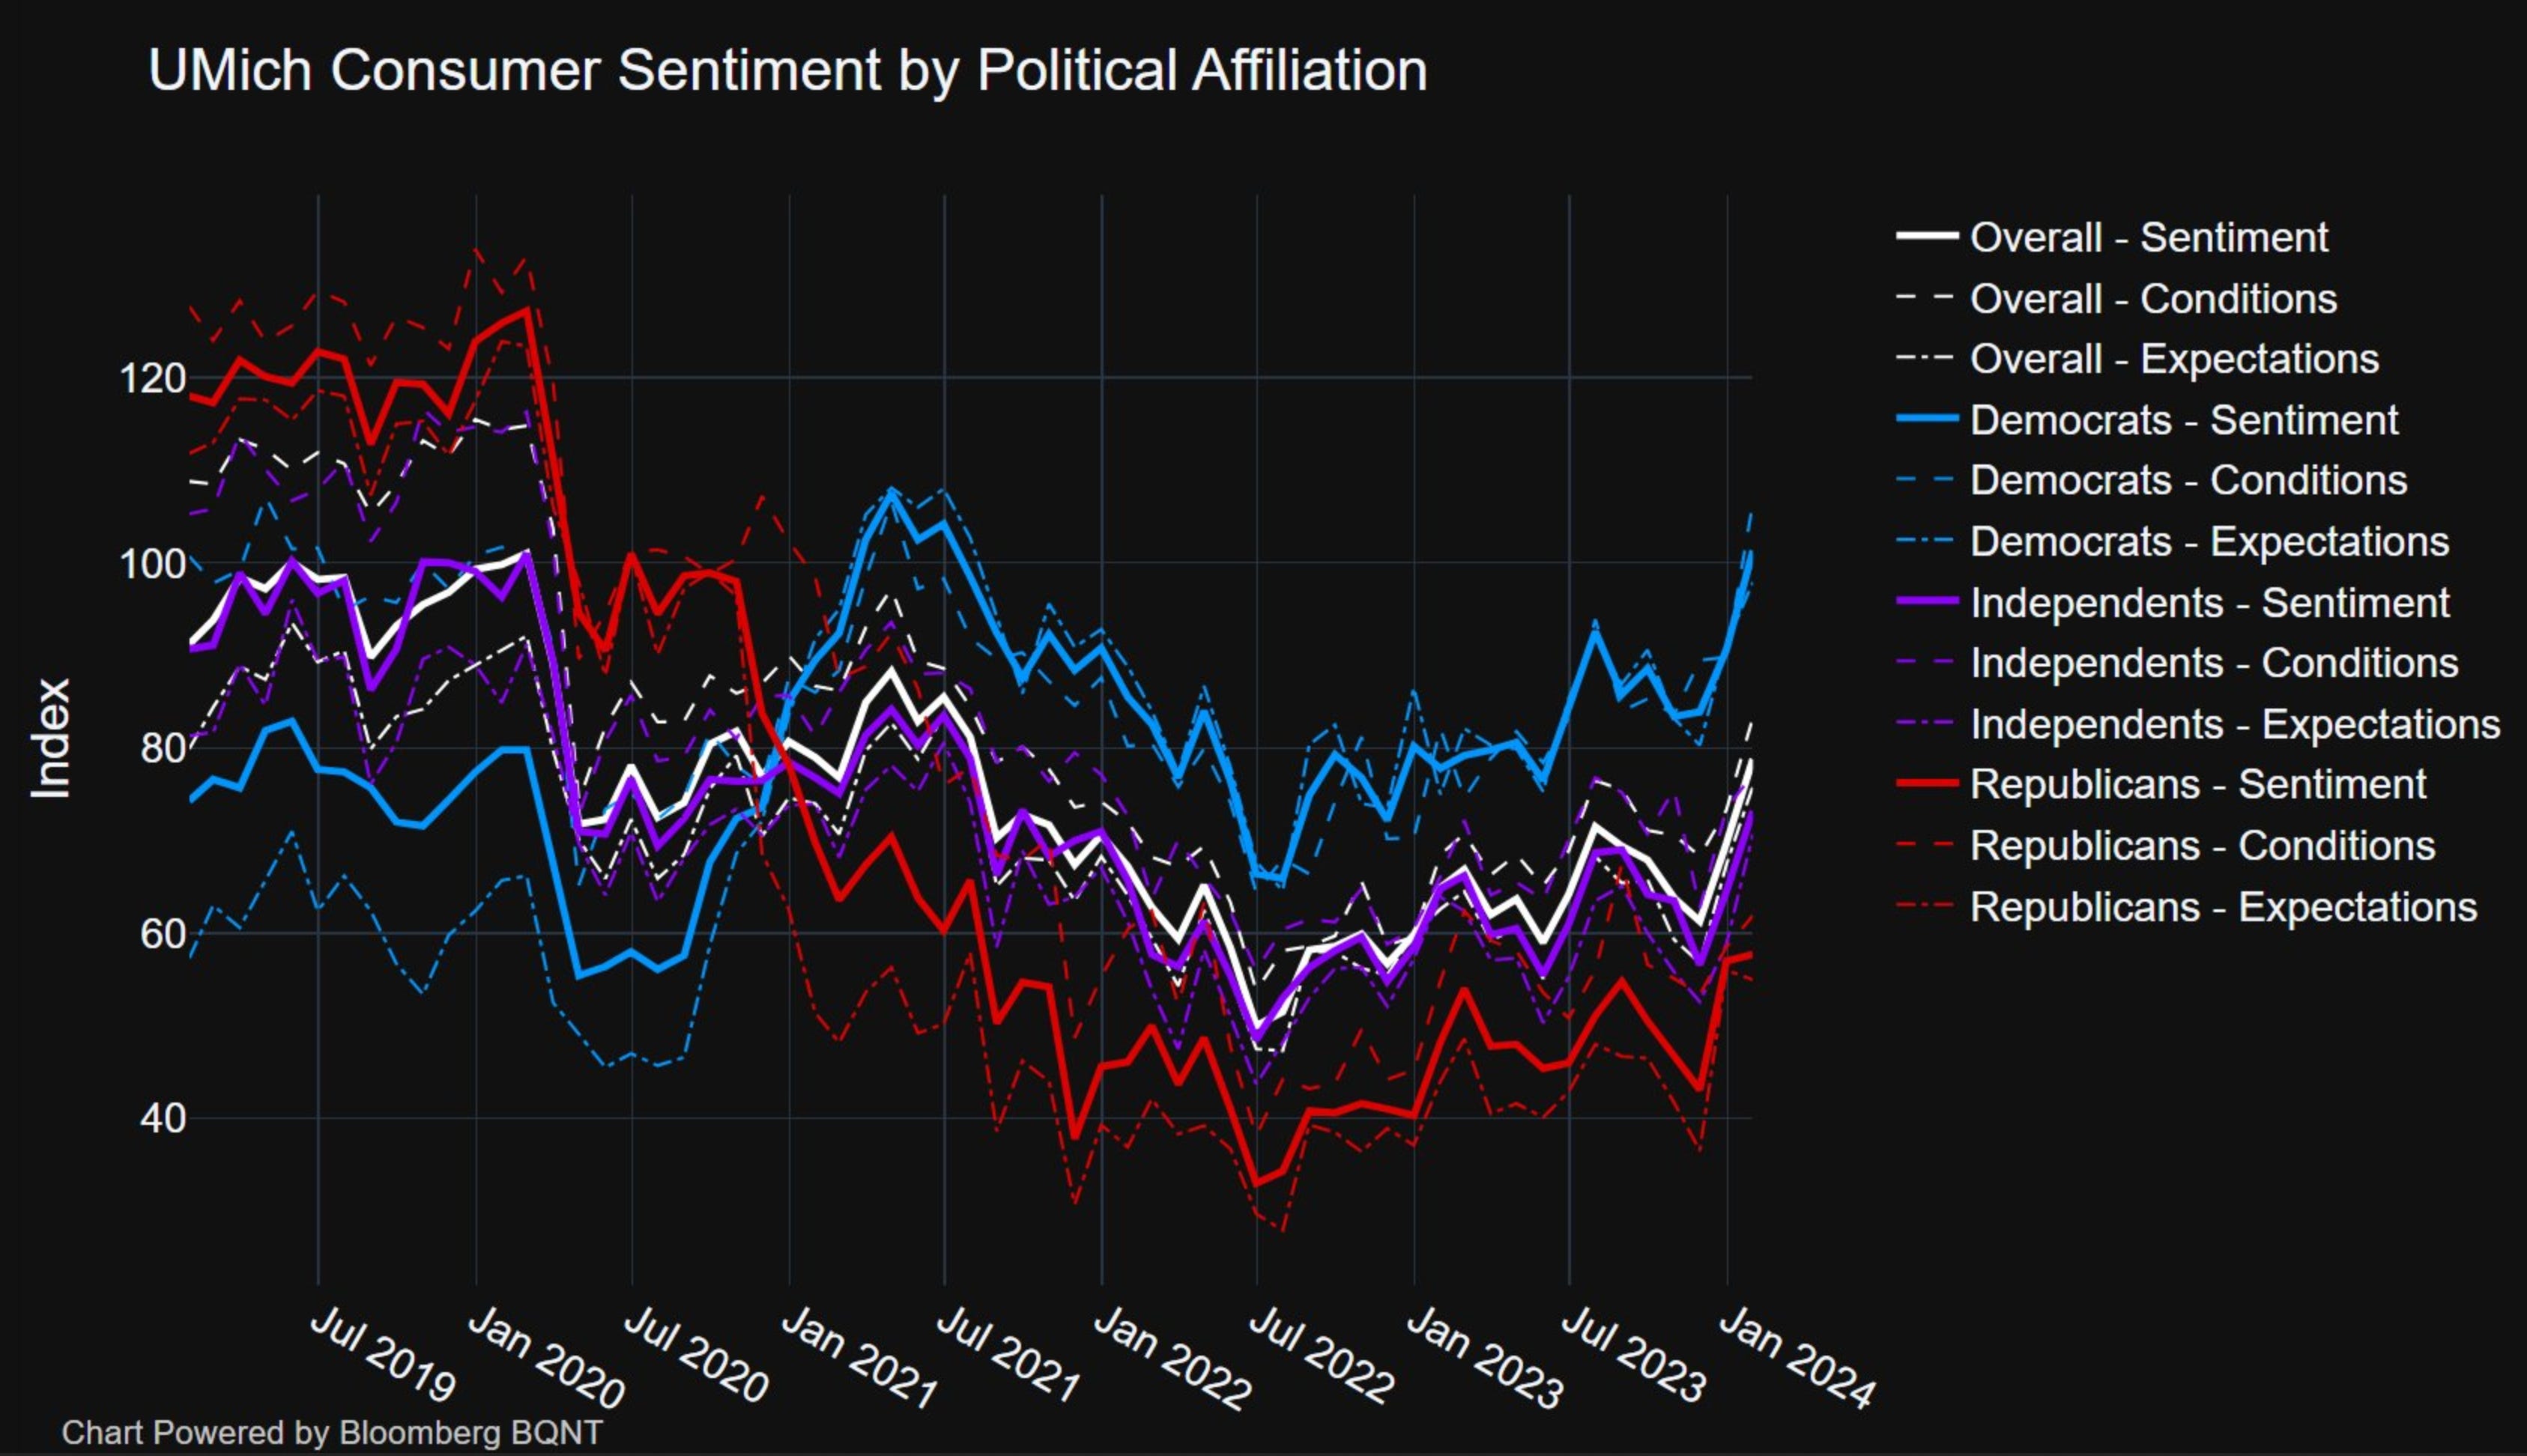
Figure 2. Overall, Americans’ Sentiment Has Risen.
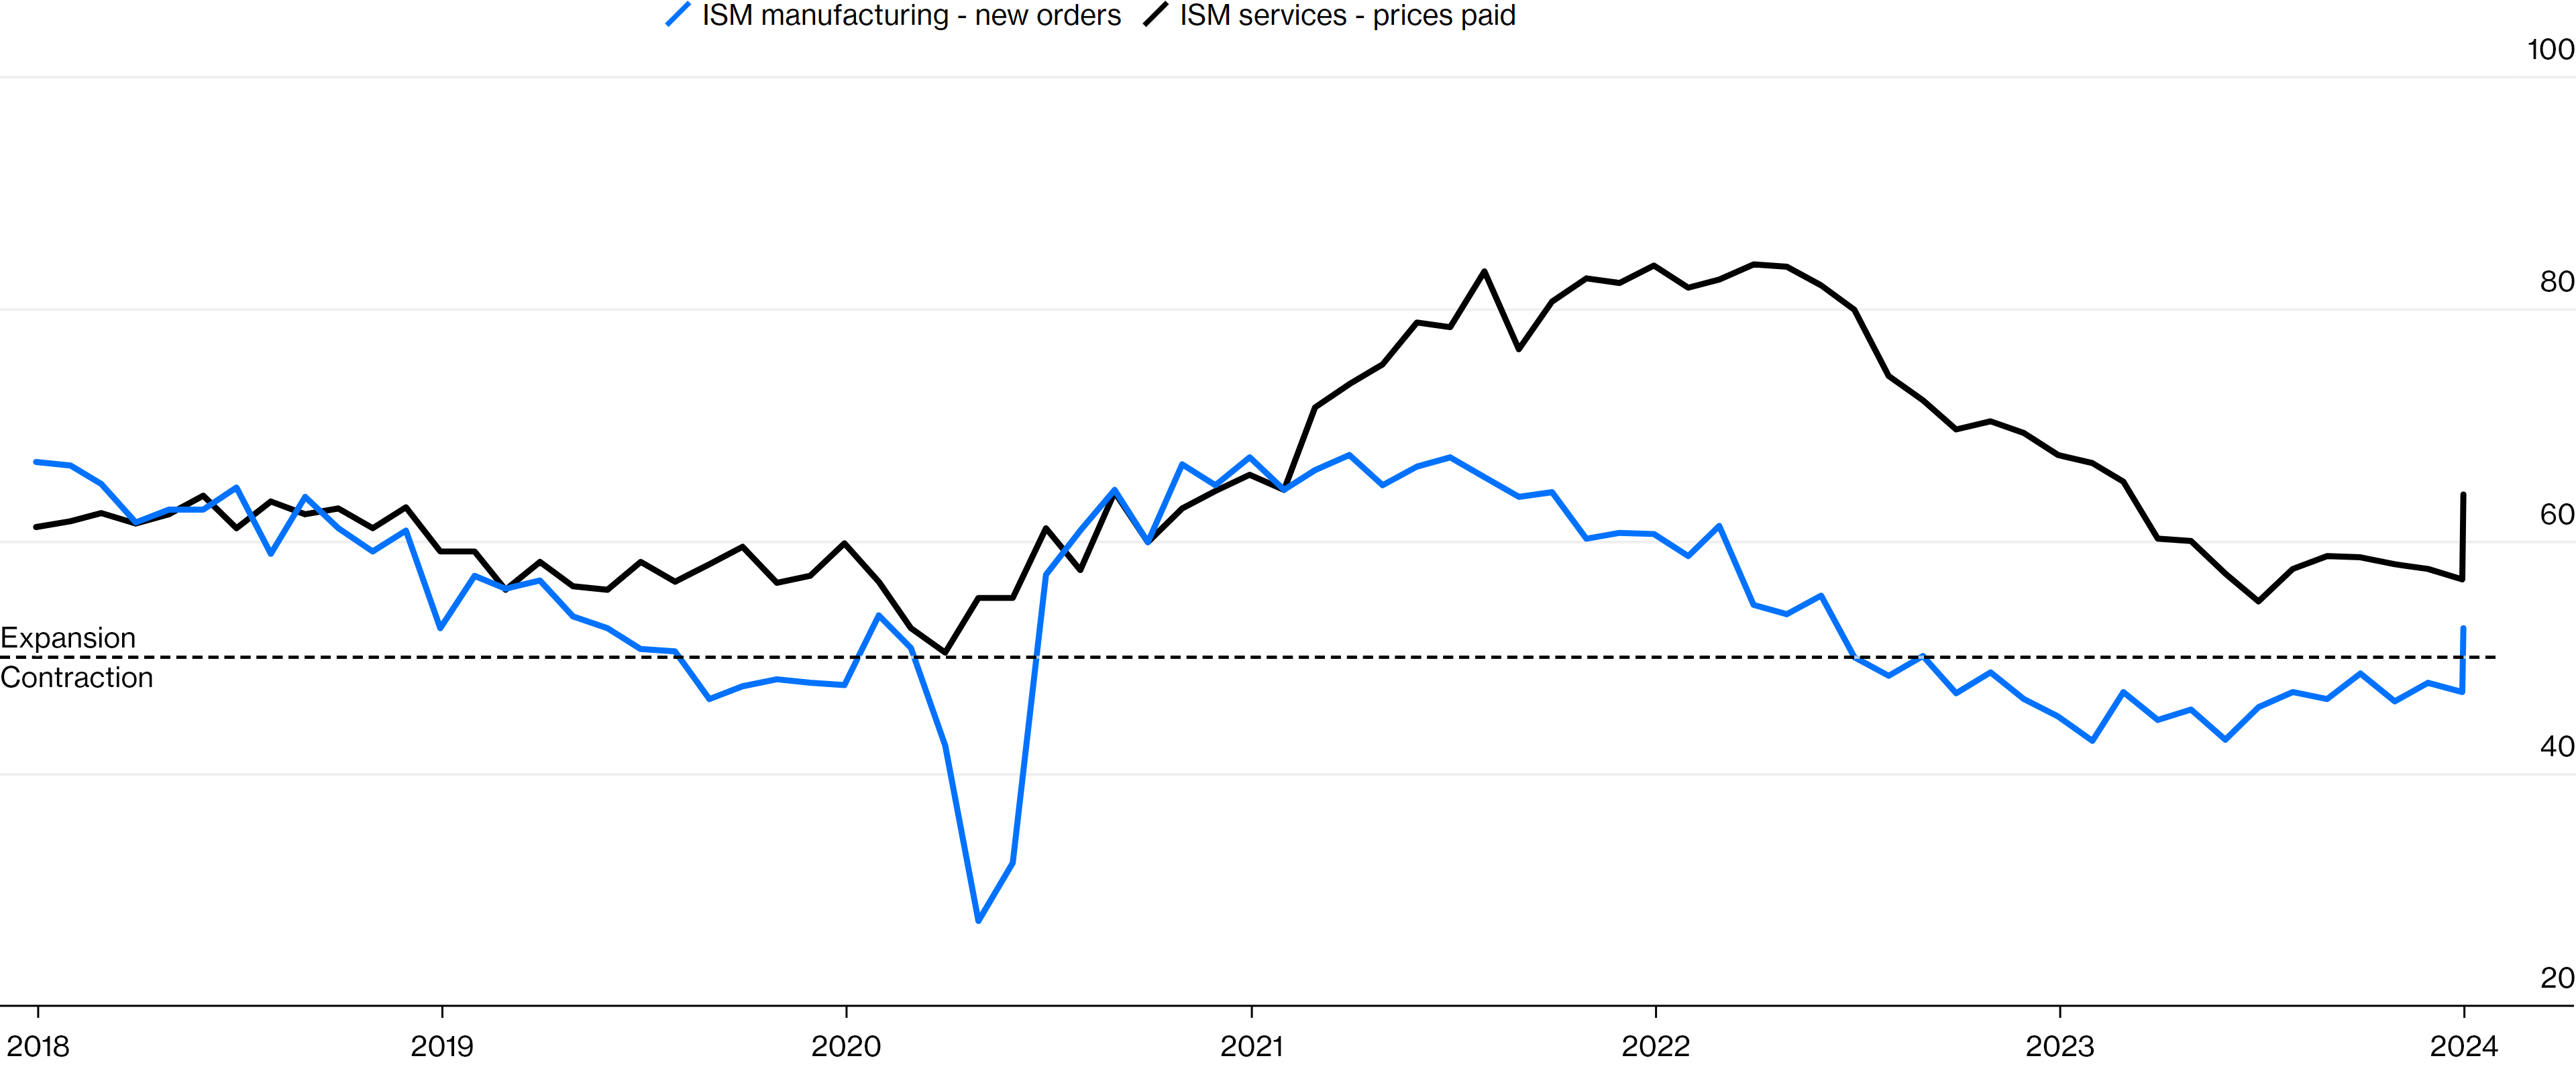
Inflationary pressures persist, although Supercore Personal Consumption Expenditures (PCE) inflation statistics and Core Personal Consumption Expenditures (PCE) inflation statistics continue to ease; the main drivers of the current inflationary pressures keep being geopolitical and natural factors that generate supply-driven inflationary pressures, as explained before. Something quite remarkable is that the current supply-chain disruptions are generating another bullwhip effect in the Institute for Supply Management (ISM®) Manufacturing New Orders statistics, and the supply-driven inflationary pressures have generated a spike in the Institute for Supply Management (ISM®) Services Prices statistics.
Figure 3. Supercore Personal Consumption Expenditures (PCE) Inflation Continues To Ease.
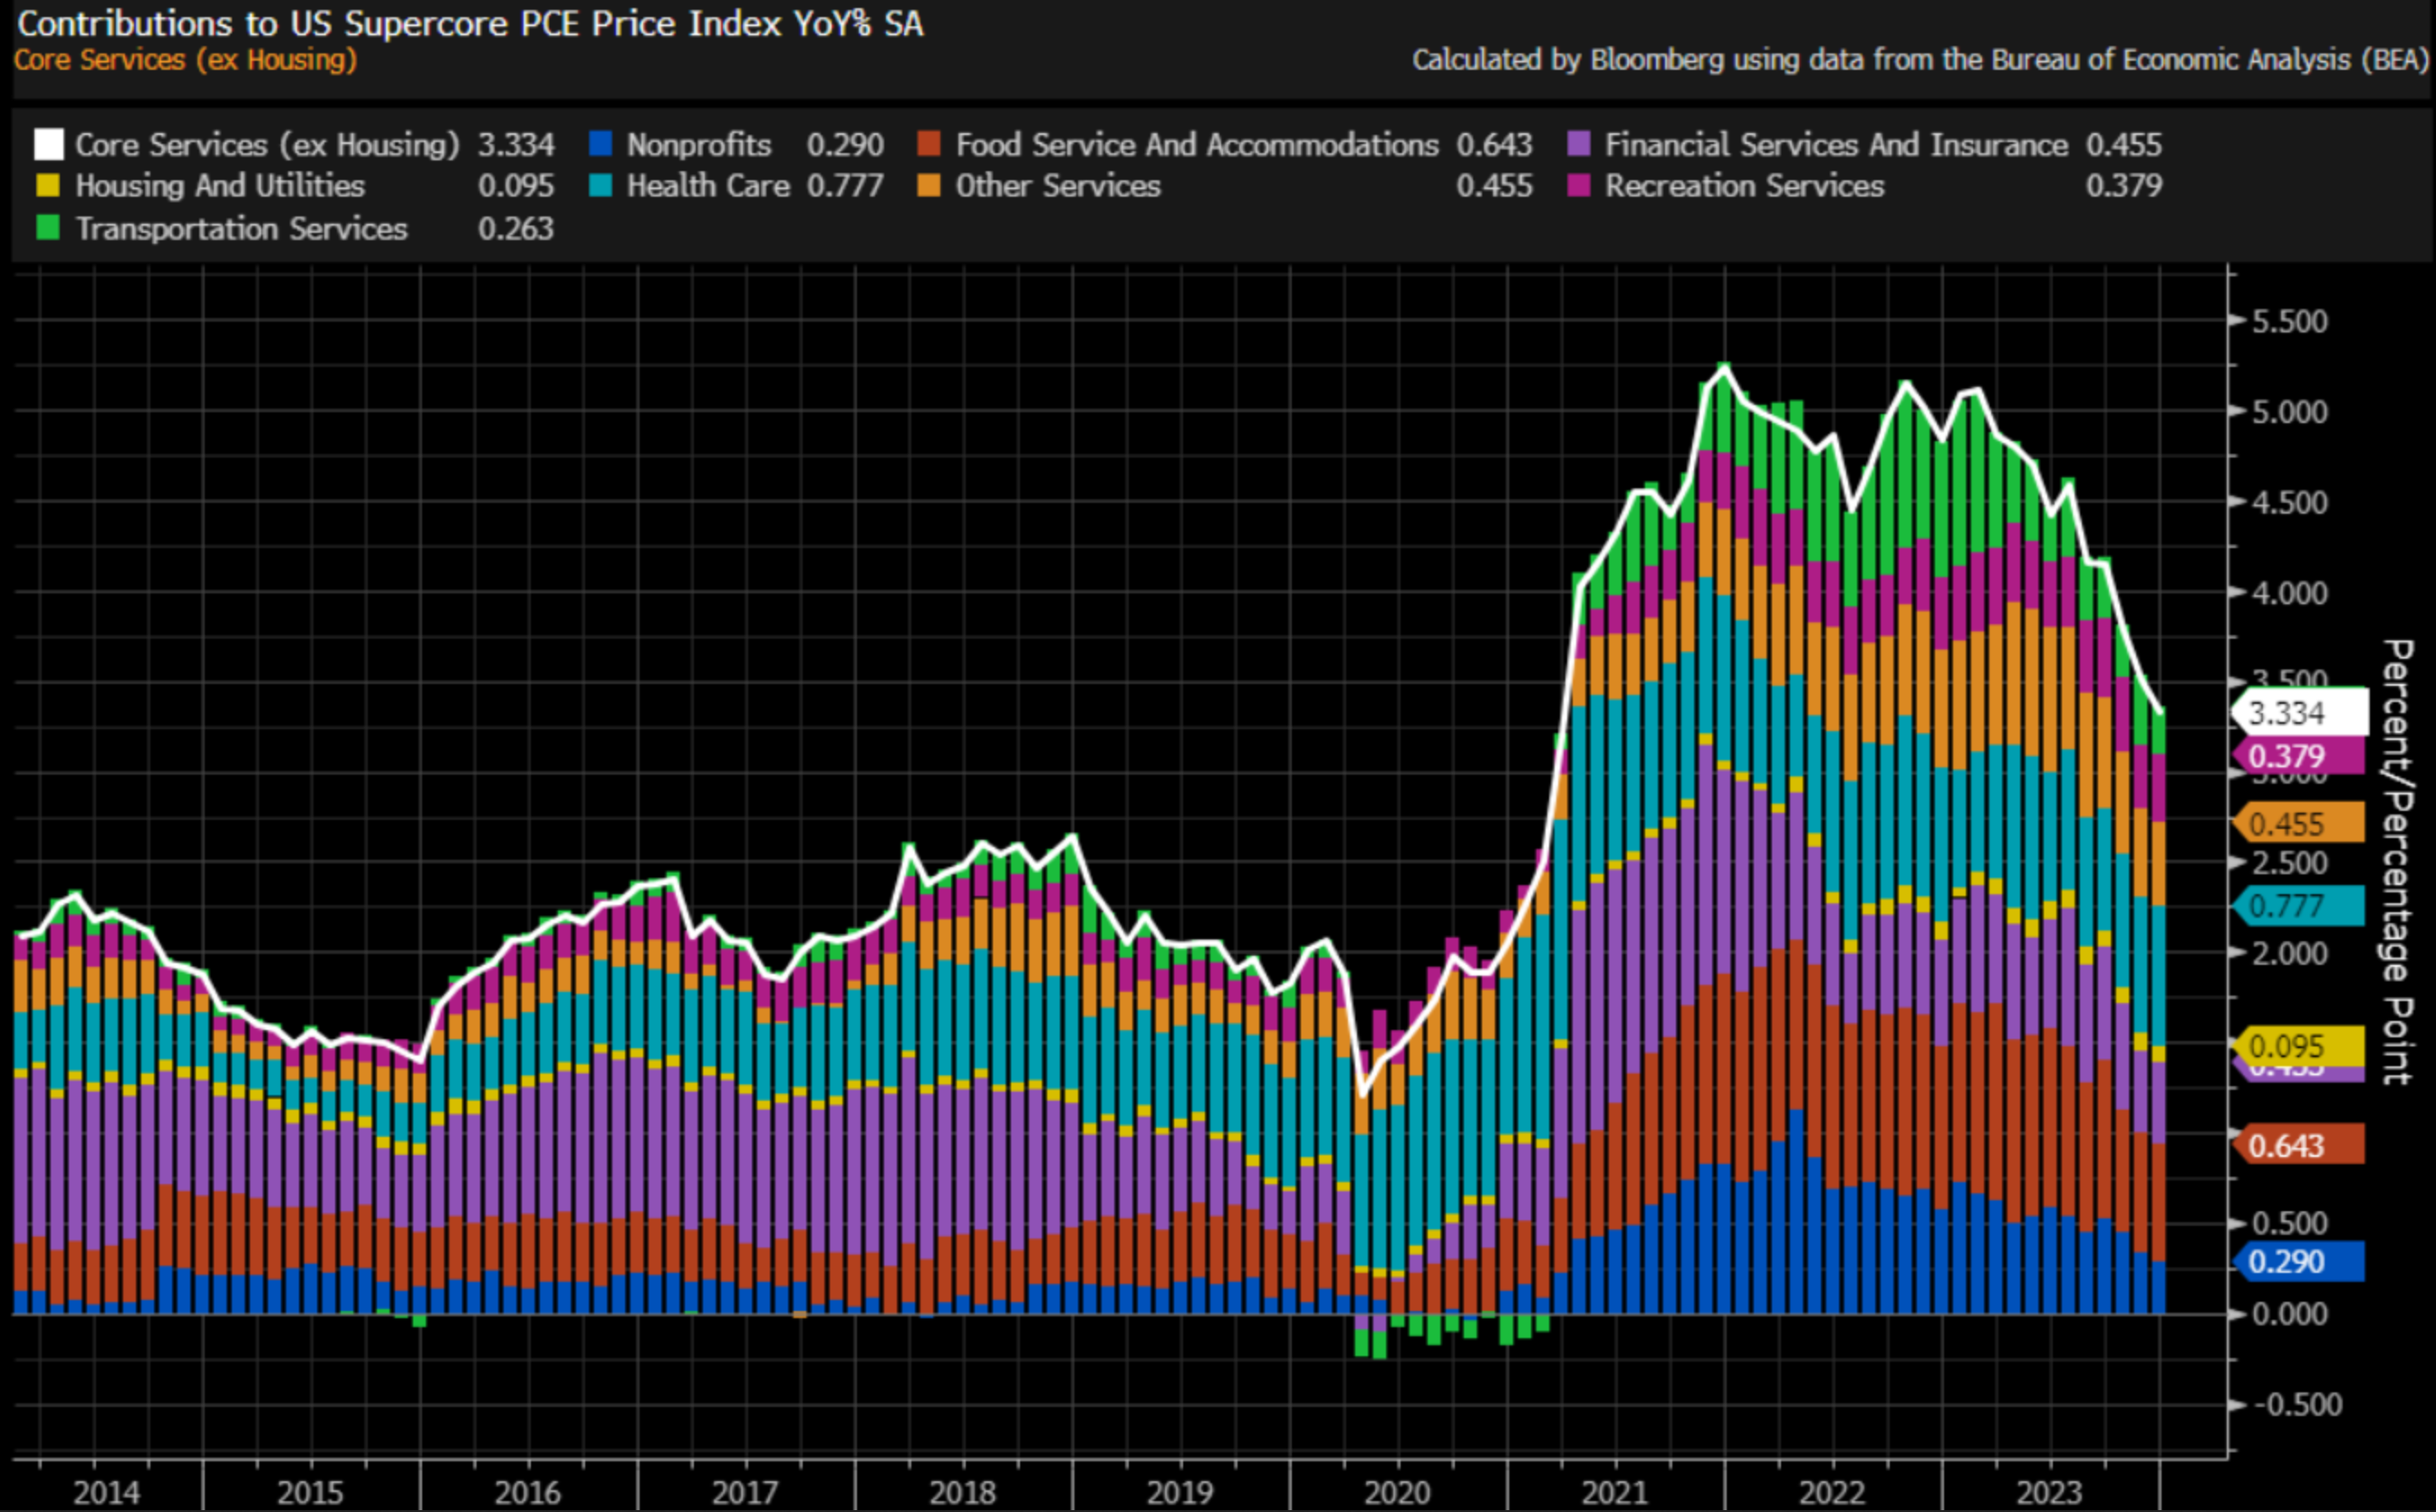
Figure 4. Core Personal Consumption Expenditures (PCE) Inflation Continues To Ease.
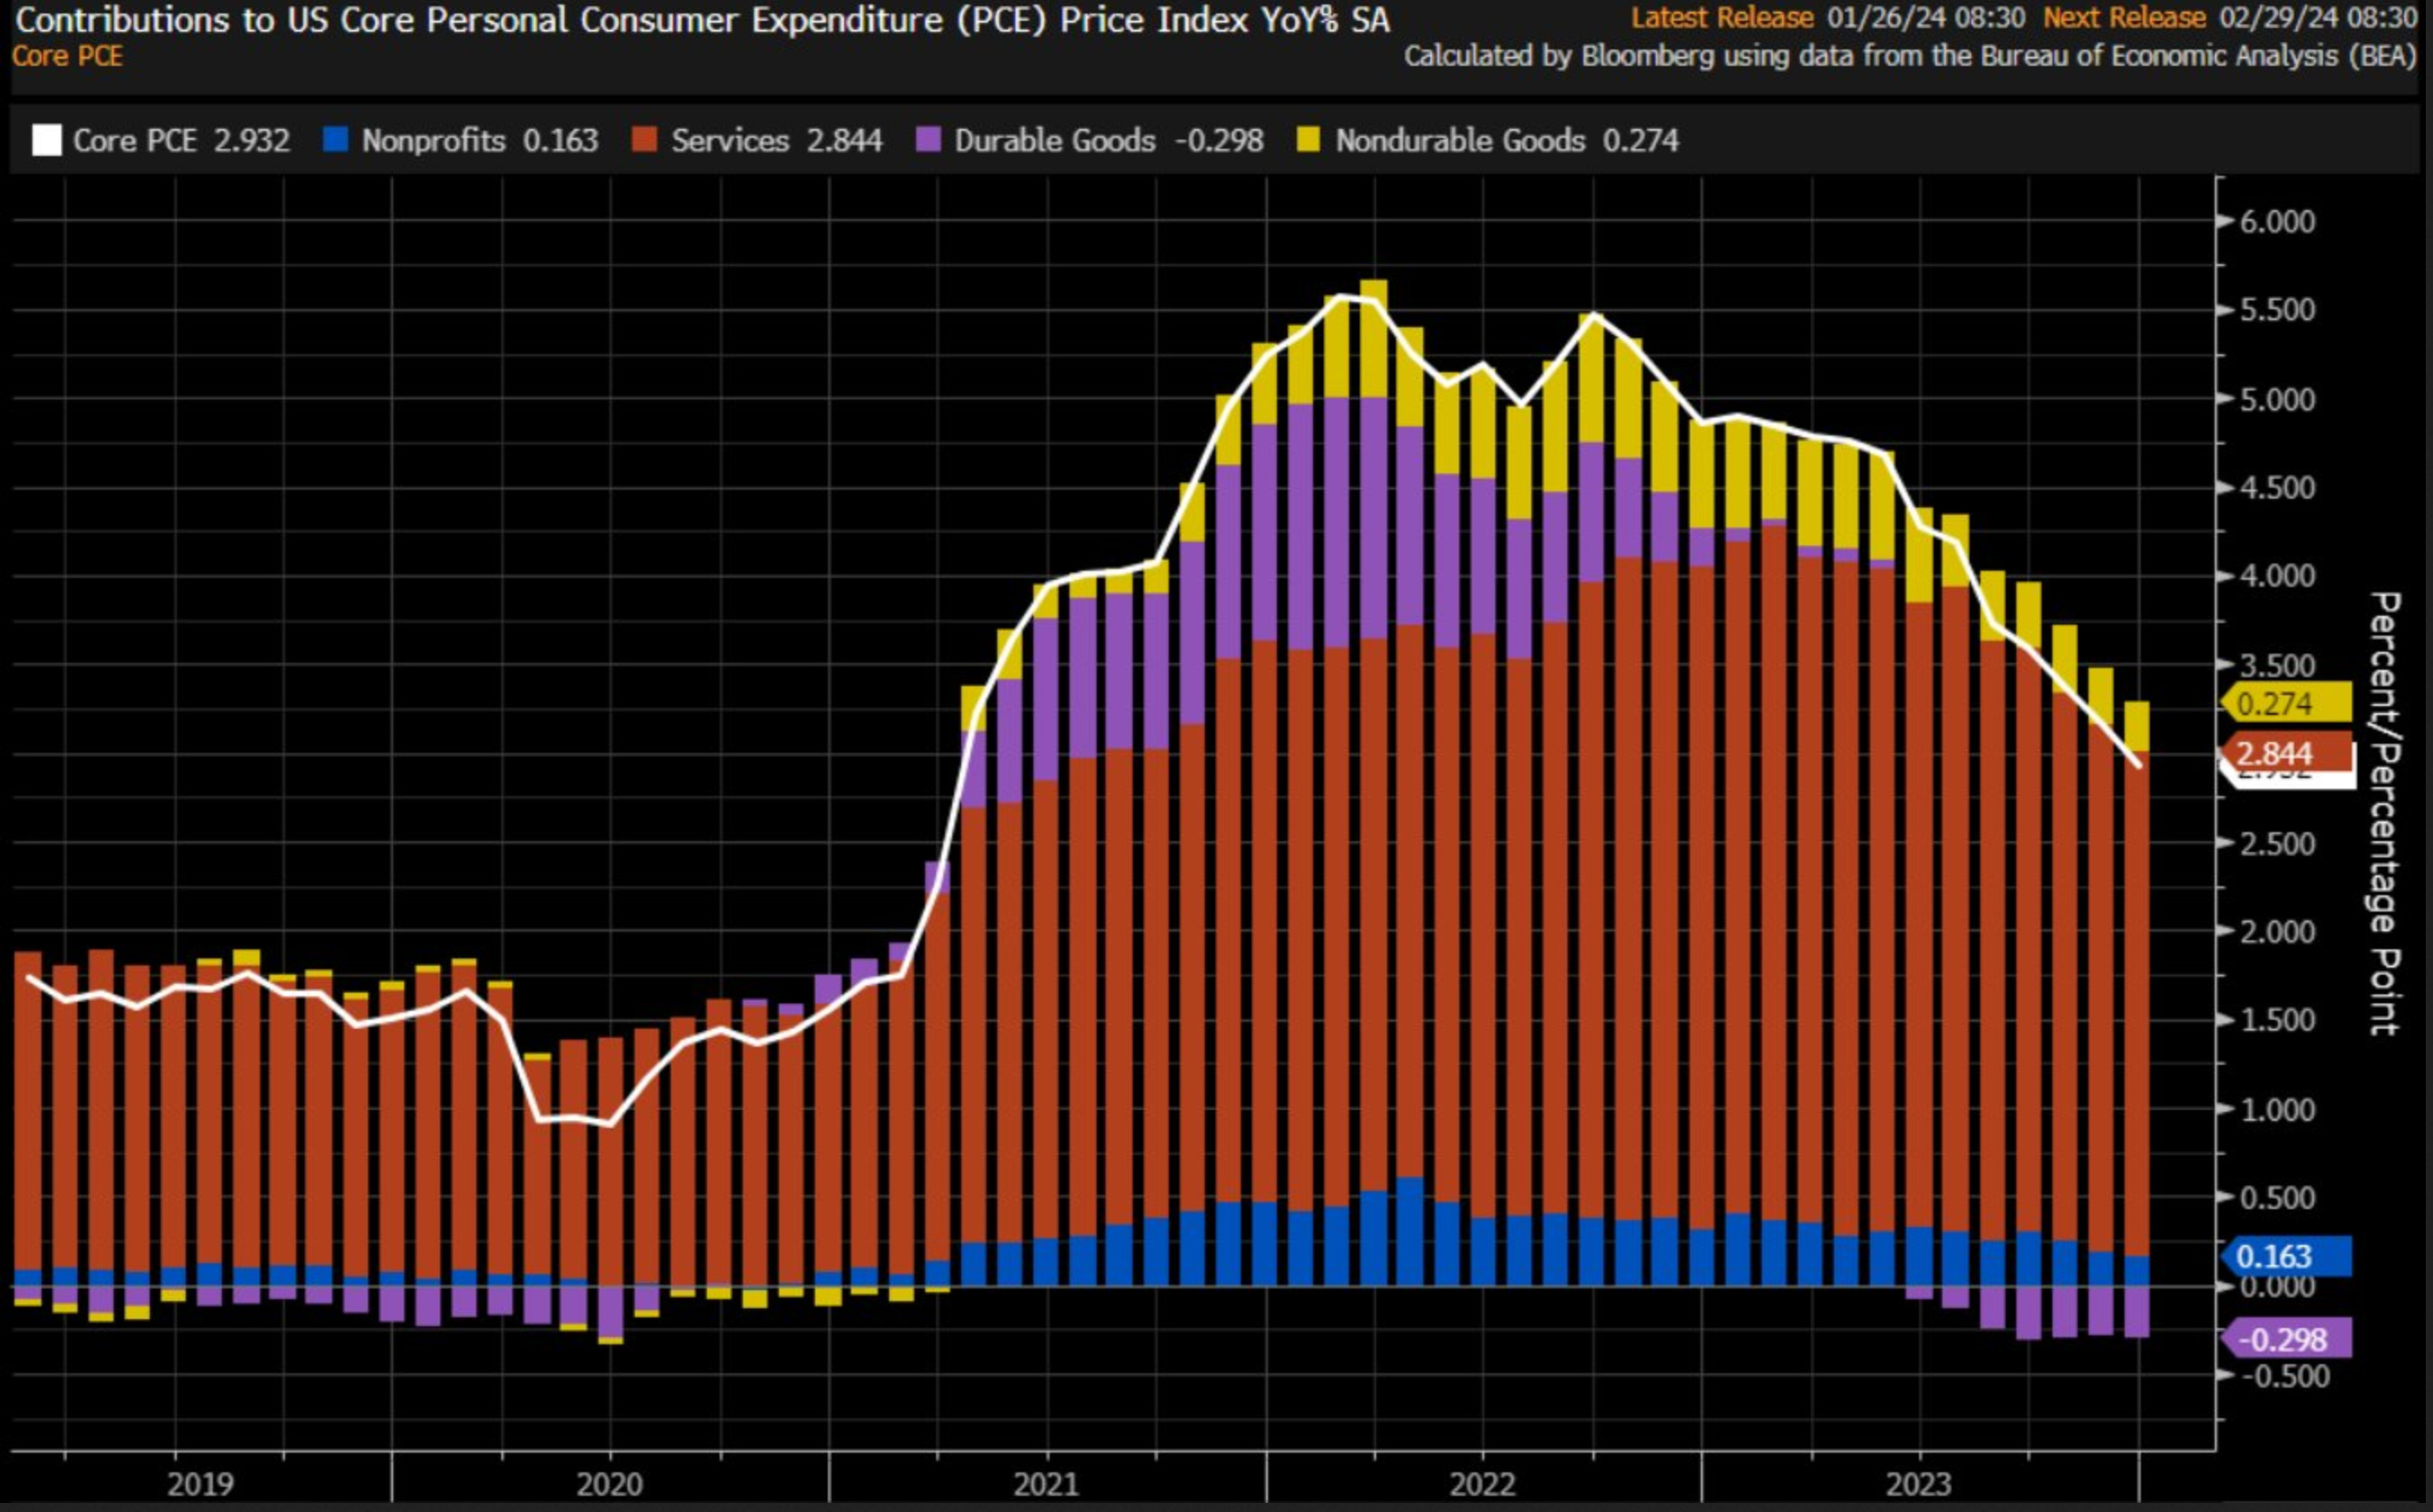
Figure 5. Supply-Chain Disruptions Are Generating Another Bullwhip Effect In The Institute For Supply Management (ISM®) Statistics.
The labor market, as explained before, is strong, and recent labor market statistics may shift a little from the current strong path in the labor market as mass layoffs are occurring, which coincides with the last shown Federal Reserve’s Beige Book report, which indicated a “cooling labor market“, although something quite remarkable is that participation rate and productivity rate statistics keep improving.
Figure 6. The Previously Shown “Cooling Labor Market” Cited In The Federal Reserve’s Beige Book Report Is Materializing.
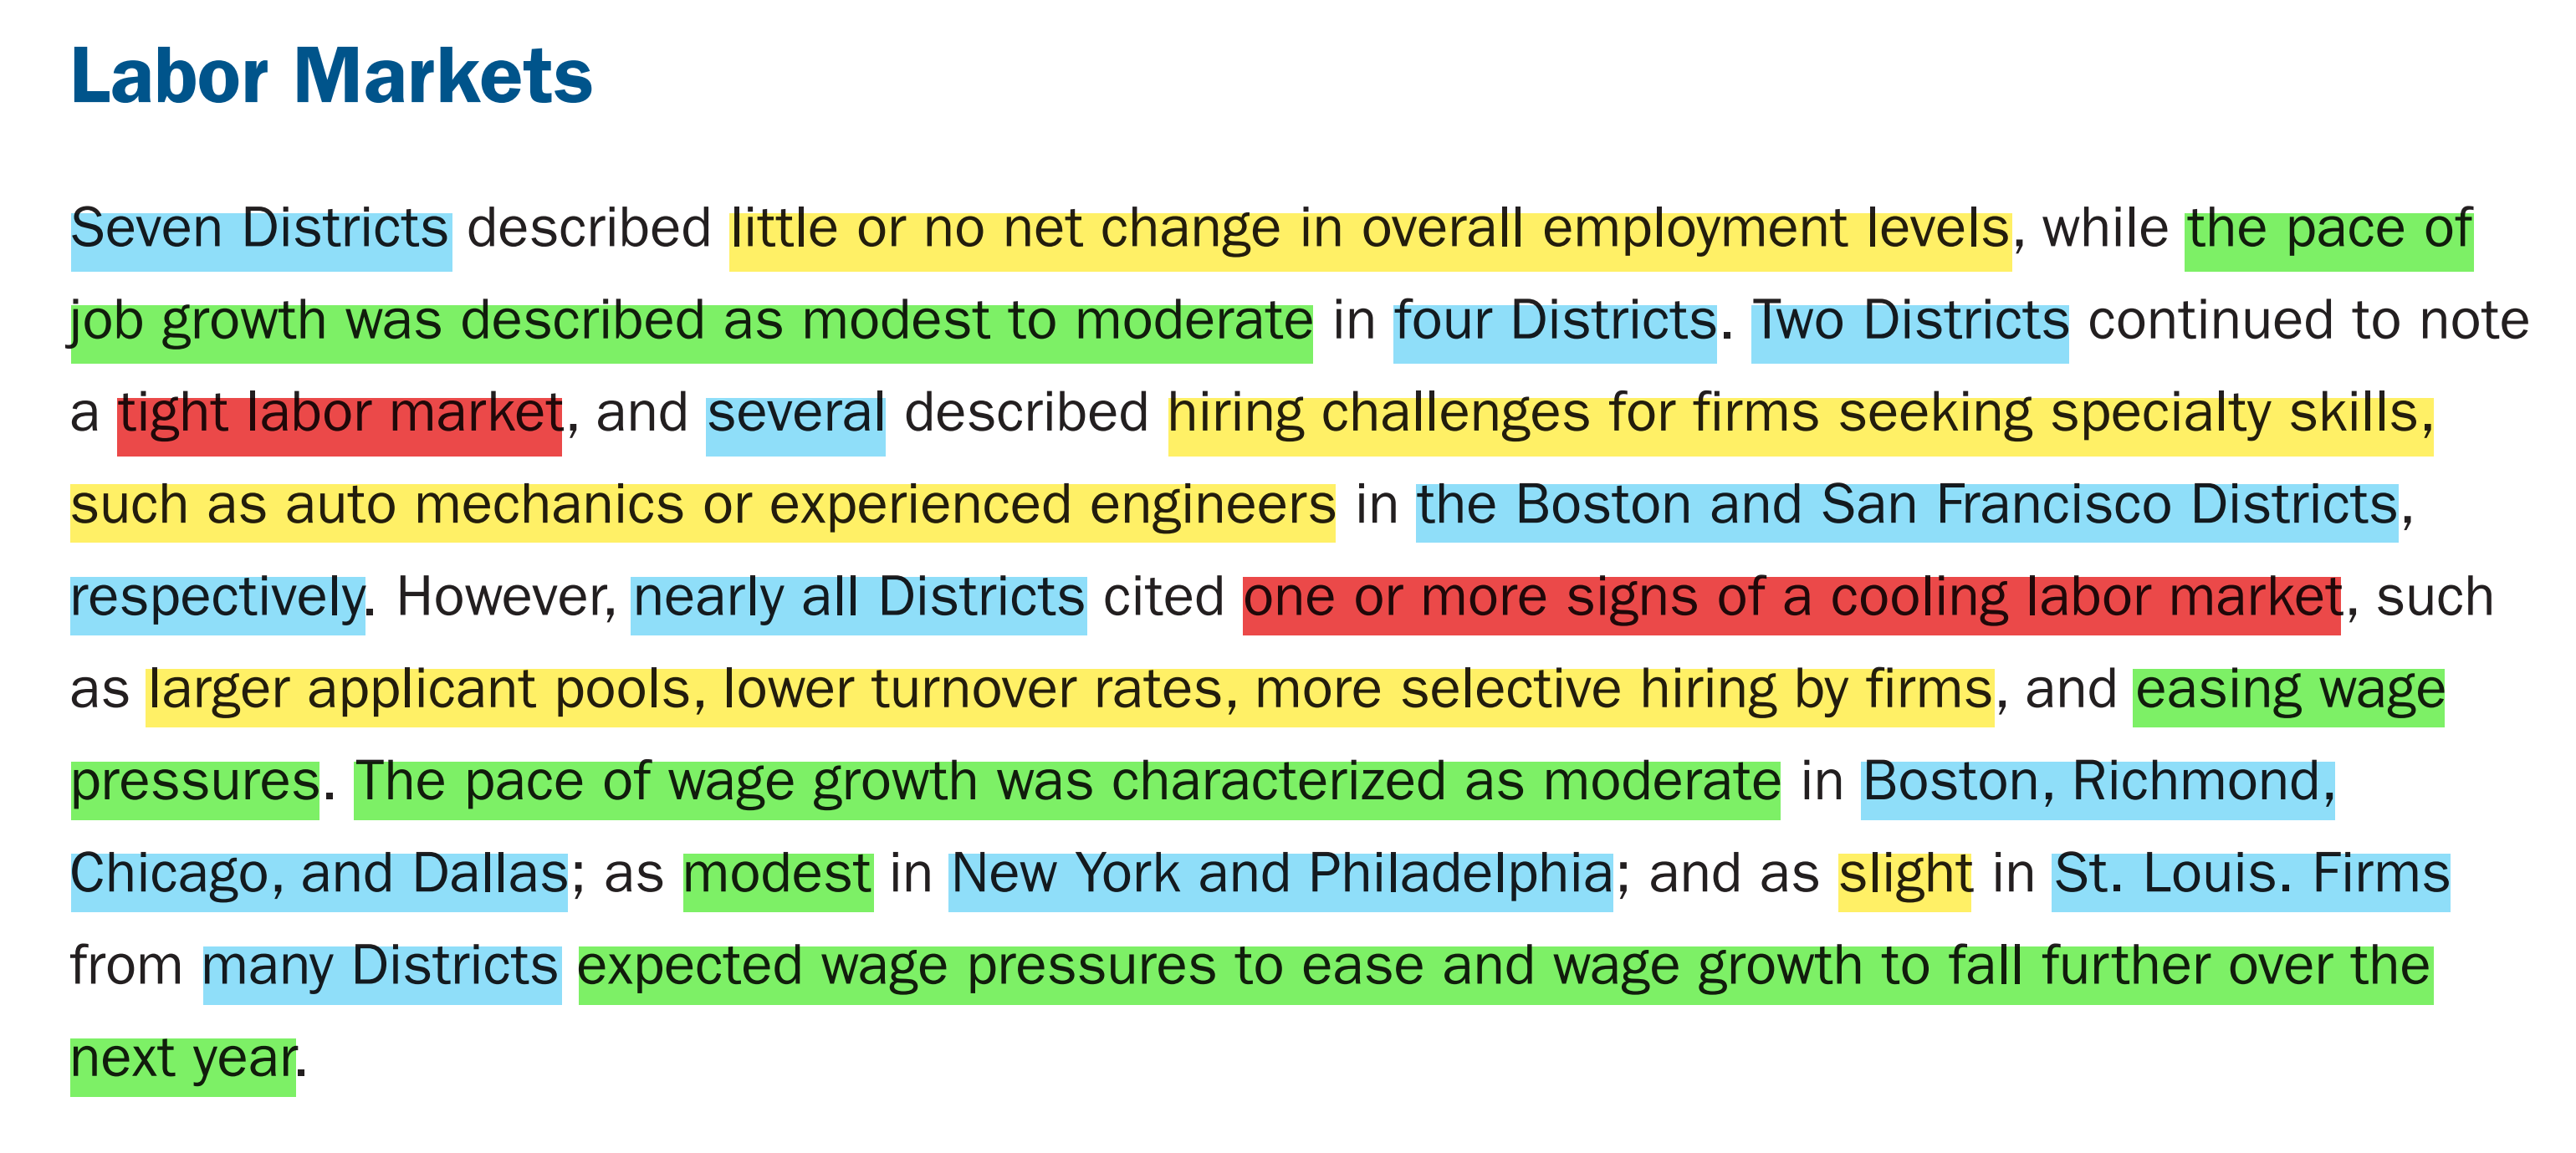
Figure 7. Tech Sector (QQQ 0.00%↑XLK 0.00%↑) Layoffs Lead The Job Cut Wave.
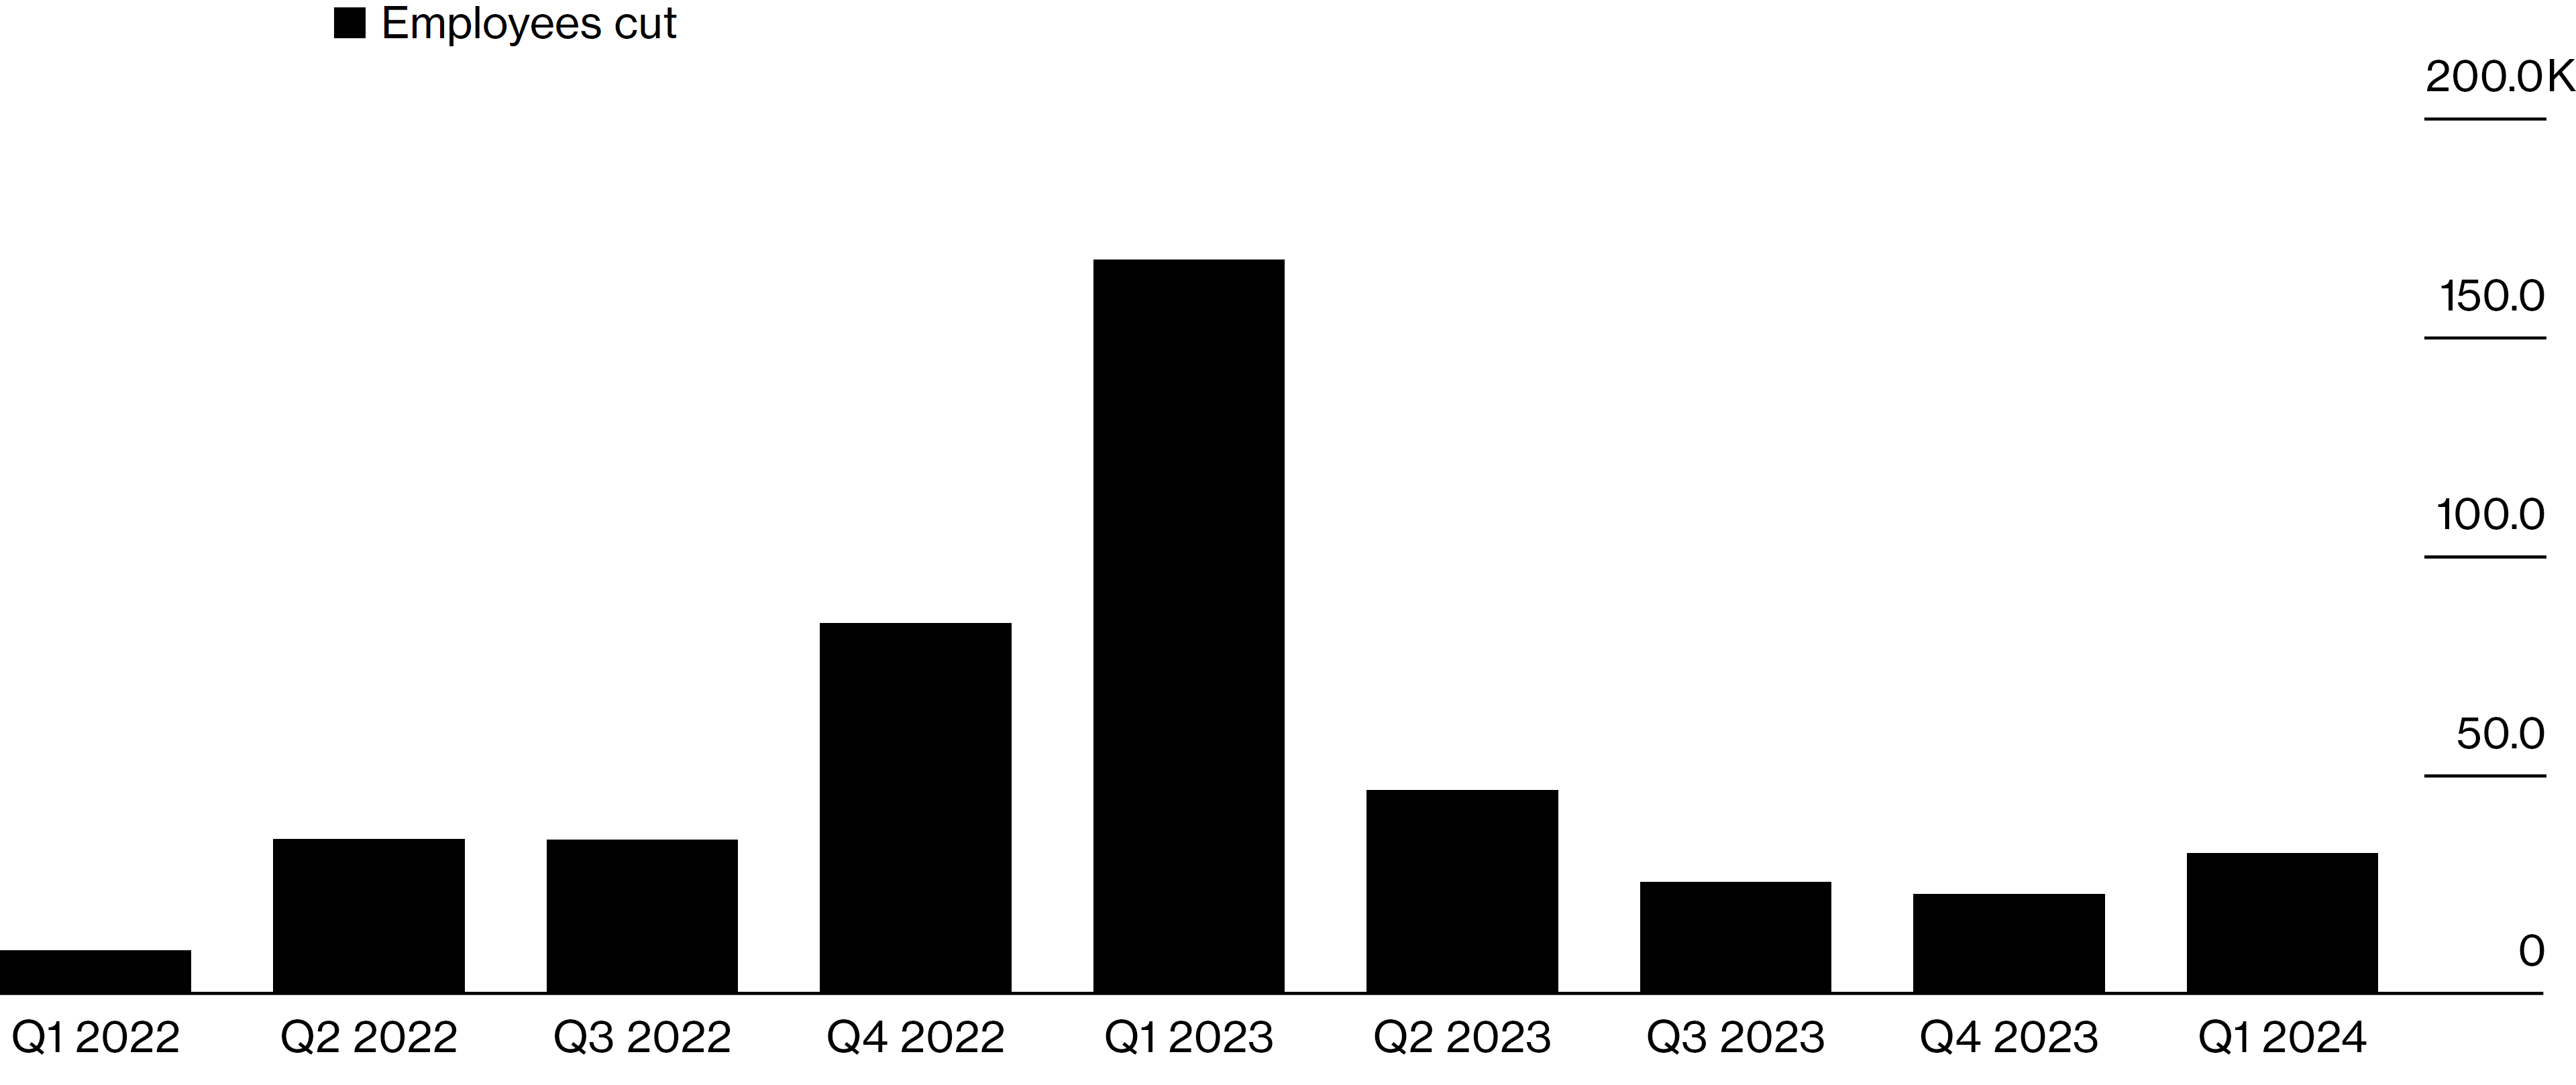
Figure 8. Amazon (AMZN 0.00%↑), Alphabet ( Google ) (GOOG 0.00%↑GOOGL 0.00%↑), Microsoft (MSFT 0.00%↑) & Meta (Formerly The Facebook Company) (META 0.00%↑) Are The Tech Sector (QQQ 0.00%↑XLK 0.00%↑) Companies That Account For Most Of Tech Sector Layoffs Percentage.
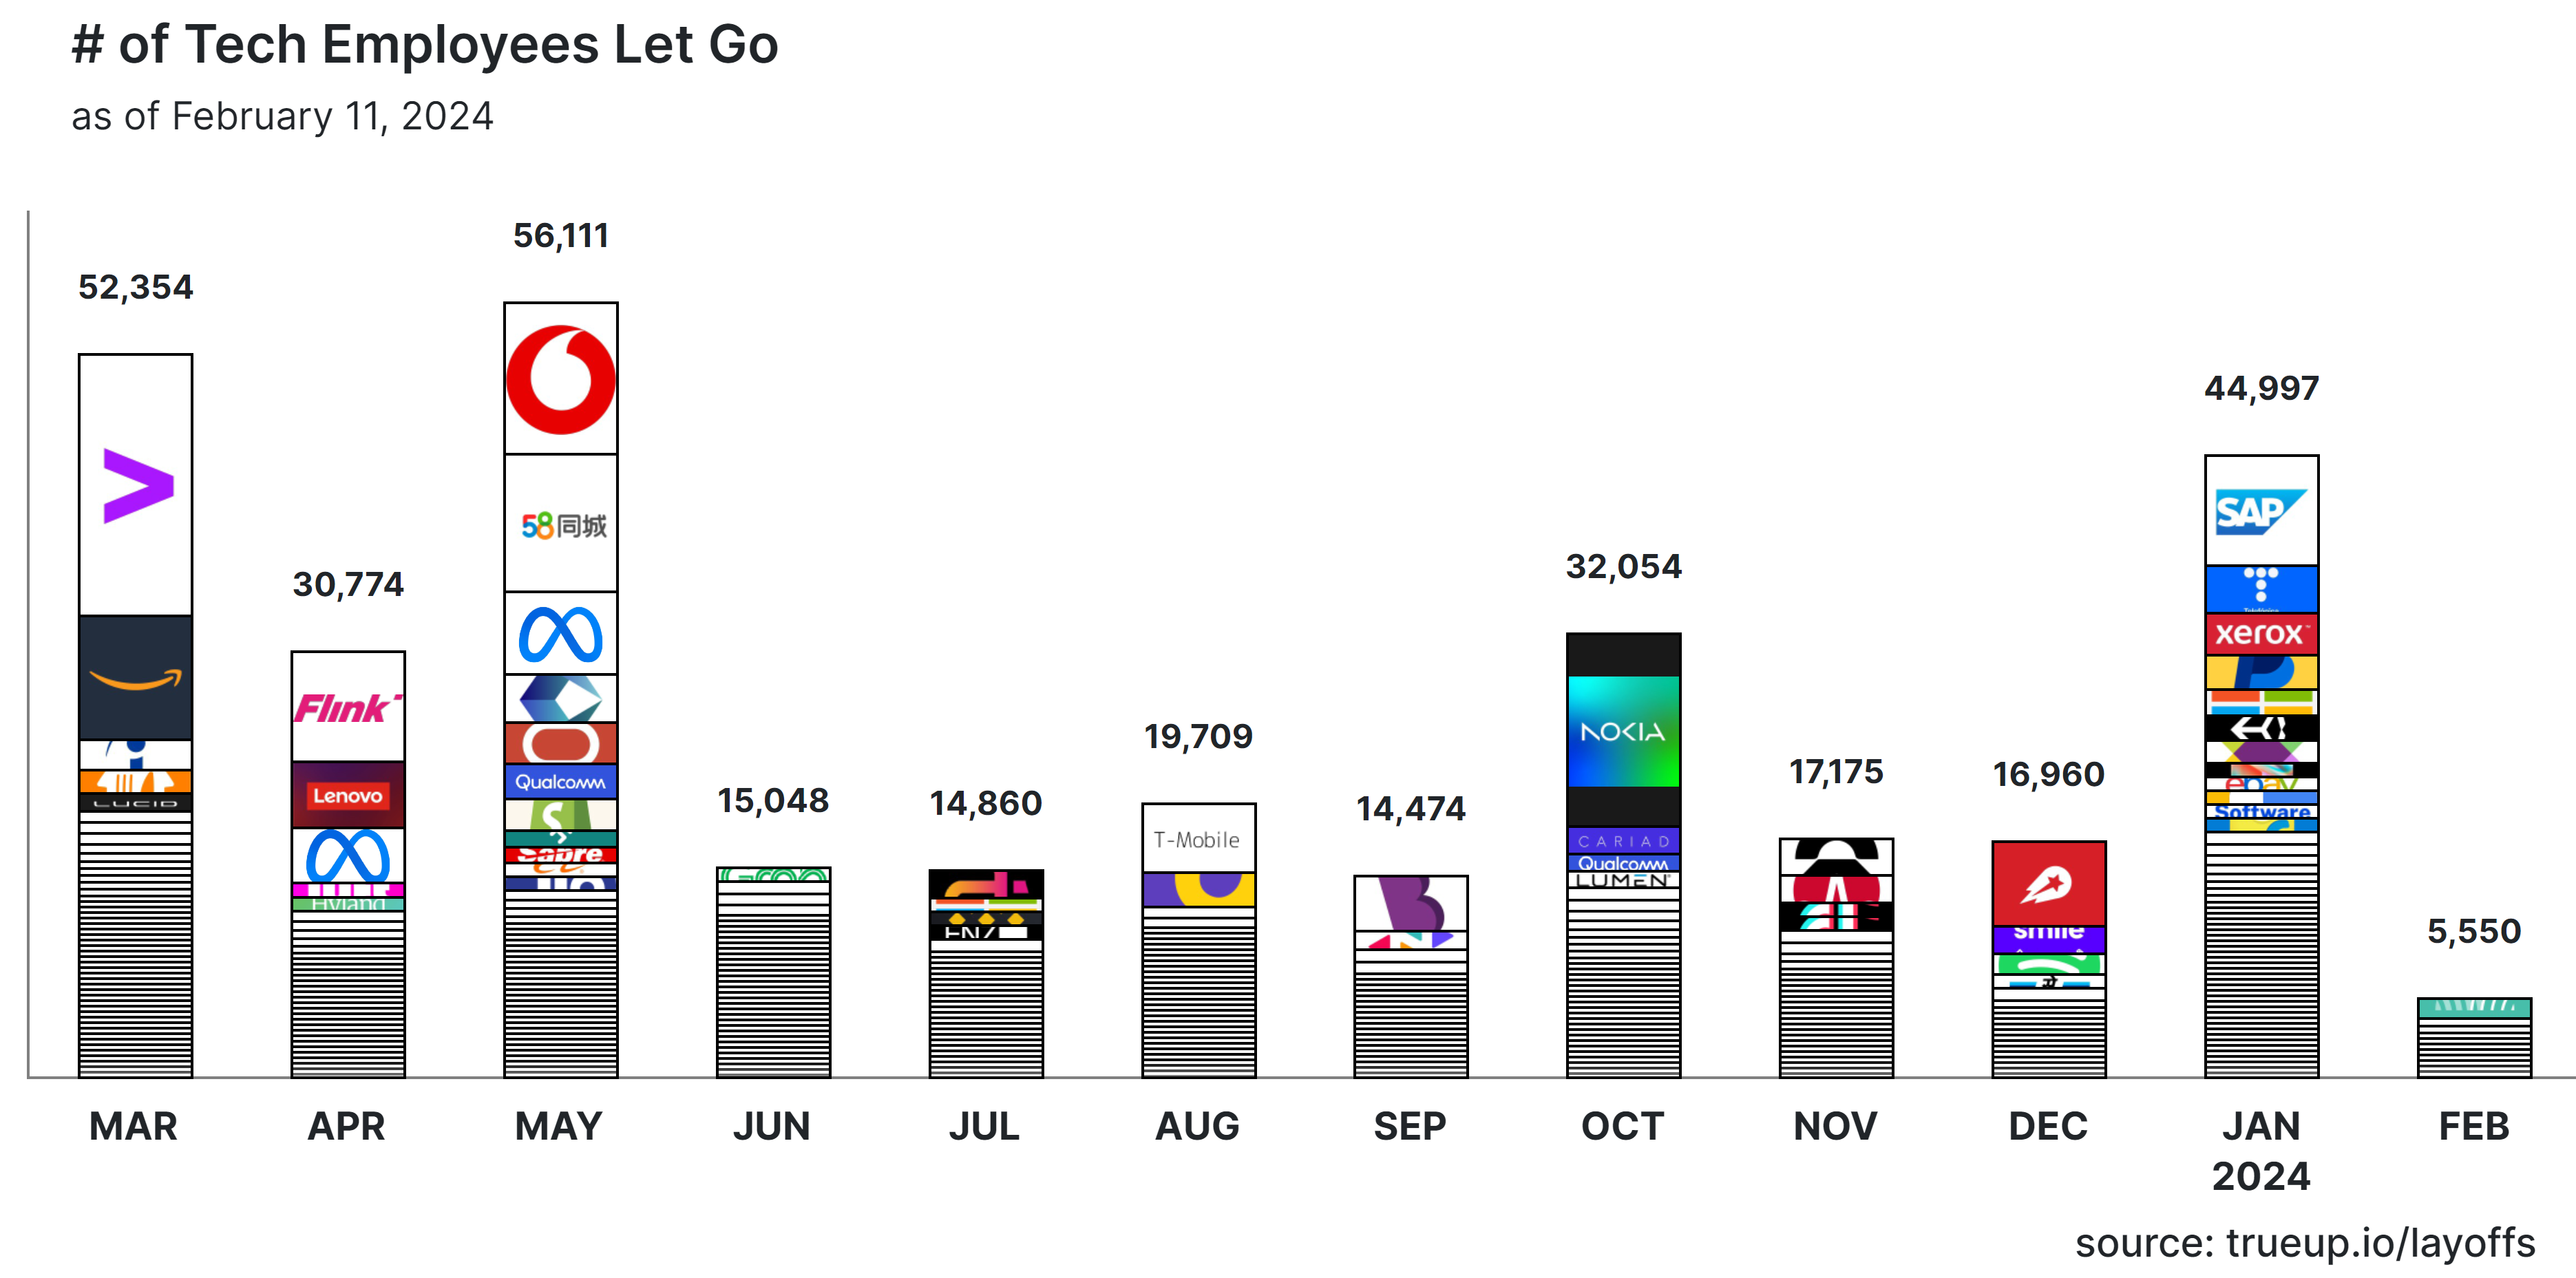
Figure 9. Meta (Formerly The Facebook Company)’s (META 0.00%↑) Job Cuts Boosted Earnings By Cutting Cost. Meta (Formerly The Facebook Company)’s (META 0.00%↑) Operating Income Reached Higher Than Pre-Pandemic Levels In The Last Quarter.
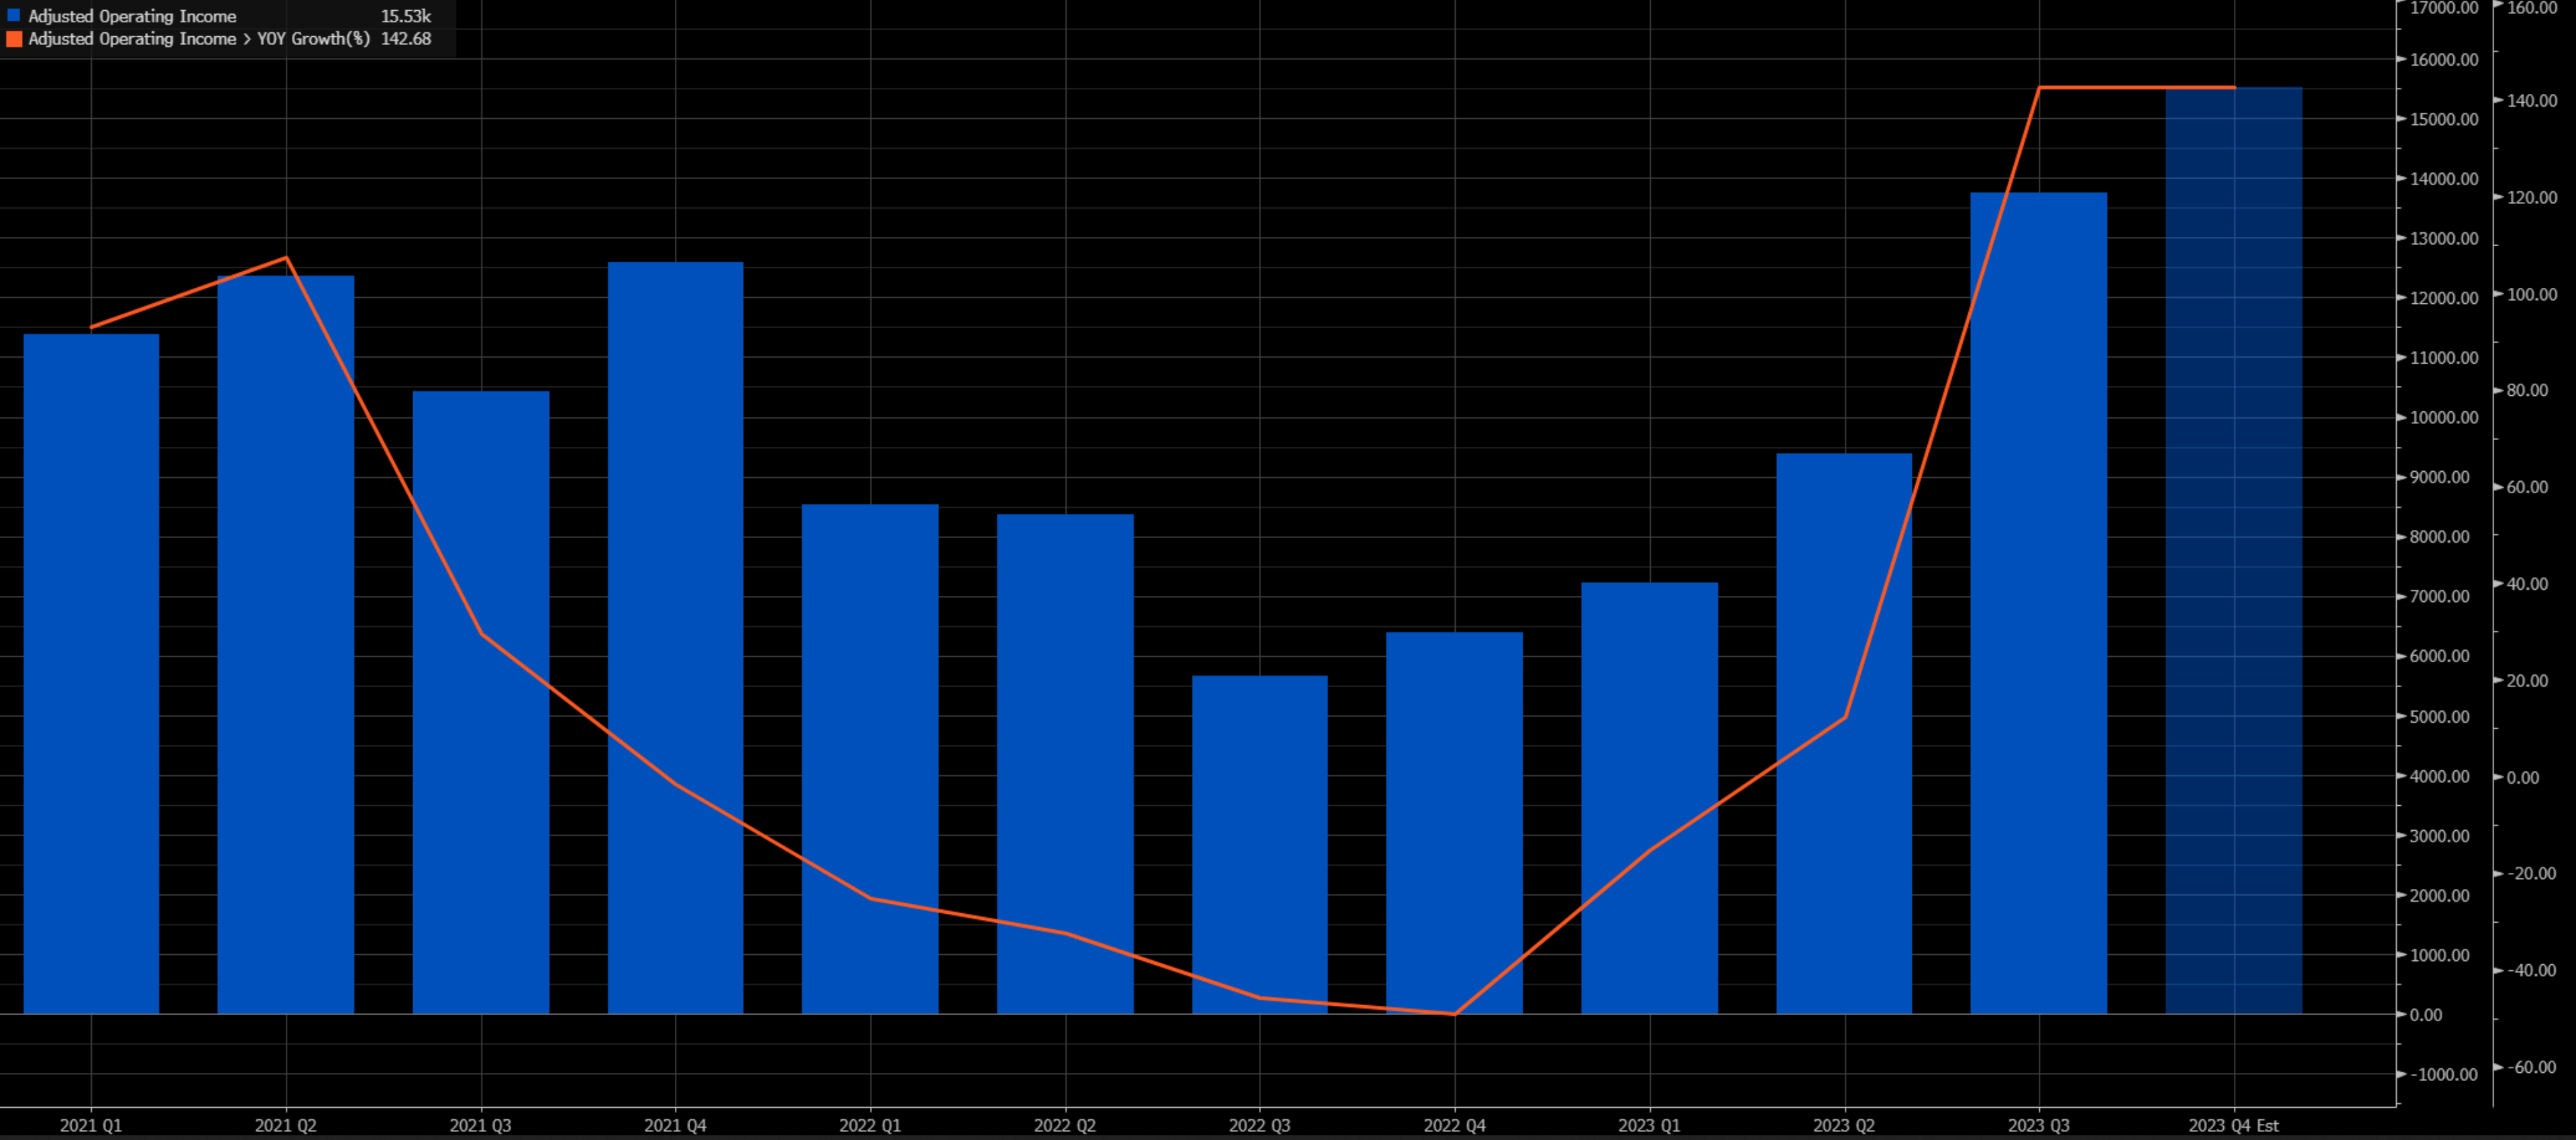
Figure 10. Layoffs & Discharges Statistics Are Lower Than Pre-Pandemic Levels, Which Downsizes Plausible Recessionary Worries Over Recent Spike In Tech Sector Layoffs.
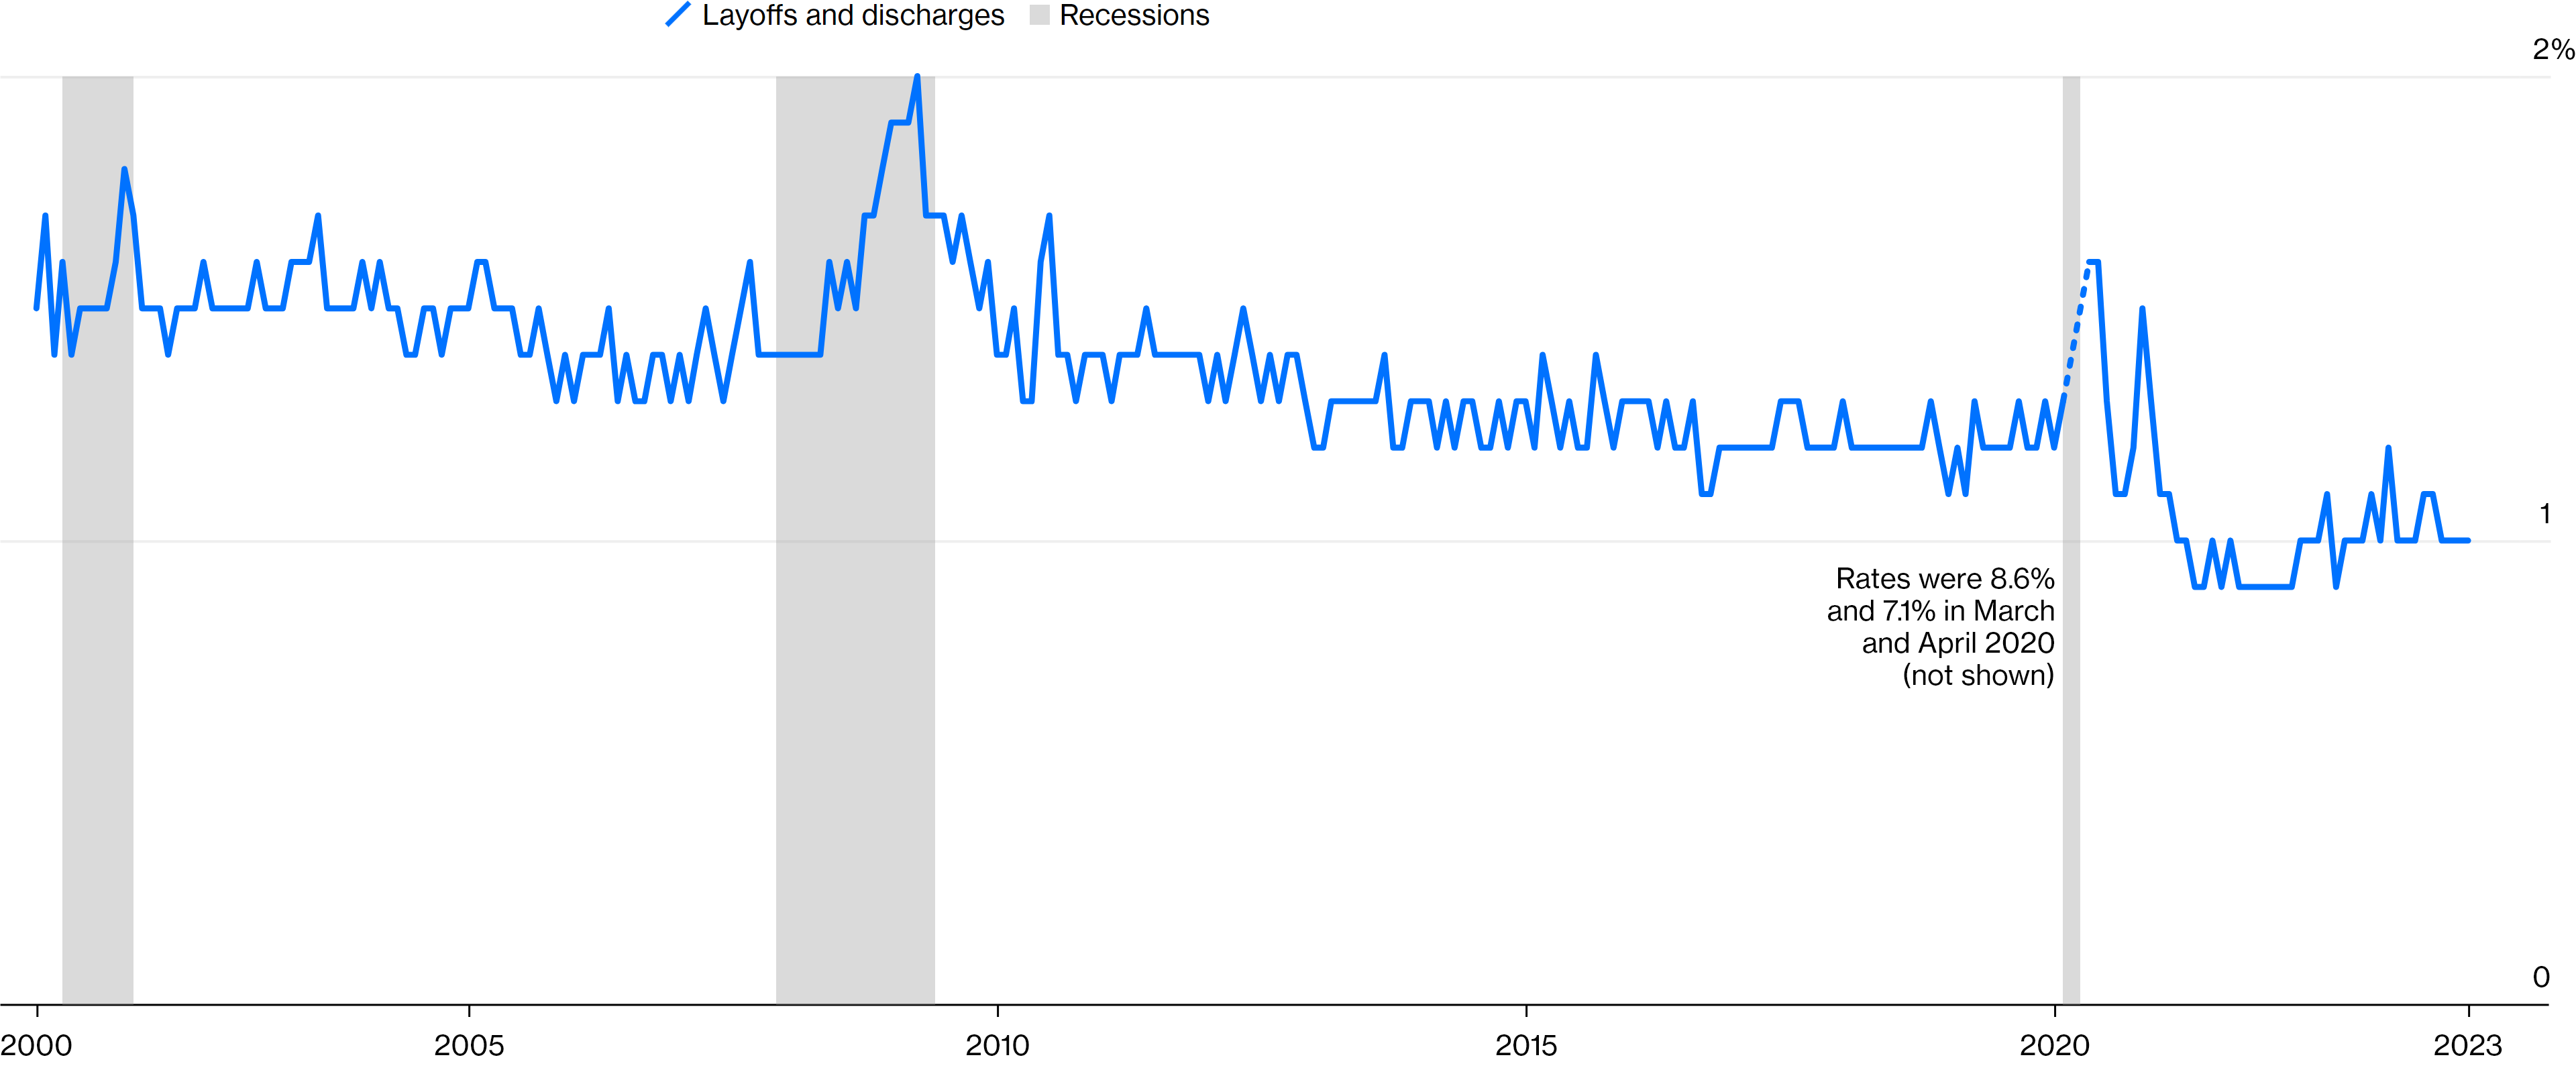
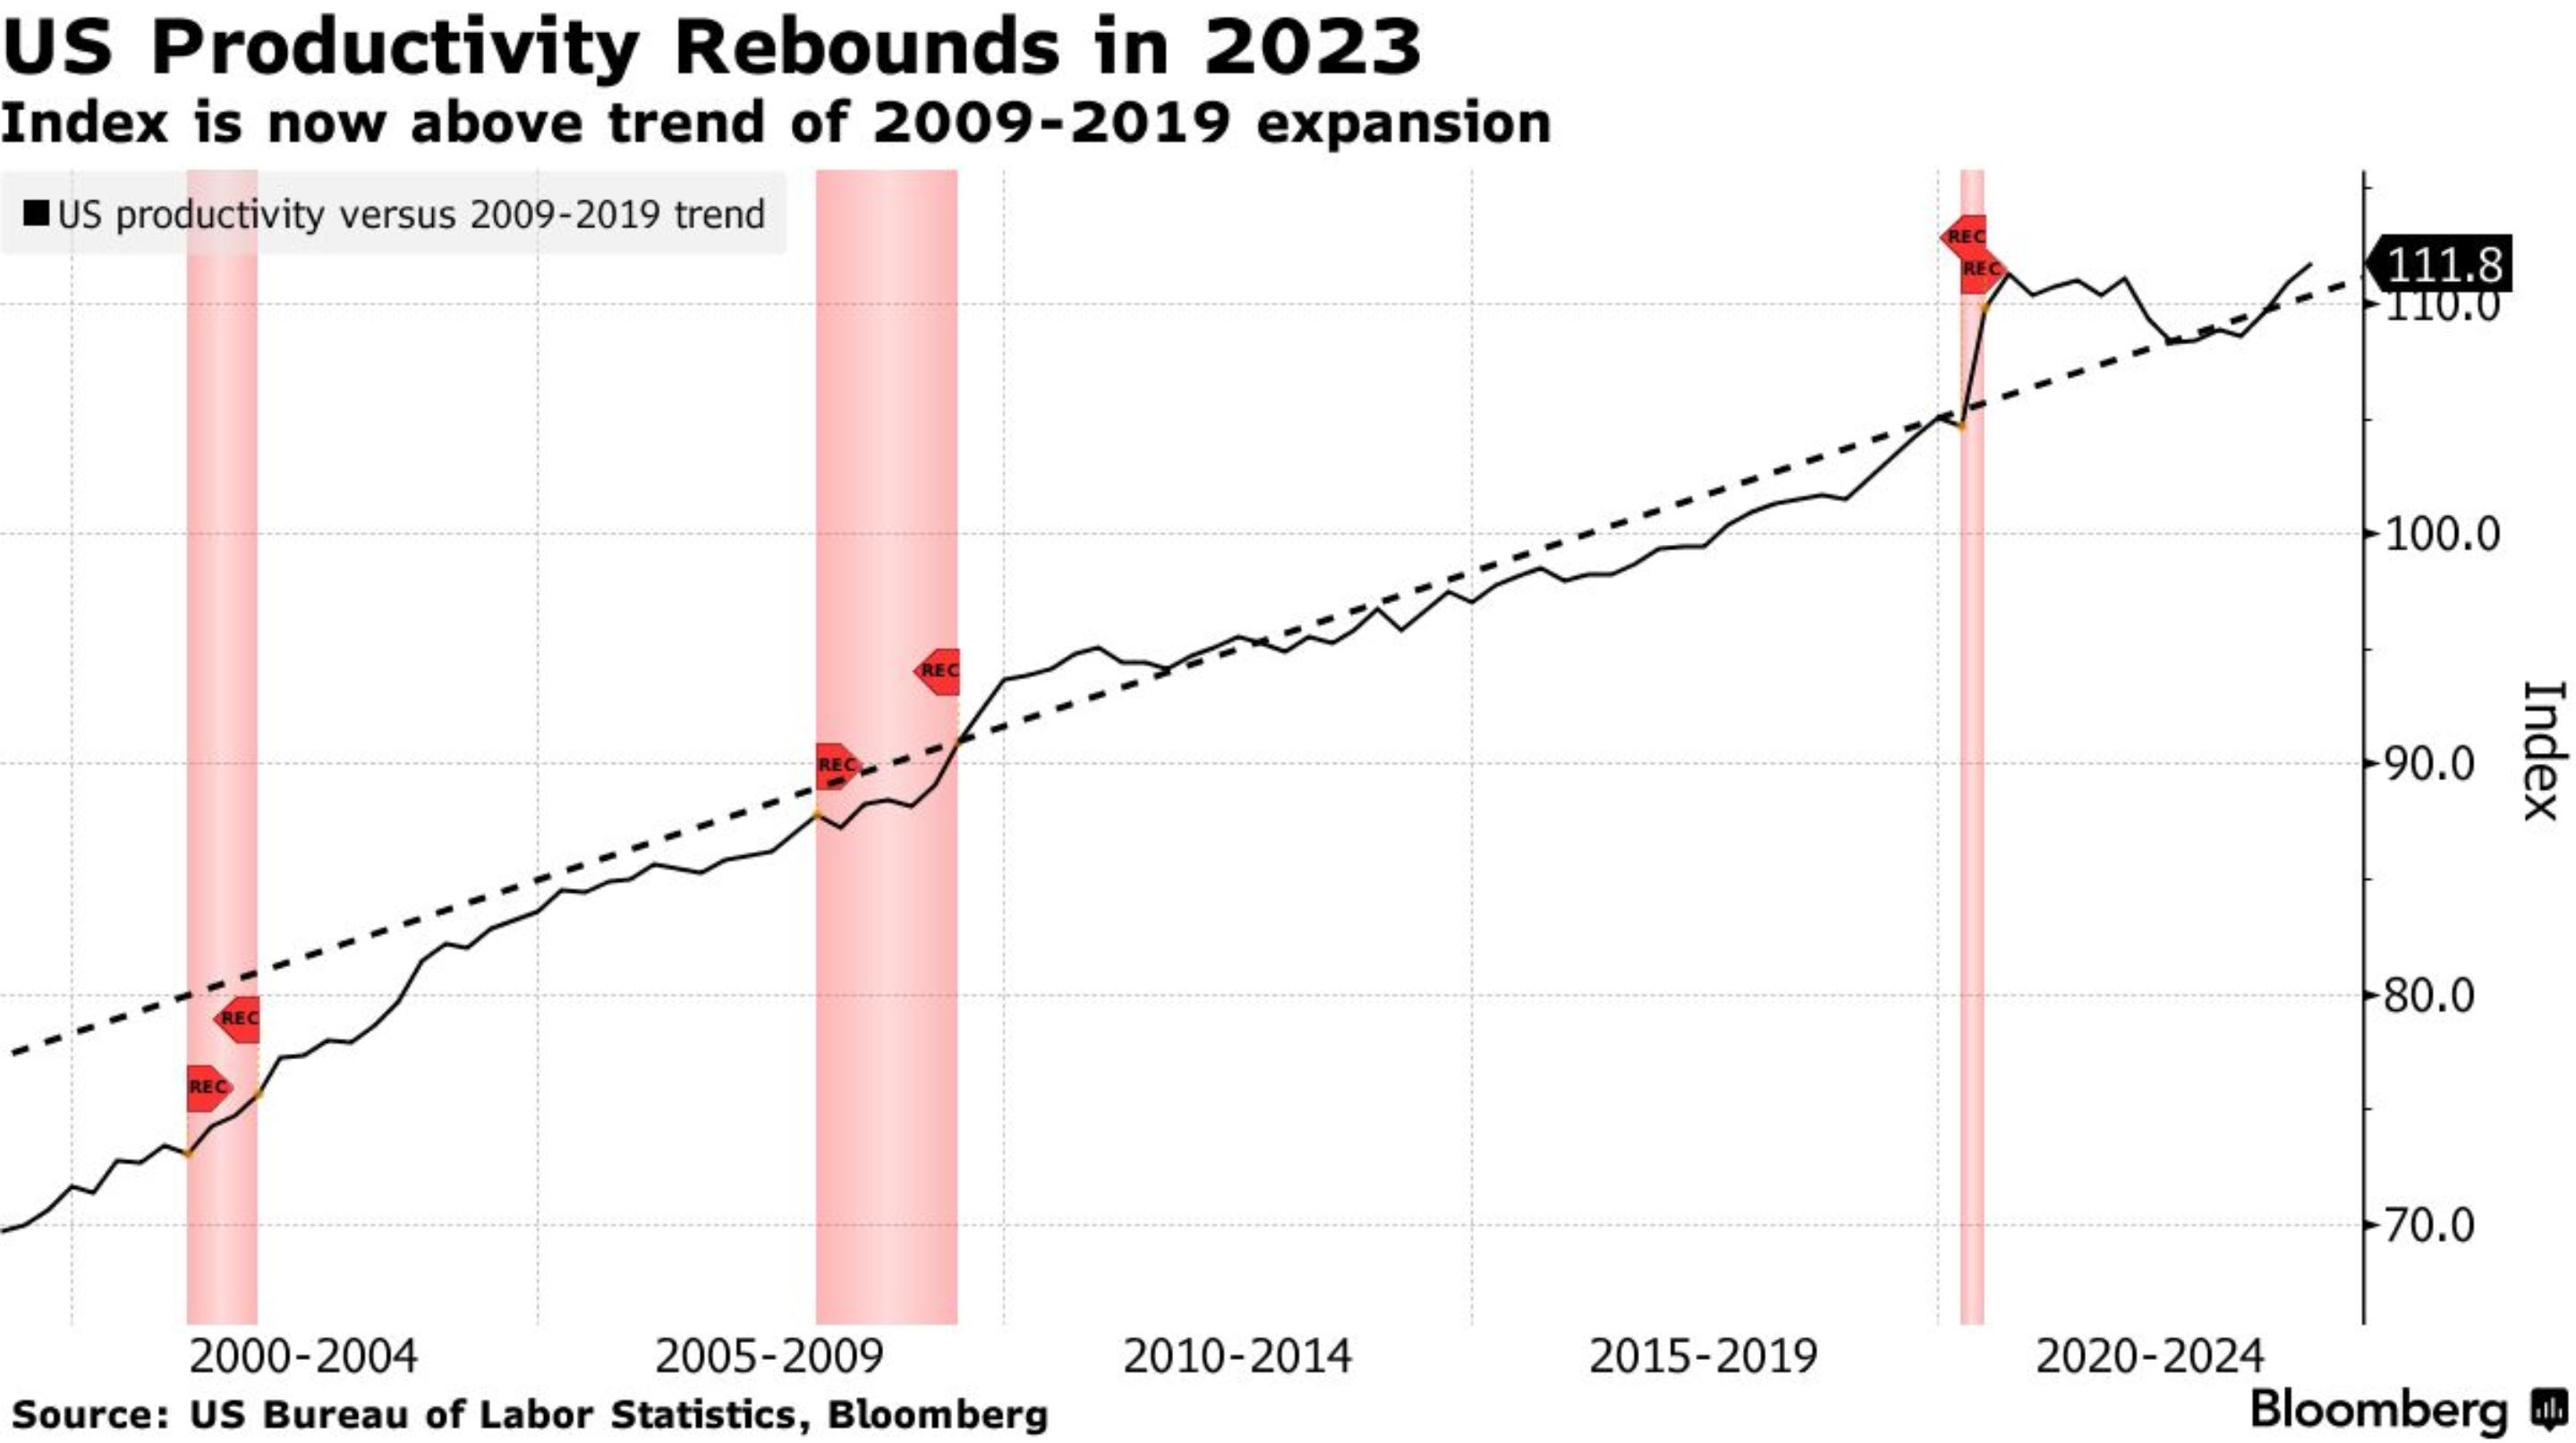
Figure 11. United States’ Productivity Rebound Shown In The Last Statistical Report.
Markets welcome the cost-cutting efforts by every company, tech sector (QQQ 0.00%↑ XLK 0.00%↑) in particular. Markets’ reaction to layoff-related announcements generates a two to three sigma spike on average in their stocks, but it really depends on the percentage that the workforce cut represents and how big the spread is between the pre-layoffs forward guidance and the post-layoffs forward guidance. The layoffs keep enhancing the tech sector’s (QQQ 0.00%↑ XLK 0.00%↑) stocks valuations; the only tech sector (QQQ 0.00%↑ XLK 0.00%↑) company that is lagged is Apple (AAPL 0.00%↑), which may have reached a point where consumers’ sensitivity to upward price changes in goods is elevated, making Apple’s (AAPL 0.00%↑) sales growth compressed, although relatively new technology development by Apple (AAPL 0.00%↑) with the AR/VR headset named Apple Vision Pro will likely enhance Apple’s (AAPL 0.00%↑) earnings as it would compete with Meta (Formerly The Facebook Company)’s (META 0.00%↑) AR/VR headset, which is mainly used for social media, and Microsoft’s (MSFT 0.00%↑) AR/VR headset, which is mainly used for industrial and military applications.
Figure 12. Year-Over-Year Change In Apple (AAPL 0.00%↑ ) Revenue Above 0 For The First Time Since The Fourth Quarter Of 2022.
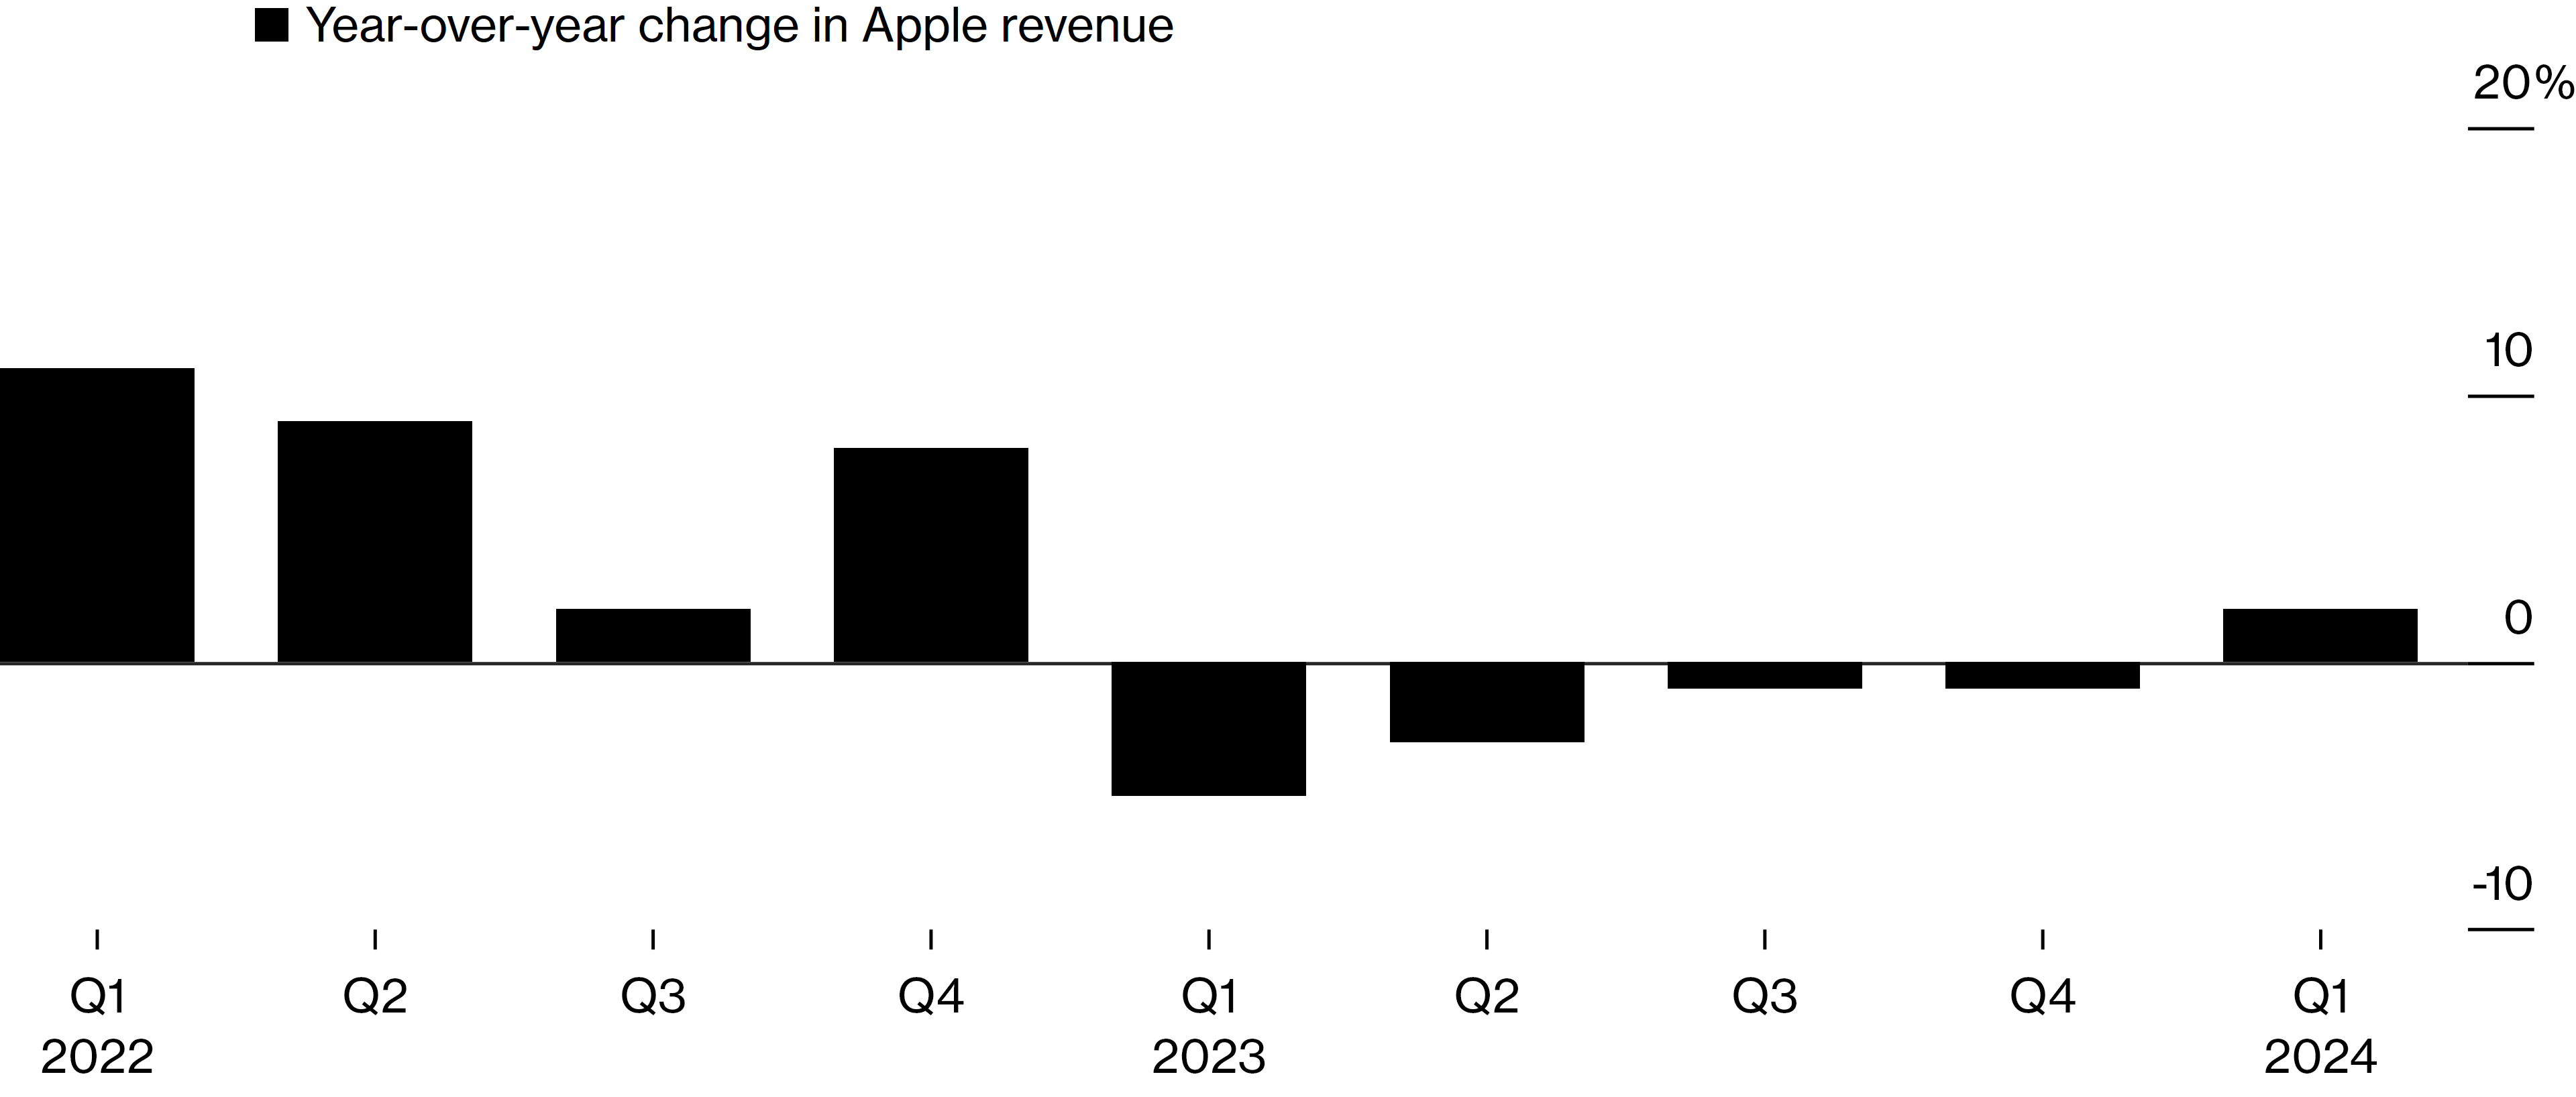
Figure 13. DB Gross US Tech Equity Futures ER Index.
[ Left Y-axis: Index data. (🟦) | Right Y-axis: Volatility of the index. (🟥) ]
![[ Left X-axis: Index data. (🟦) | Right X-axis: Volatility of the index. (🟥) ] | Data as of 02/09/2024 market close. |](https://substackcdn.com/image/fetch/f_auto,q_auto:good,fl_progressive:steep/https%3A%2F%2Fsubstack-post-media.s3.amazonaws.com%2Fpublic%2Fimages%2F3d9f6915-faa4-476d-aa29-d2b4ff1ee547_3801x1830.png "[ Left X-axis: Index data. (🟦) | Right X-axis: Volatility of the index. (🟥) ] | Data as of 02/09/2024 market close. |")
The weaponization of artificial intelligence has been enhancing semiconductors’ (SMH 0.00%↑) earnings growth since the first quarter of last year; that sector’s (SMH 0.00%↑) recent earnings growth is mainly attributed to China sales. A simple example is how ASML Holding’s (ASML 0.00%↑) earnings have been propped up by China sales, which now account for 39% of ASML Holding’s (ASML 0.00%↑) sales growth.
Figure 14. ASML Holding’s (ASML 0.00%↑) Sales Growth Adhered To China Since The Third Quarter Of 2023.

Markets (DIA 0.00%↑SPY 0.00%↑QQQ 0.00%↑) should be attentive to geopolitical developments, given the fact that, as mentioned before, China’s commitment towards reunifying Taiwan ( which is theirs ) was assured by China’s president during the New Year speech. China’s reunification of Taiwan would generate a recession, not only in Taiwan but a global recession, as pointed before in a tweet thread.
Figure 15. Taiwan War Global Gross Domestic Product (GDP) Impact Is Bigger Than The Global Financial Crisis Of 2008. Bigger Than The Impact Of The 2020 Pandemic & Bigger Than Current & Recent Geopolitical Conflicts/Events.

Figure 16. Two Scenarios To Keep In Mind.
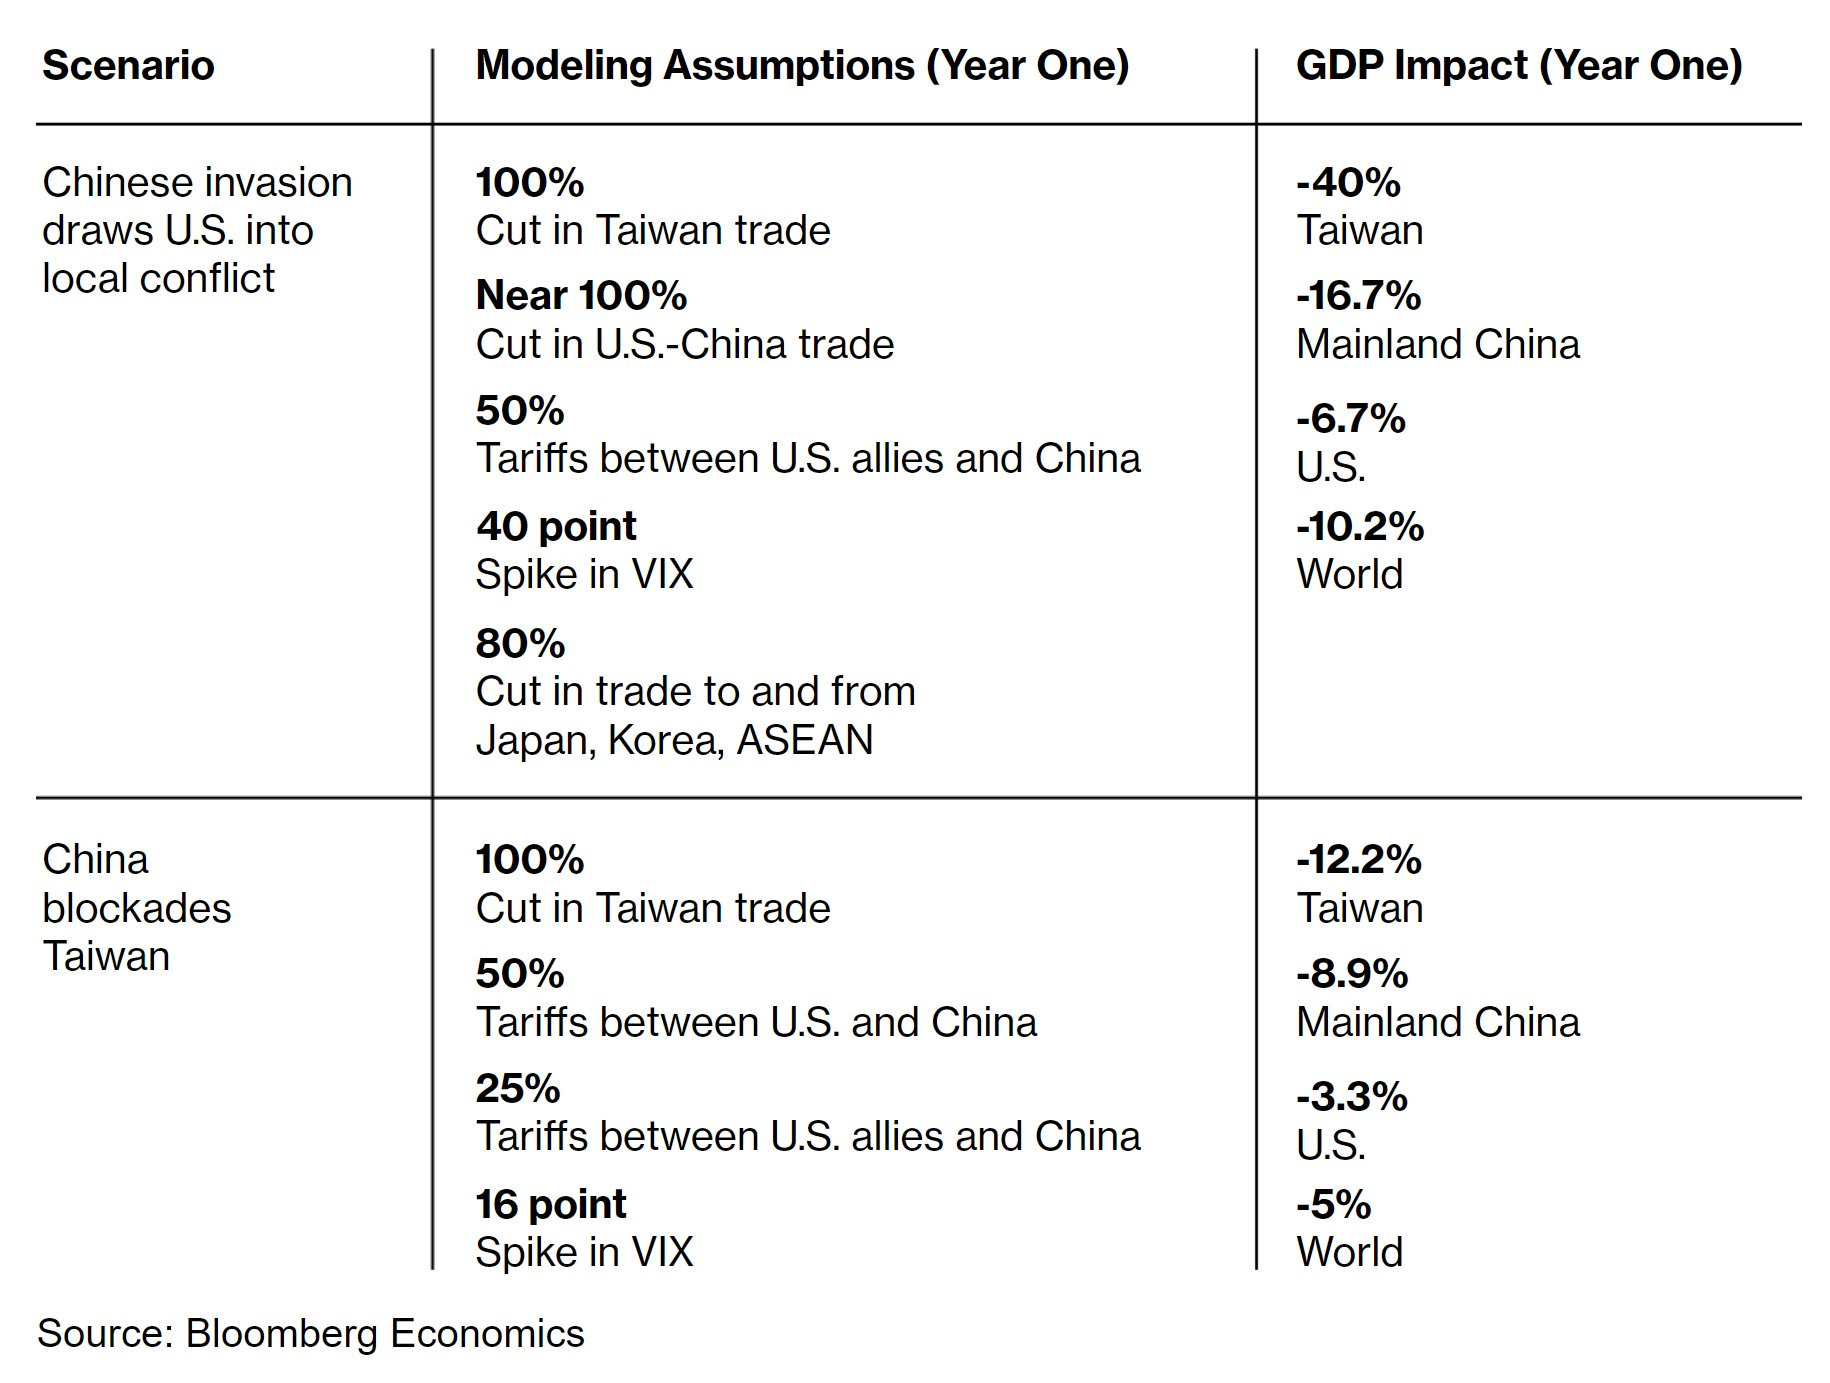
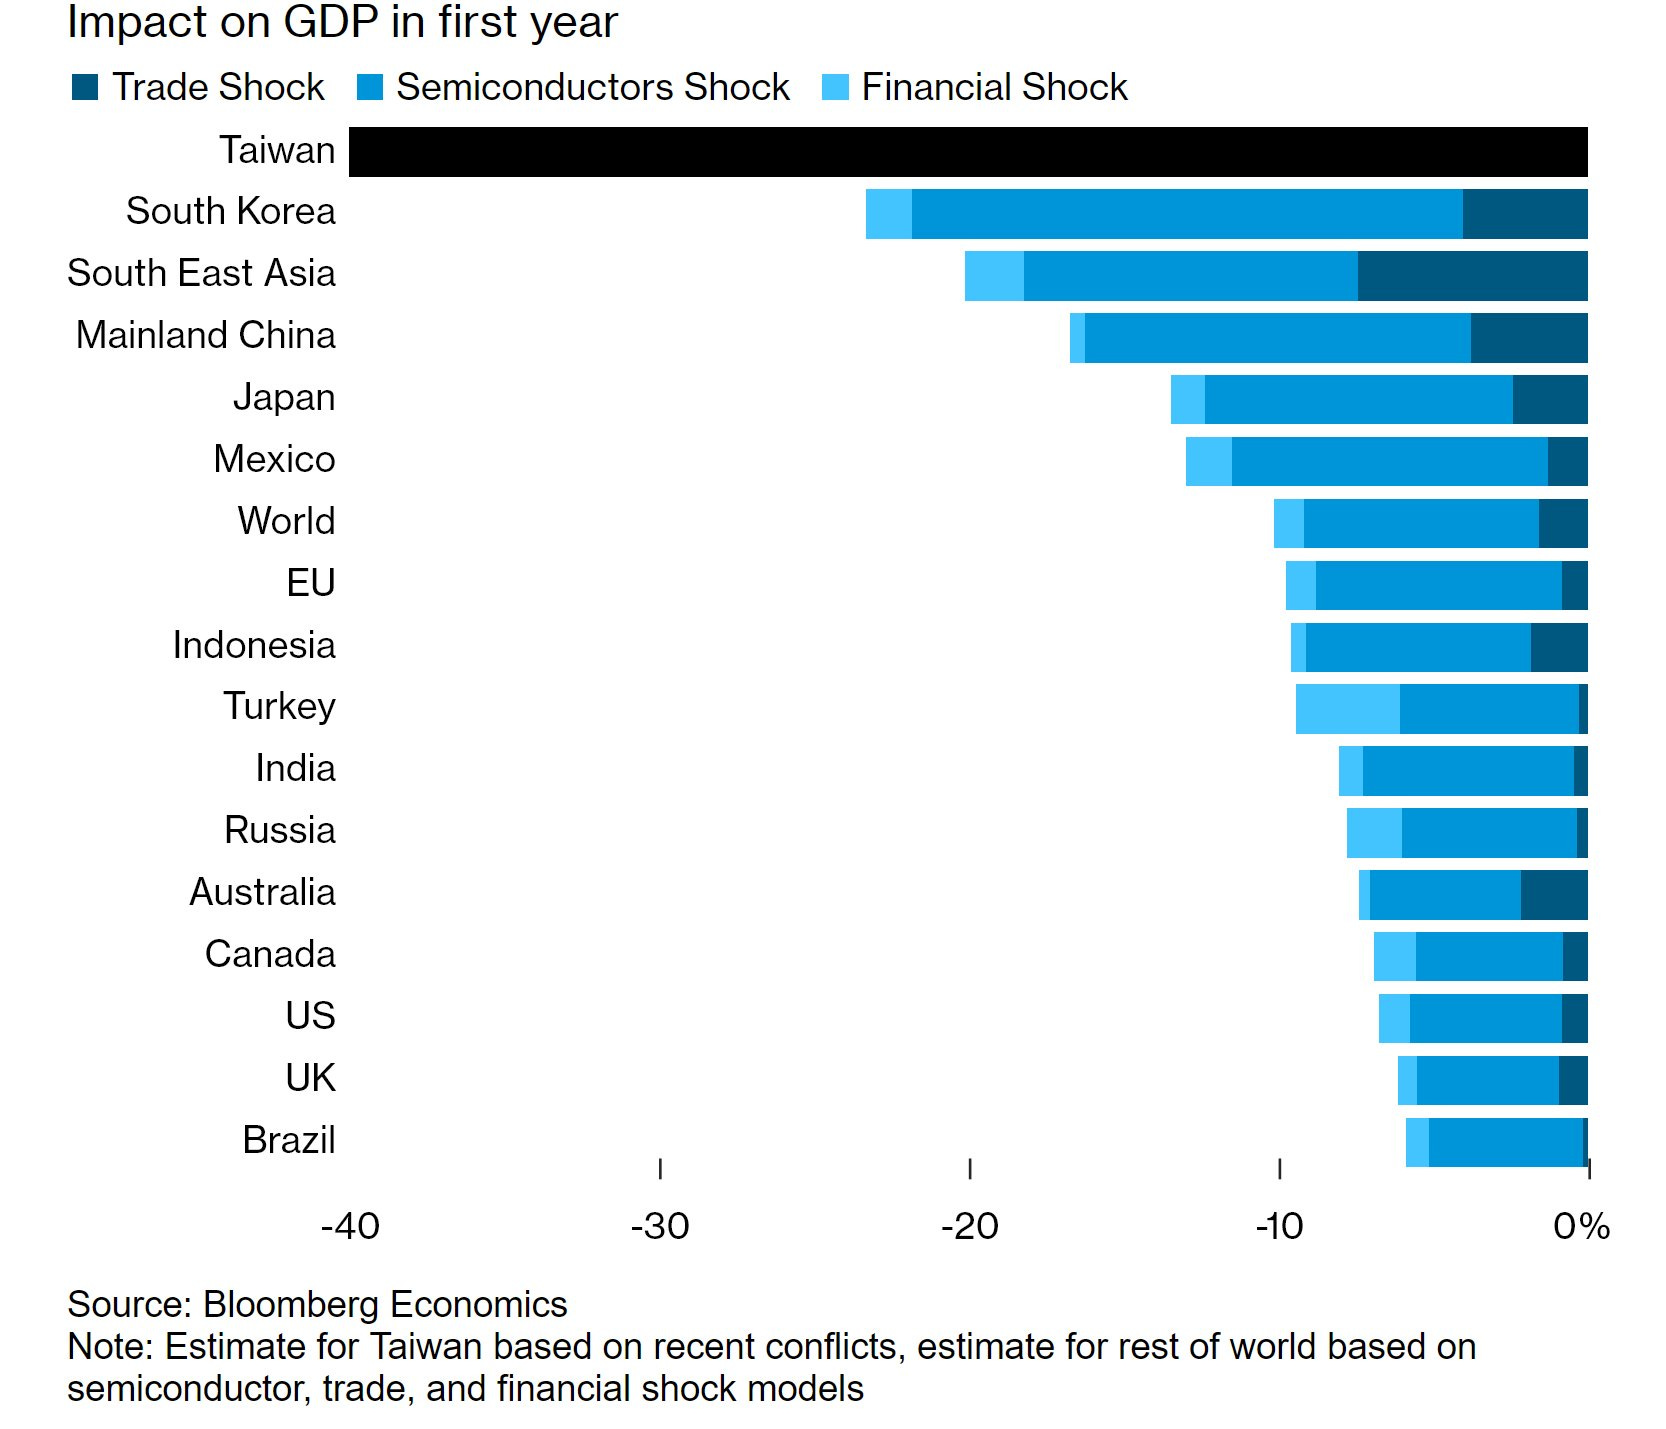
Figure 17. Countries’ Gross Domestic Product (GDP) Impact Of The Taiwan War.
Given the fact that the recent performance of the main semiconductor companies’ (SMH 0.00%↑) earnings growth has been adhered to sales to China and the geopolitical risk of inevitable geopolitical developments, the semiconductor sector’s (SMH 0.00%↑) companies with a high percentage of sales growth to China (ASML 0.00%↑) may face a big drawdown once the Taiwan War starts. The friendshoring and onshoring of production by the United States and the European Union have strengthened the long-run prospects of semiconductor sector production, but the semiconductor sector (SMH 0.00%↑) still relies on Taiwan’s semiconductor production; hence, the tech sector (QQQ 0.00%↑XLK 0.00%↑) is sensible and fragile to the inevitable geopolitical developments, as Taiwan semiconductor supply remains an Achilles heel. The fact that tech sector (QQQ 0.00%↑) performance is vectored mainly by eighteen stocks (NVDA 0.00%↑MSFT 0.00%↑META 0.00%↑AVGO 0.00%↑AMZN 0.00%↑AAPL 0.00%↑AMD 0.00%↑GOOGL 0.00%↑GOOG 0.00%↑ADBE 0.00%↑COST 0.00%↑NFLX 0.00%↑INTU 0.00%↑INTC 0.00%↑PANW 0.00%↑AMAT 0.00%↑LRCX 0.00%↑ISRG 0.00%↑), of which just eleven stocks (NVDA 0.00%↑MSFT 0.00%↑META 0.00%↑AVGO 0.00%↑AMZN 0.00%↑AAPL 0.00%↑AMD 0.00%↑GOOGL 0.00%↑GOOG 0.00%↑ADBE 0.00%↑COST 0.00%↑) account for more than a hundred basis points to tech sector (QQQ 0.00%↑) performance, makes the tech sector (QQQ 0.00%↑) even more fragile to the Taiwan War.
Figure 18. Eighteen Stocks Carry The Tech Sector’s (QQQ 0.00%↑) Performance, Of Which Just Eleven Stocks Account For More Than A Hundred Basis Points To Tech Sector’s (QQQ 0.00%↑) Performance.

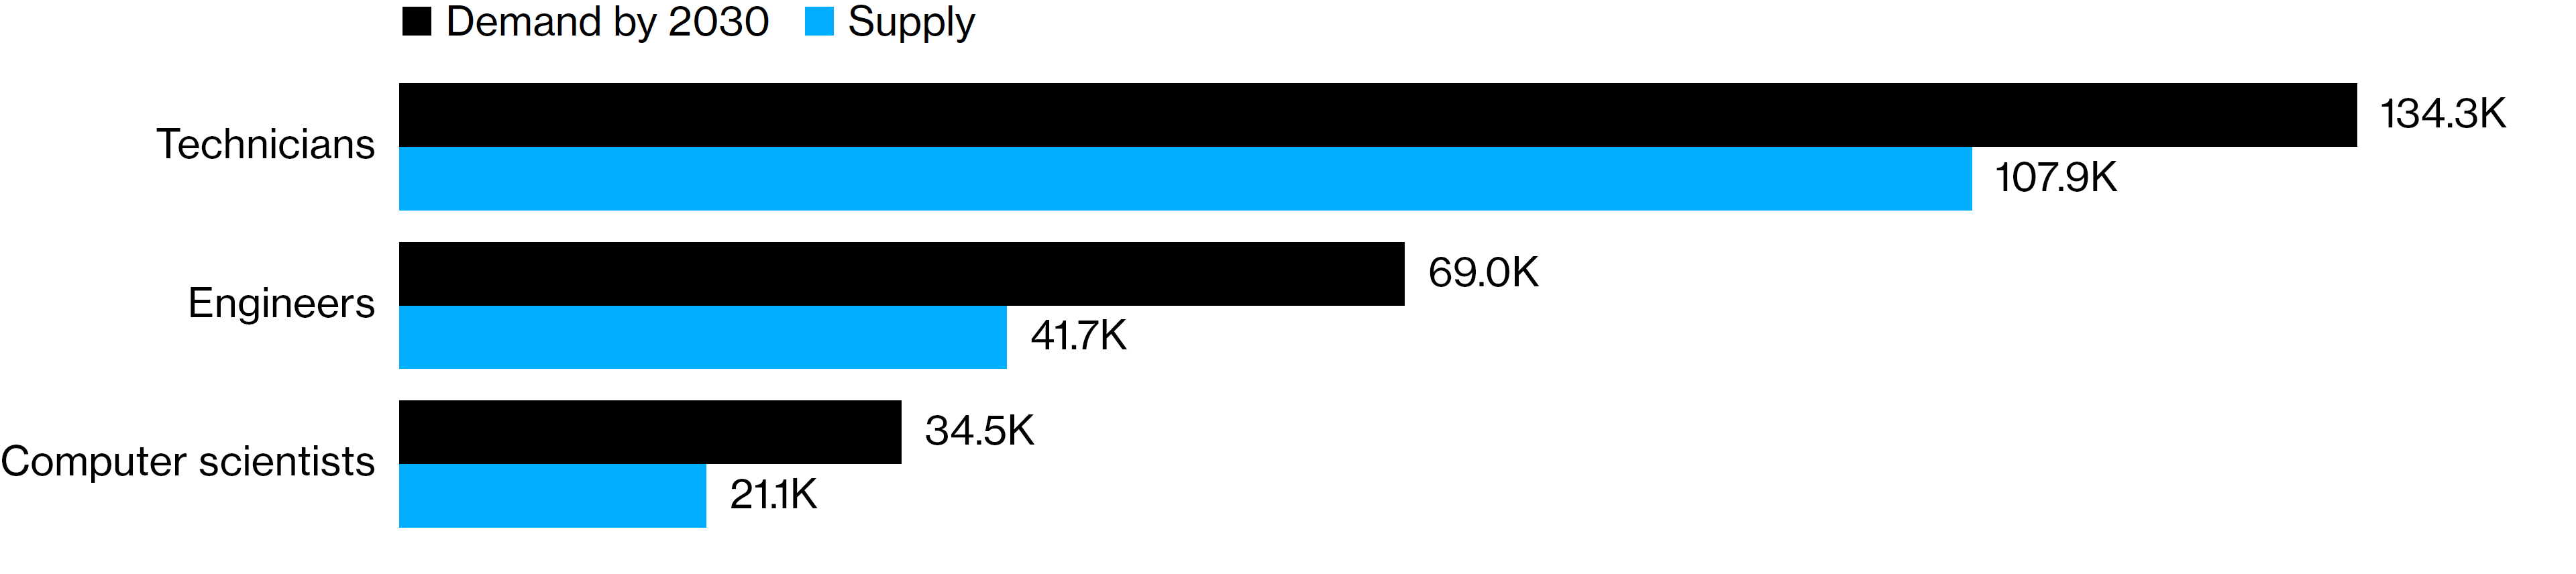
If you ask me, how do I hedge this? I’d tell you short Taiwan (FLTW 0.00%↑), as Taiwan is facing a 40% drawdown in their Gross Domestic Product (GDP) and consequently a long-term recession in that country. Tech sector (QQQ 0.00%↑) stocks face a 20% to 30% drawdown, which is a black swan that markets (DIA 0.00%↑SPY 0.00%↑QQQ 0.00%↑) should be attentive to given the total supply cut over the Taiwan War; but long-term prospects for the tech sector (QQQ 0.00%↑) are optimistic given the friendshoring and onshoring of production done by the United States and the European Union. I believe that the industrial sector (DIA 0.00%↑XLI 0.00%↑) will likely be benefited by the Taiwan War as the onshoring of production will likely be issued in the form of industrialization in order to ensure key stability as everything uses semiconductors ( as explained before ); this would likely make the United States recover from the consequential recession caused by the inevitable war. A concerning statistic to keep in mind is that there isn’t a sufficient supply of semiconductor experts in the United States to meet the demand for semiconductor experts by 2030, which will likely cause issues to the semiconductor sector (SMH 0.00%↑) in the long-run.
Figure 19. There Aren’t Enough Semiconductor Experts For 2030.
Geopolitics aside, when it comes to monetary policy, hawkishness is surging, which isn’t surprising as labor market strength lets the FOMC’s dual mandate be focused on price stability given the fact that inflation statistics haven’t reached the Federal Reserve’s price stability goal. Markets expect seven rate cuts by July 2025’s FOMC meeting, which is far more dovish than what the FOMC officials indicate in their stances and projections, although the spread between the market-priced rate path in the SOFR market and the FOMC target override is 0.060.
Figure 20. Markets Expect Seven Rate Cuts By July 2025’s FOMC Meeting.

Figure 21. Hawkishness Is Surging, Most Hawkish FOMC Bowman, Most Dovish FOMC Bostic.

If you ask me, what does this mean for markets? I’d tell you that these statistics and data indicate that monetary policy may differ from the market-priced stance and keep the rates at current levels until after FOMC officials are certain that inflation is at the Federal Reserve’s price stability goal. Powell’s stance is neutral; recent comments indicated that the Federal Reserve’s FOMC will likely wait beyond March 2024 in order to cut rates, as FOMC officials are looking for more statistics to confirm that inflation has reached the Federal Reserve’s price stability goal. For the moment, markets keep betting on the most optimistic outcome, which is the soft-landing path.
Figure 22. Deutsche Bank CROCI US Plus Index Total Return.
[ Left Y-axis: Index data. (🟦) | Right Y-axis: Volatility of the index. (🟥) ]
![[ Left X-axis: Index data. (🟦) | Right X-axis: Volatility of the index. (🟥) ] | Data as of 02/09/2024 market close. |](https://substackcdn.com/image/fetch/f_auto,q_auto:good,fl_progressive:steep/https%3A%2F%2Fsubstack-post-media.s3.amazonaws.com%2Fpublic%2Fimages%2Faade6aa0-ac9e-4fce-8ea3-6fa4c5e7be72_3804x1910.png "[ Left X-axis: Index data. (🟦) | Right X-axis: Volatility of the index. (🟥) ] | Data as of 02/09/2024 market close. |")
Figure 23. Deutsche Bank CROCI US 5% Vol. Control Index.
[ Left Y-axis: Index data. (🟦) | Right Y-axis: Volatility of the index. (🟥) ]
![[ Left X-axis: Index data. (🟦) | Right X-axis: Volatility of the index. (🟥) ] | Data as of 02/09/2024 market close. |](https://substackcdn.com/image/fetch/f_auto,q_auto:good,fl_progressive:steep/https%3A%2F%2Fsubstack-post-media.s3.amazonaws.com%2Fpublic%2Fimages%2Fb8bac68d-47f2-498c-a844-ab6455b0bcdb_3798x1925.png "[ Left X-axis: Index data. (🟦) | Right X-axis: Volatility of the index. (🟥) ] | Data as of 02/09/2024 market close. |")
If you ask me, what should I be attentive to? I’d tell you to be attentive to next week’s inflation data release and attentive to the FOMC officials’ speeches before the FOMC Minutes release the week after.
Figure 24. Next Two Week’s Data Release Expectations.
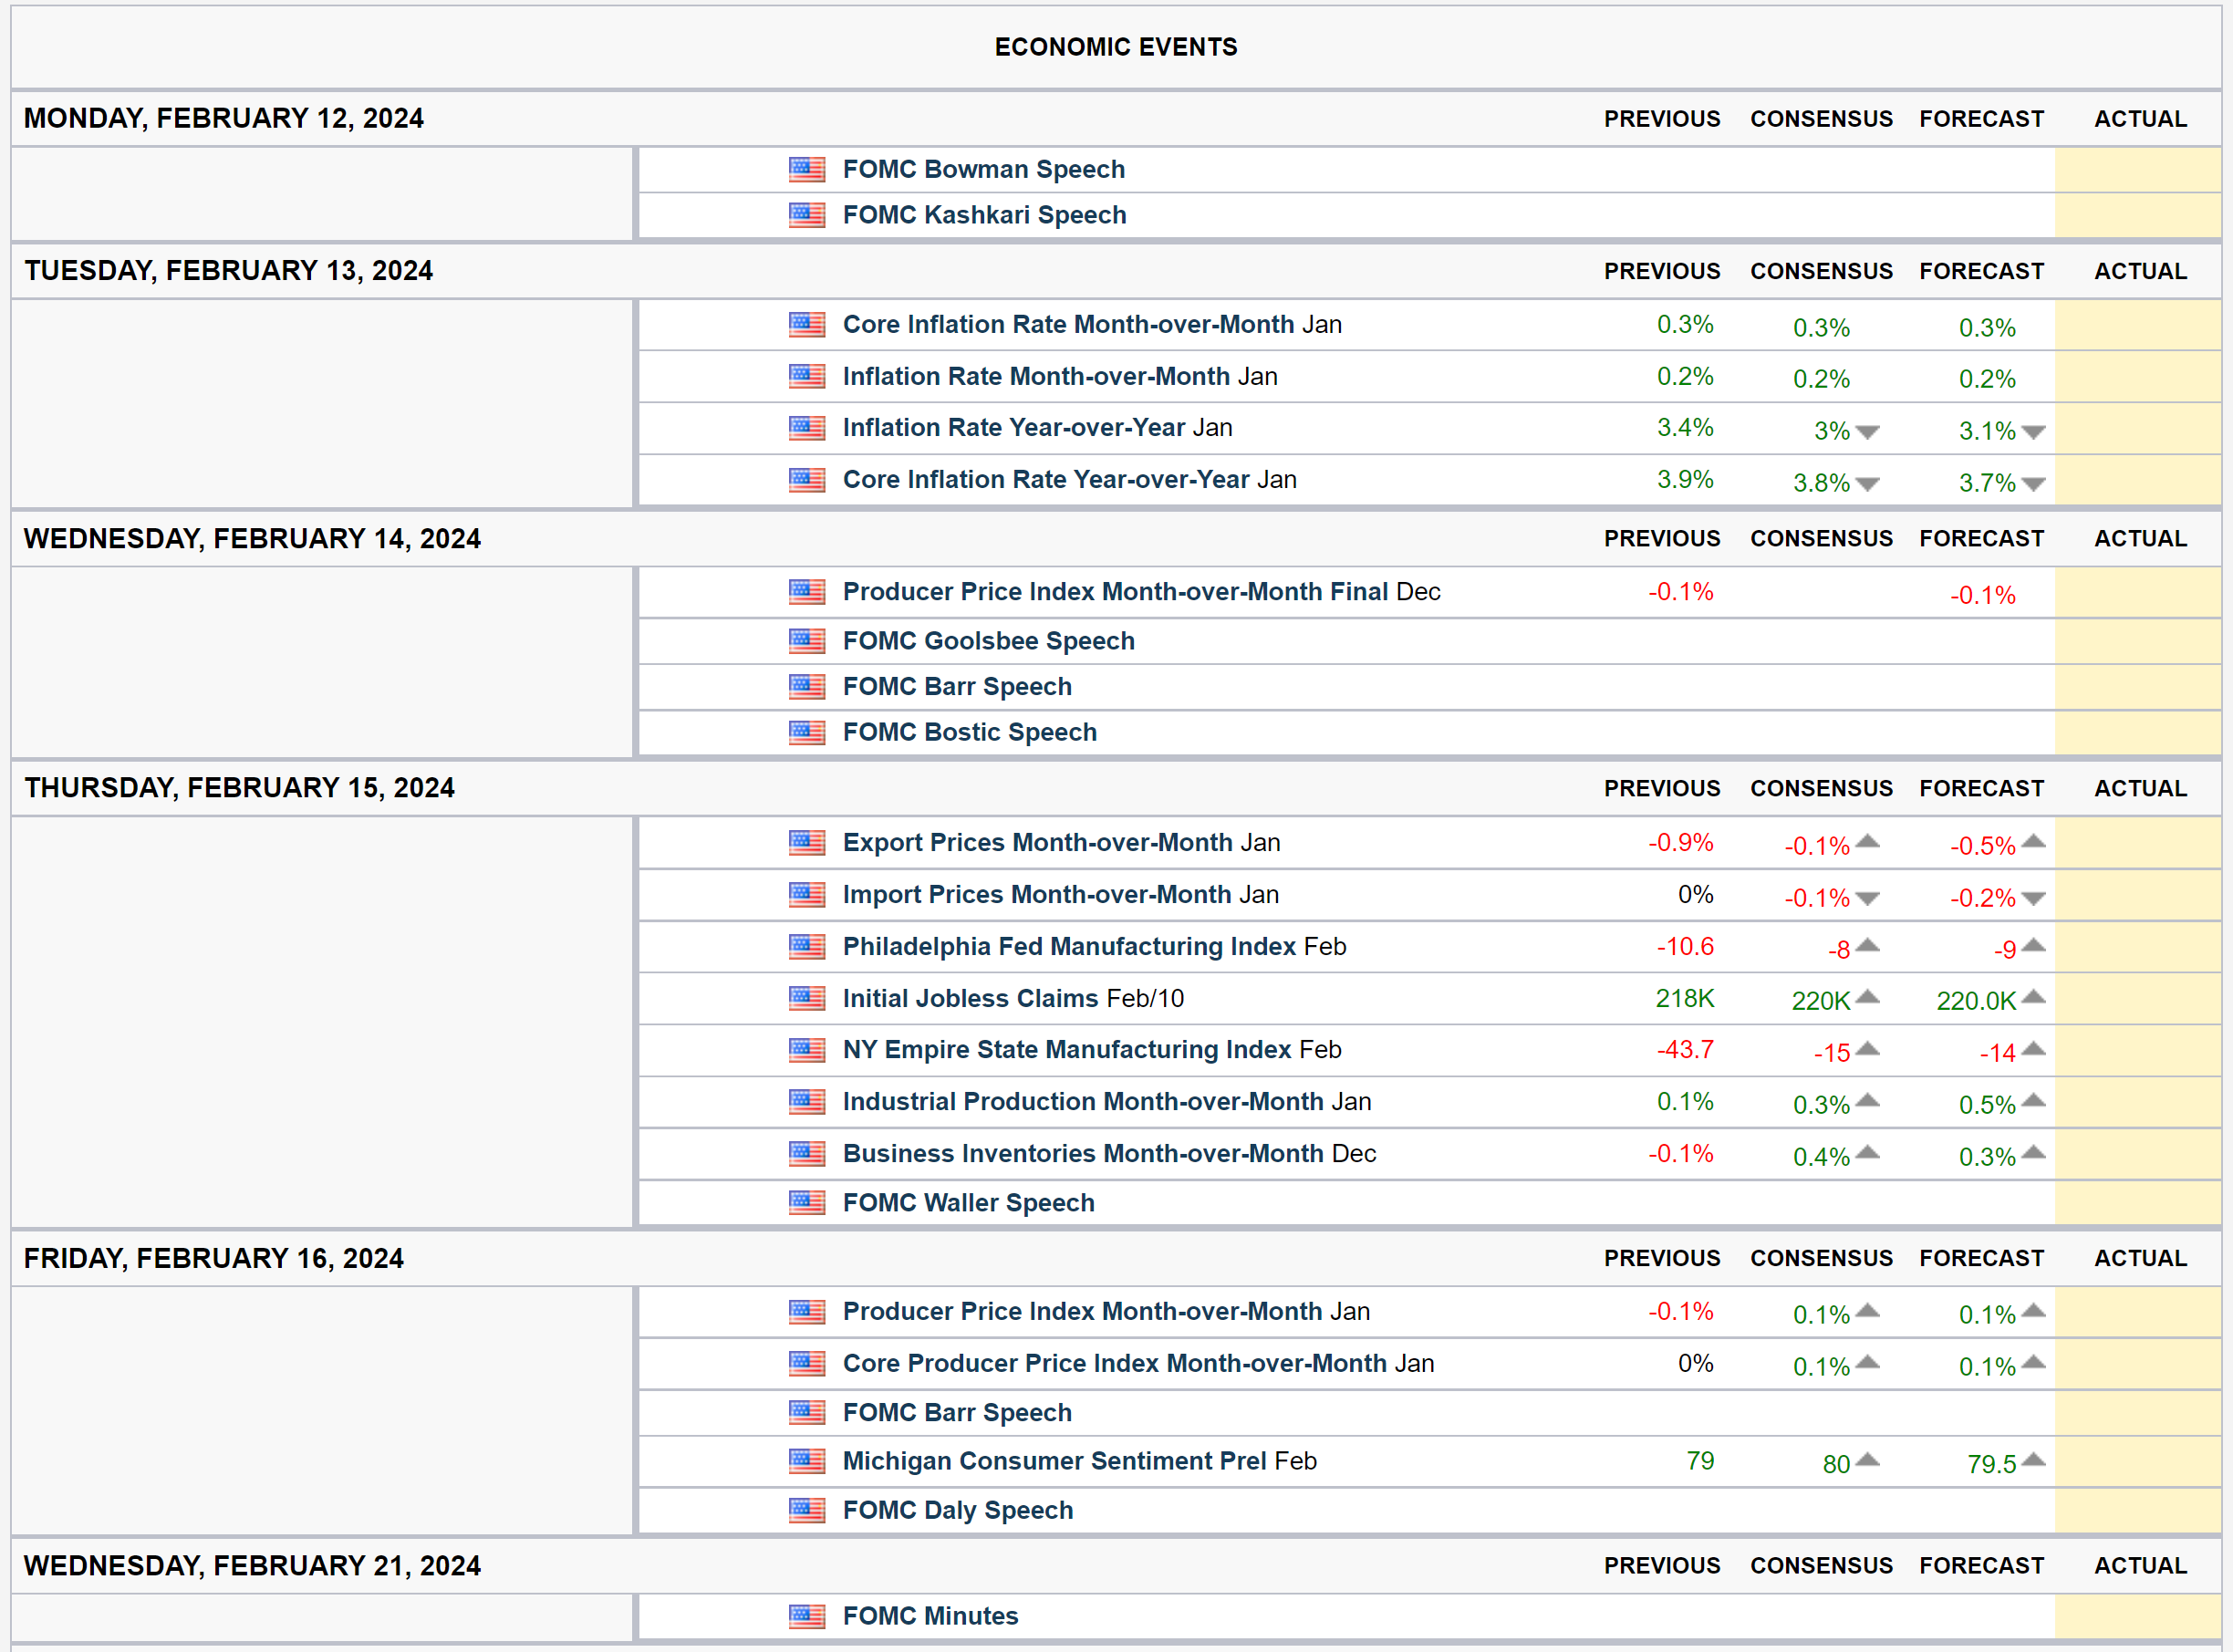
If inflation data is higher than expectations, yields (TTT 0.00%↑) and the dollar (UUP 0.00%↑) should rise, and markets (DIA 0.00%↑SPY 0.00%↑QQQ 0.00%↑TLT 0.00%↑) should lower; if inflation data is lower than expectations, yields (TTT 0.00%↑) and the dollar (UUP 0.00%↑) should lower, and markets (DIA 0.00%↑SPY 0.00%↑QQQ 0.00%↑TLT 0.00%↑) should rise. Given the fact that monetary policy is data-dependent, the next inflation data release will likely skew the forward monetary policy stance. If inflation data is higher than expectations, a hawkish stance should be expected; if inflation data is lower than expectations, a dovish stance should be expected; if jobless claims data is higher than expectations, a dovish stance should be expected; if jobless claims data is lower than expectations, a hawkish stance should be expected. If hawkish, yields (TTT 0.00%↑) and the dollar (UUP 0.00%↑) should rise, and markets (DIA 0.00%↑SPY 0.00%↑QQQ 0.00%↑TLT 0.00%↑) should lower; if dovish, yields (TTT 0.00%↑) and the dollar (UUP 0.00%↑) should lower, and markets (DIA 0.00%↑SPY 0.00%↑QQQ 0.00%↑TLT 0.00%↑) should rise.
Europe:
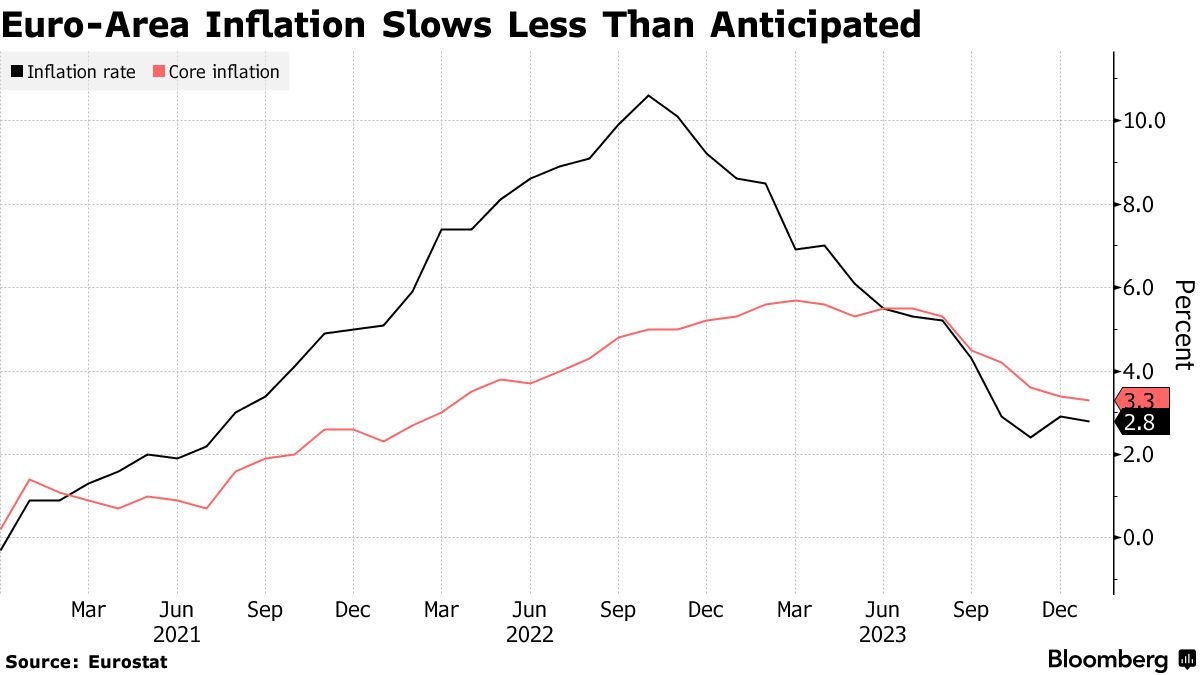
The Euro-Zone economy is performing better than economists' expectations; the record low unemployment rate and the continuing improvements in inflation statistics, which are nearing the European Central Bank’s price stability goal, keep the Euro-Zone long-term prospects stable.
Figure 25. Record Low Unemployment Rate.
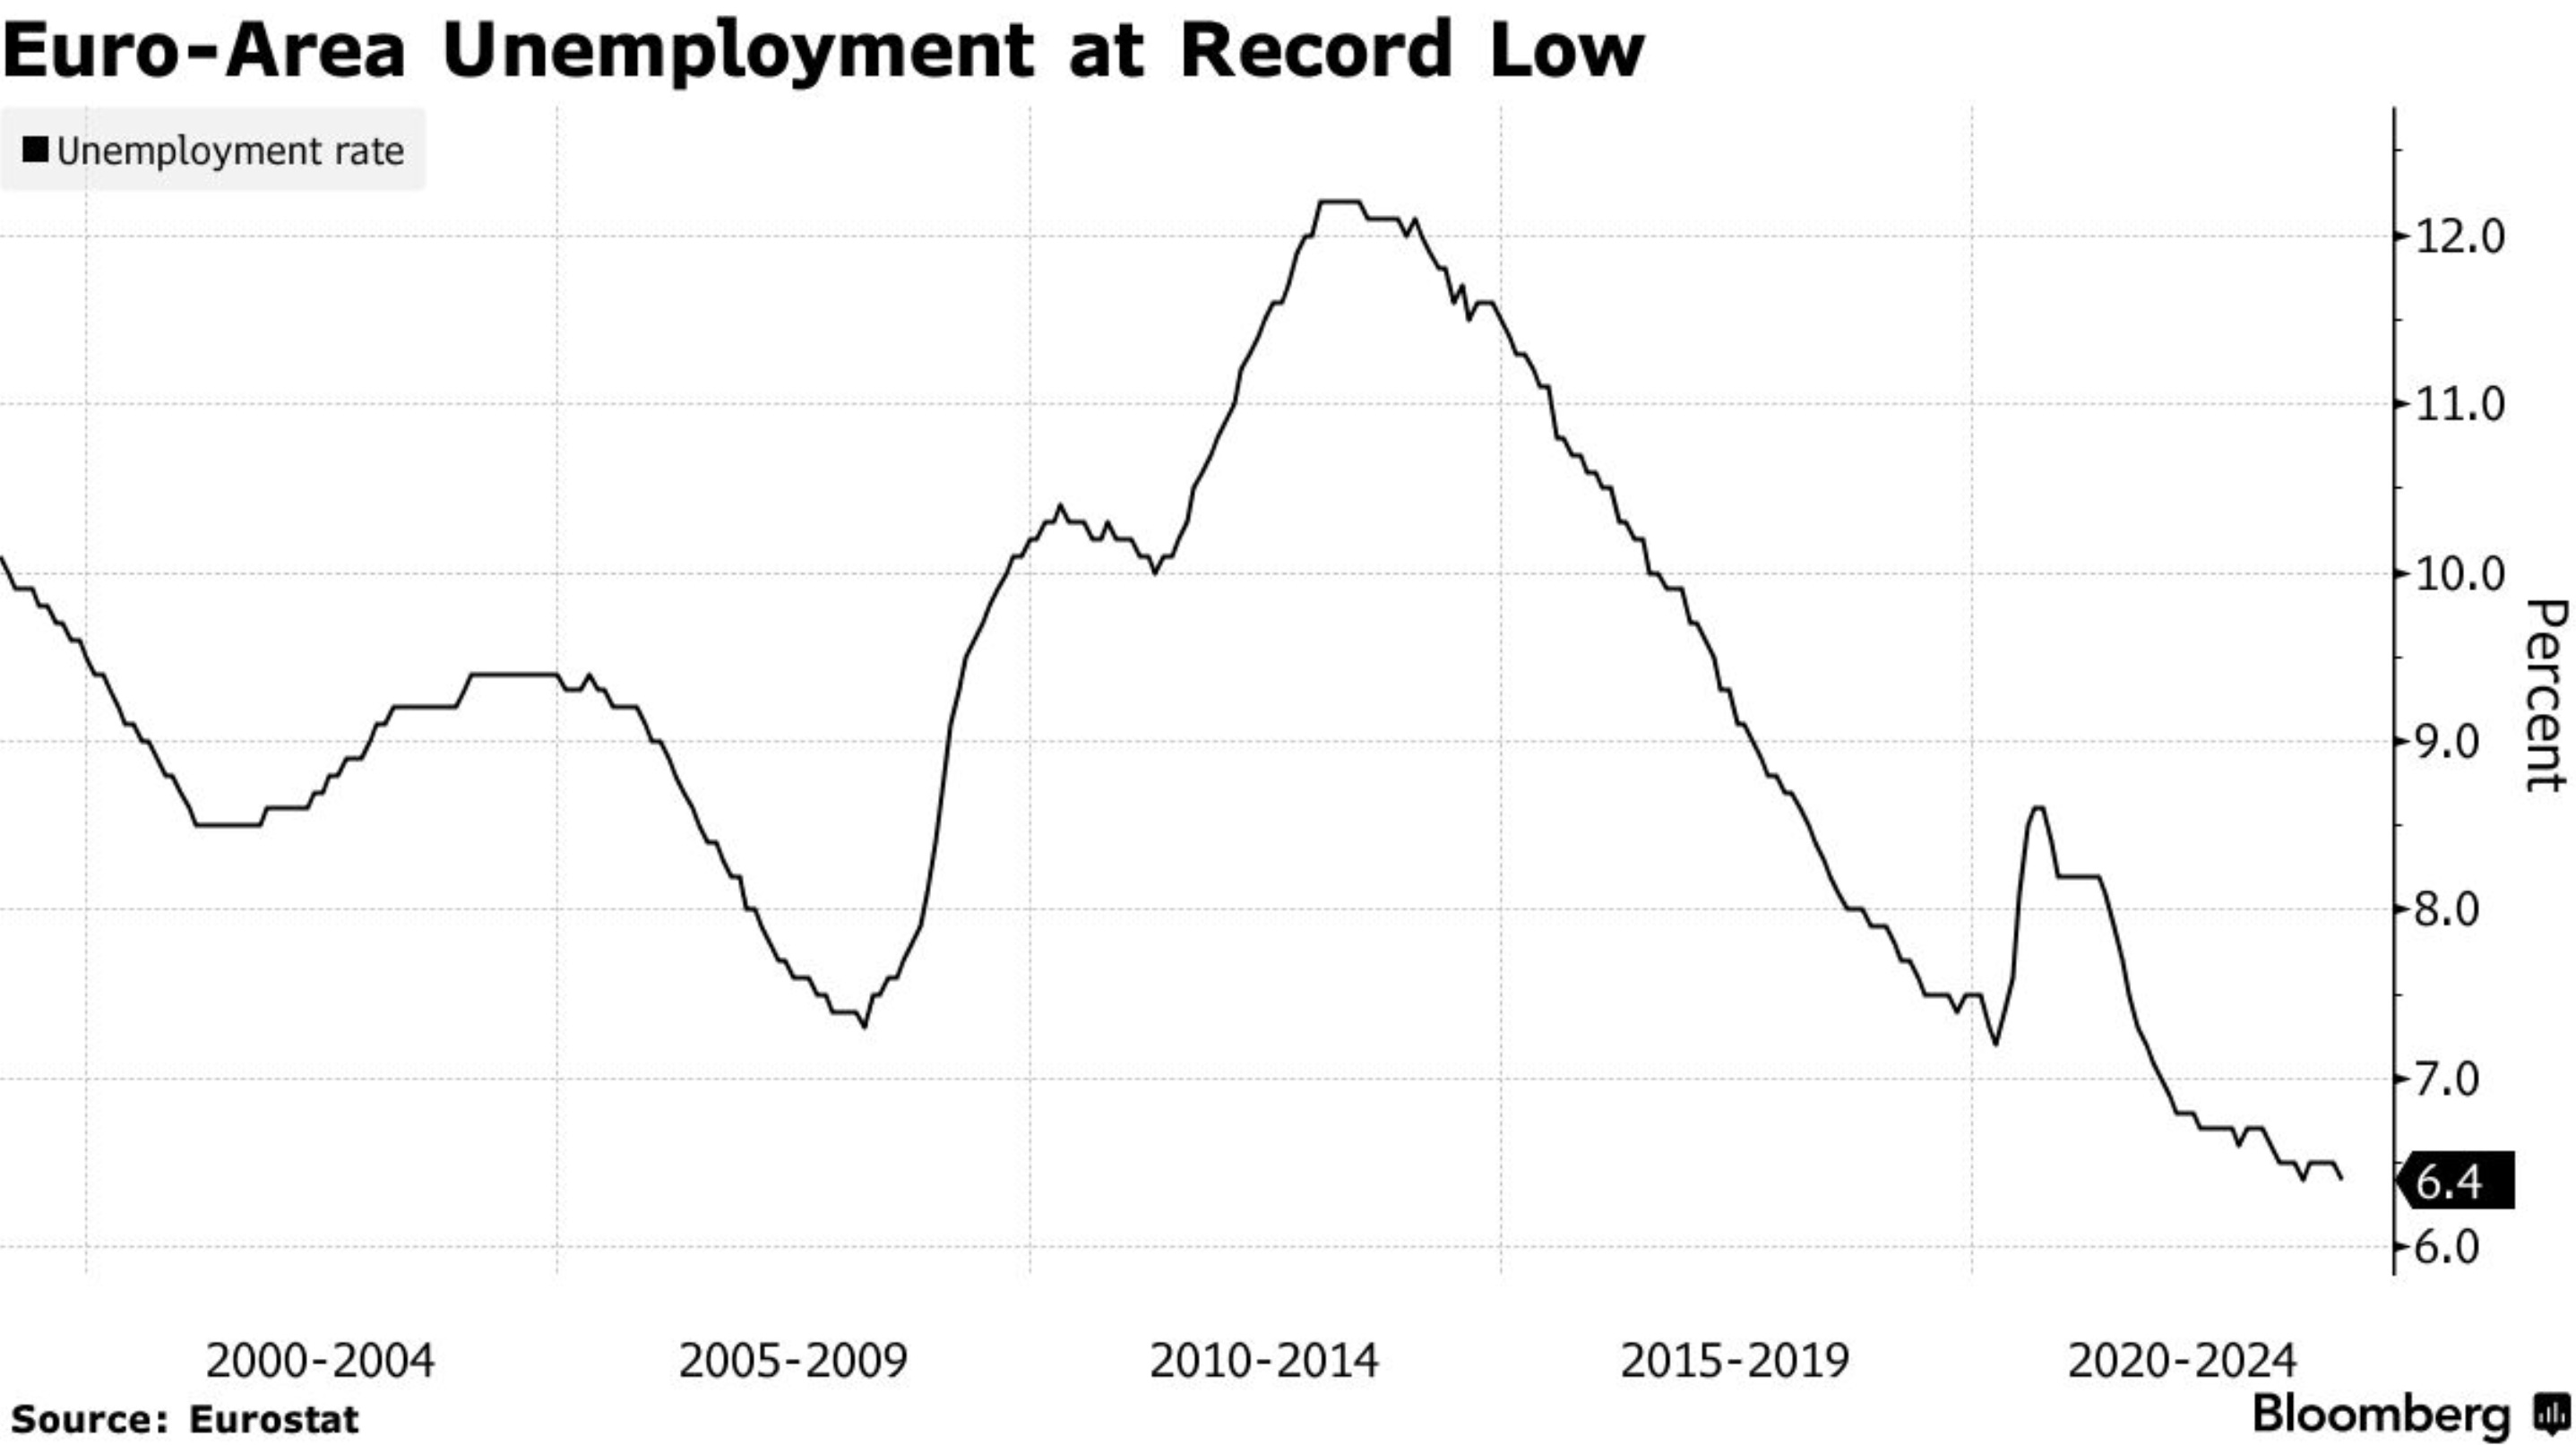
Figure 26. Most Euro-Zone Countries Still Have Inflation Higher Than The European Central Bank's Price Stability Goal.
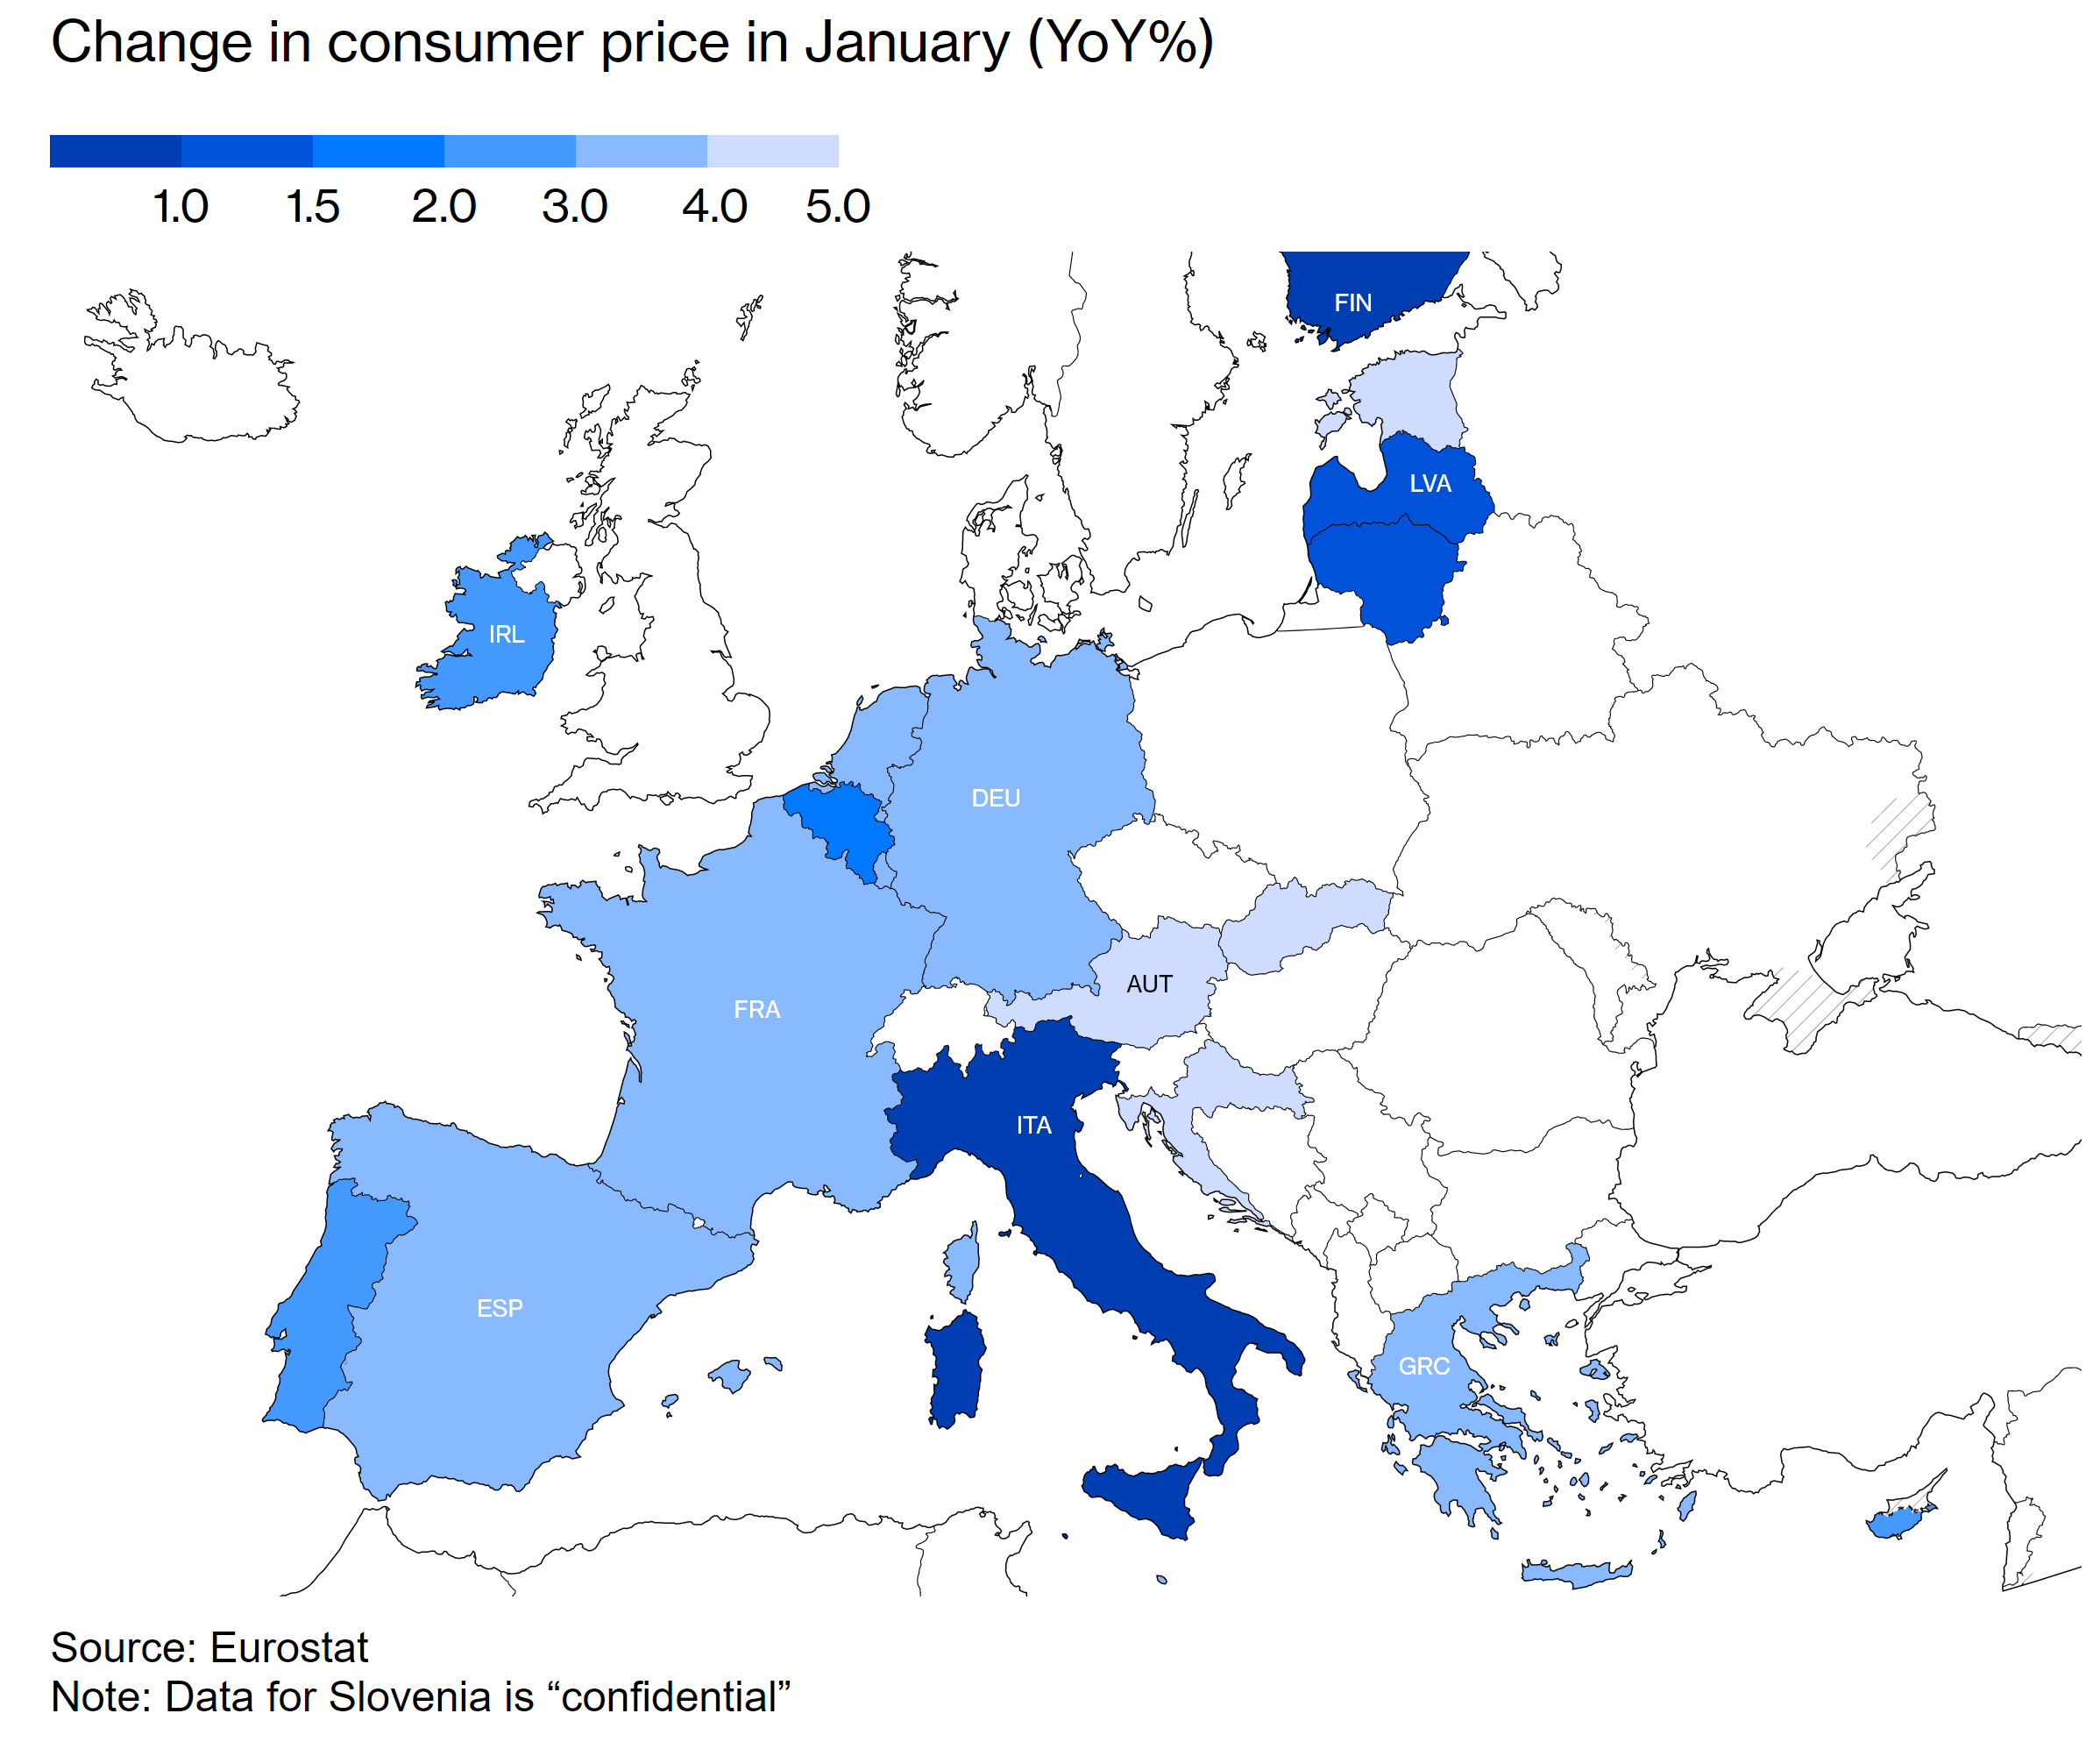
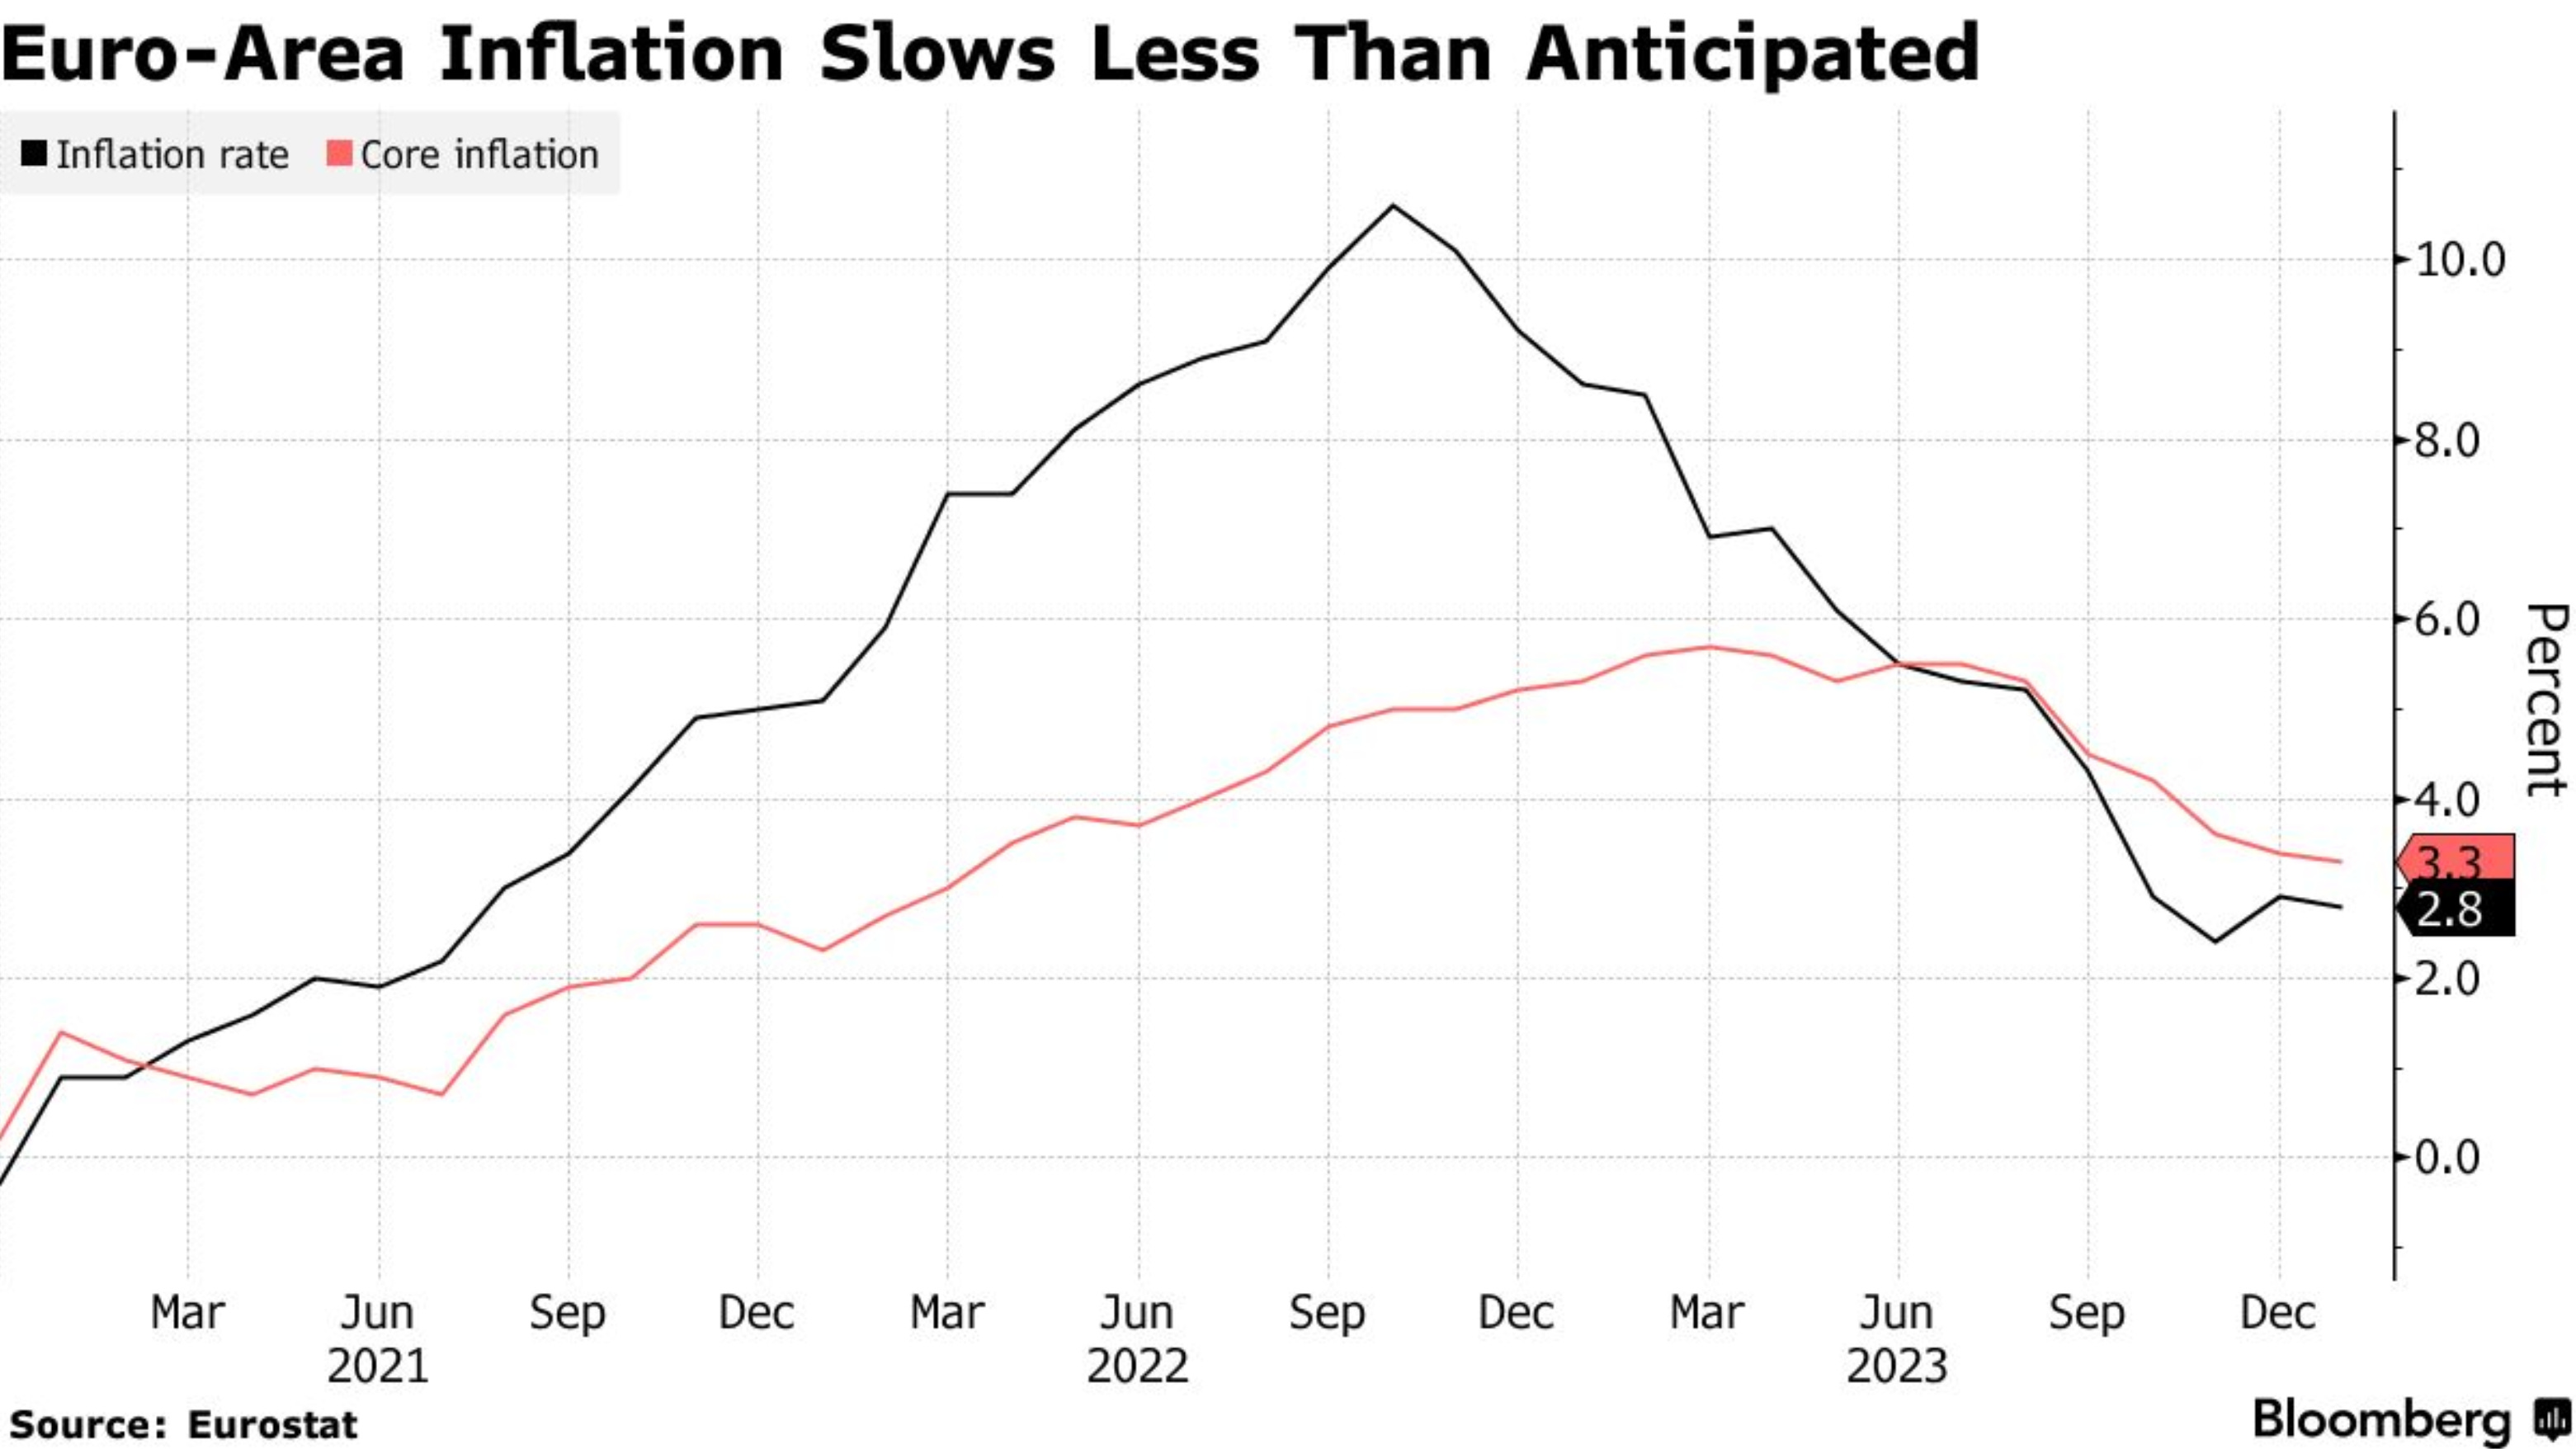
Figure 27. Euro-Area Inflation Is Almost At The European Central Bank's Price Stability Goal, But Slows Less Than Anticipated.
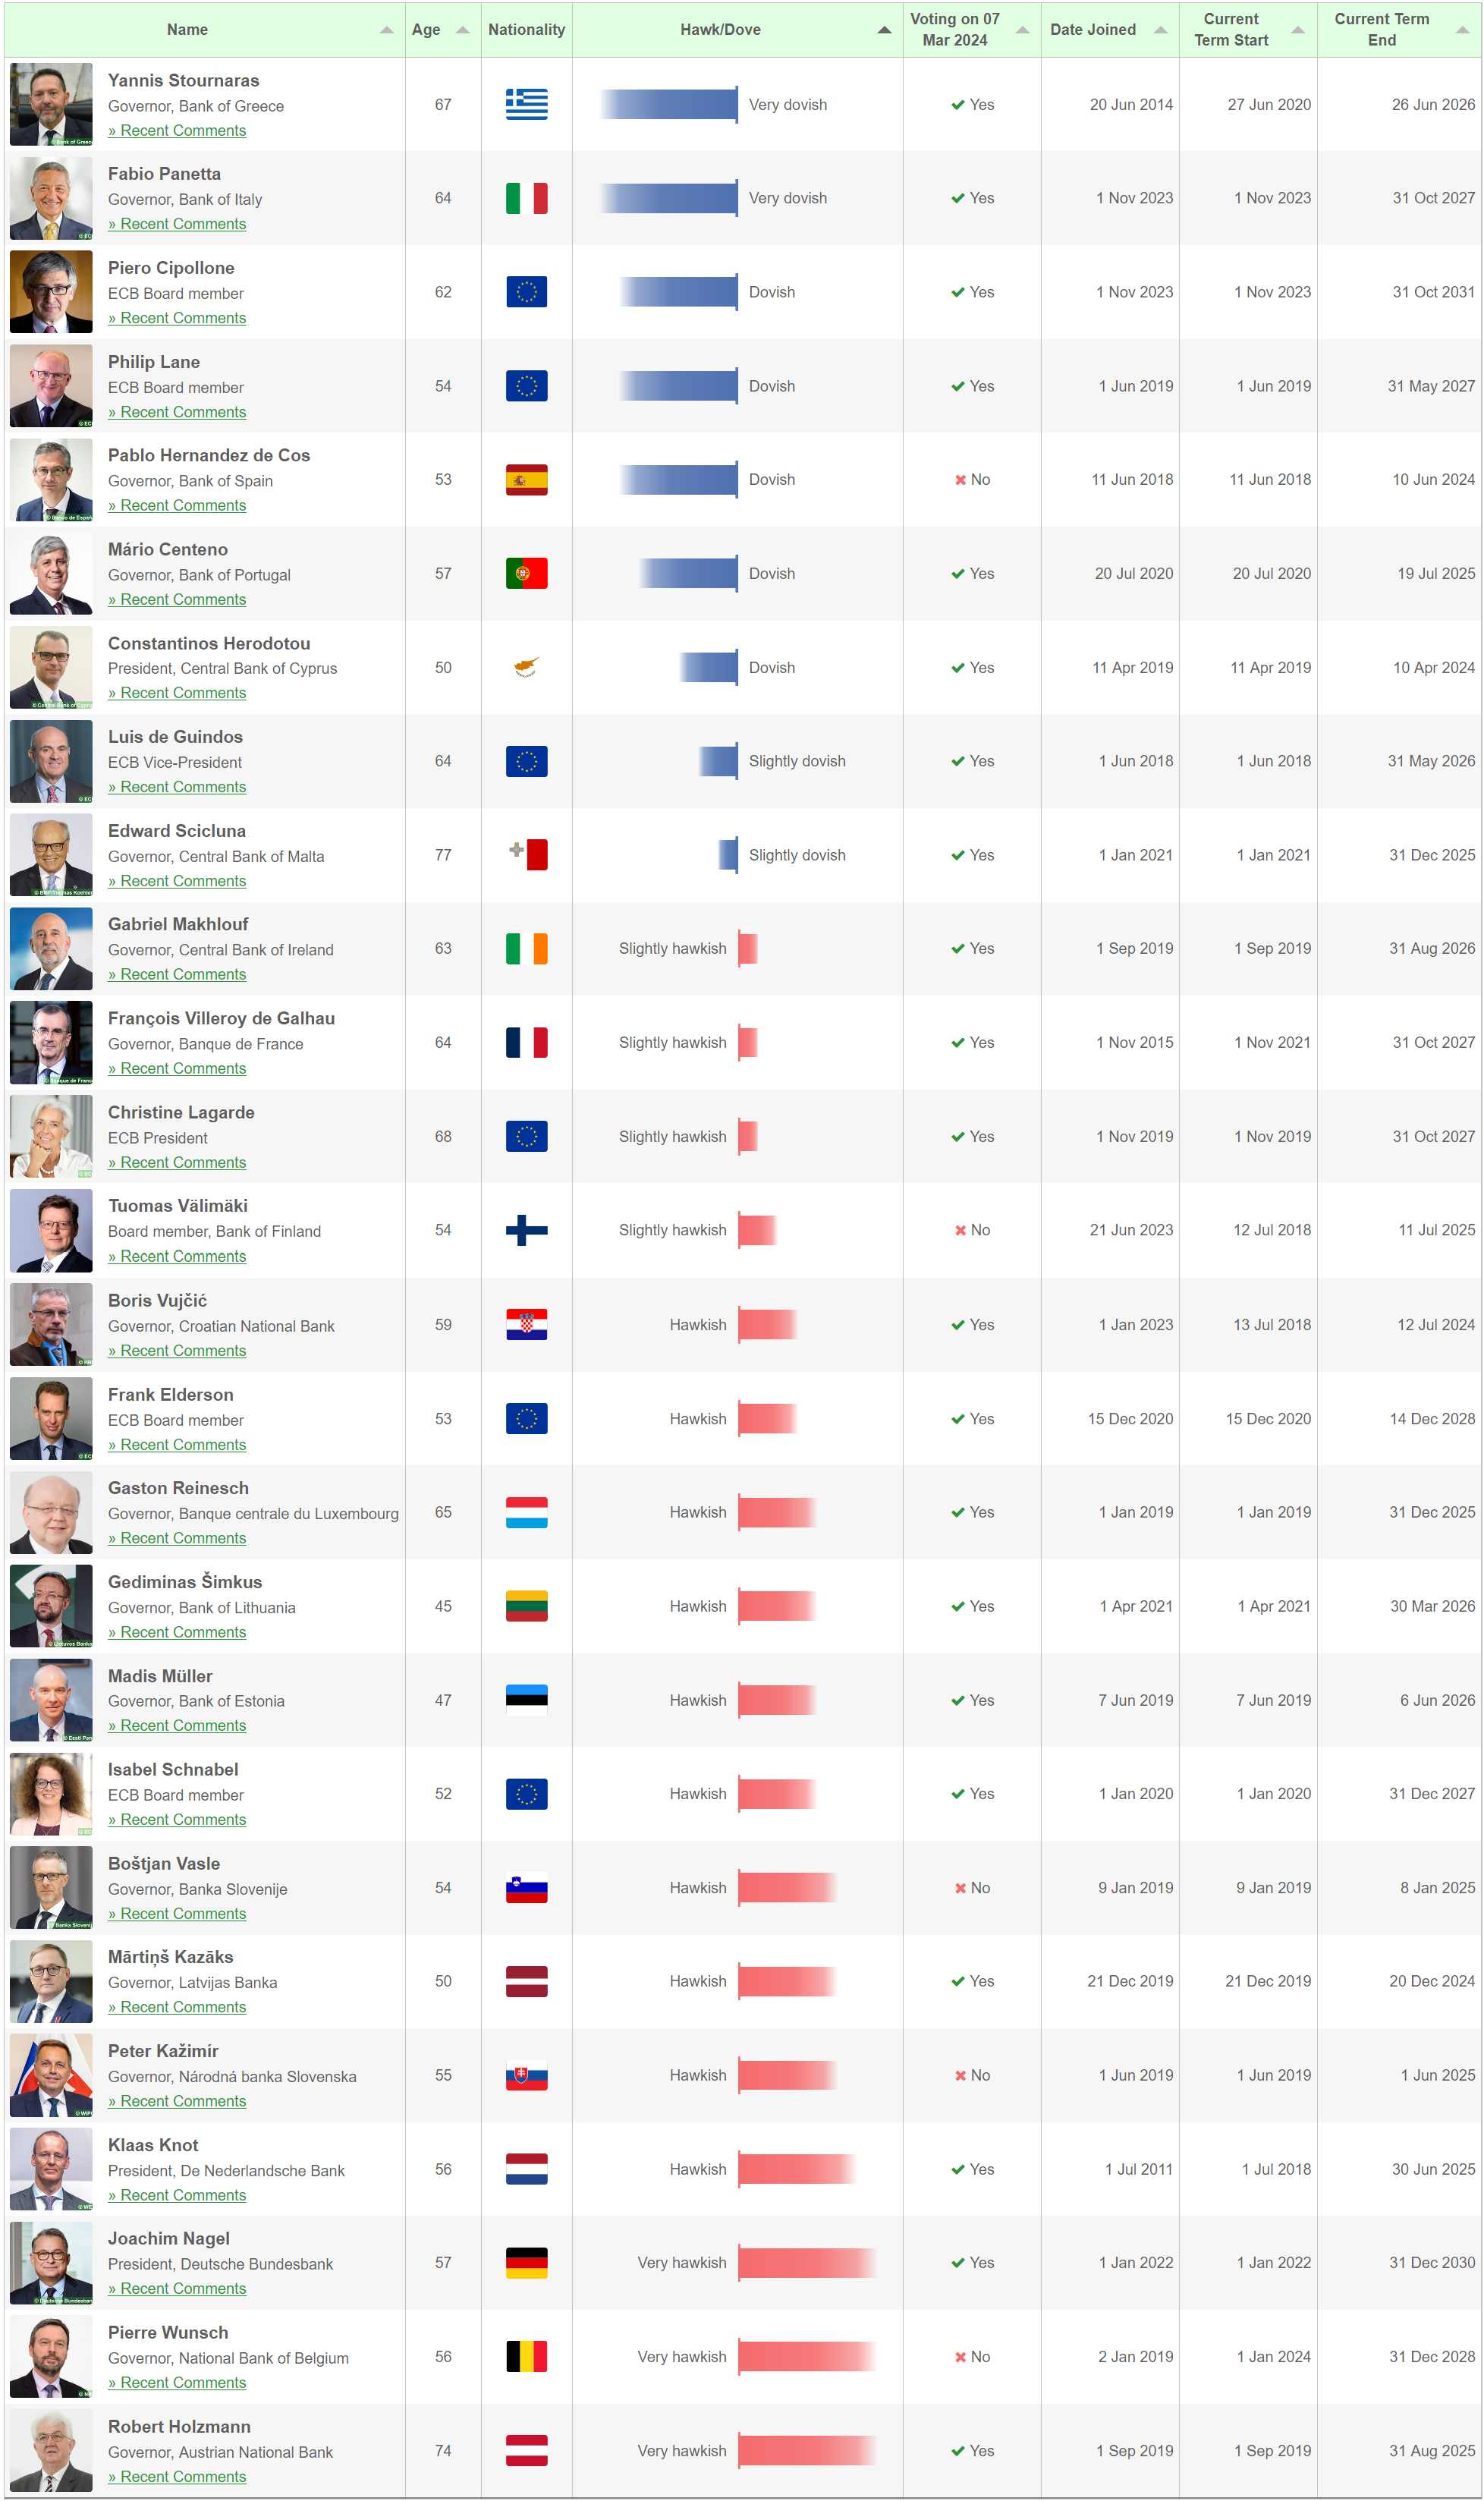
The European Central Bank’s Governing Council members have shifted more dovish than hawkish over the past few months; as inflation is almost at the European Central Bank’s price stability goal, it is quite remarkable that the European Central Bank’s Governing Council members have shifted the most dovish ever from the previously stated hawkish stances. Although hawkishness remains among the European Central Bank’s Governing Council members, the market-priced rate path remains far more dovish than the European Central Bank’s Governing Council members’ hawkish stances.
Figure 28. Market Expectations Over The European Central Bank’s Monetary Policy Rate.
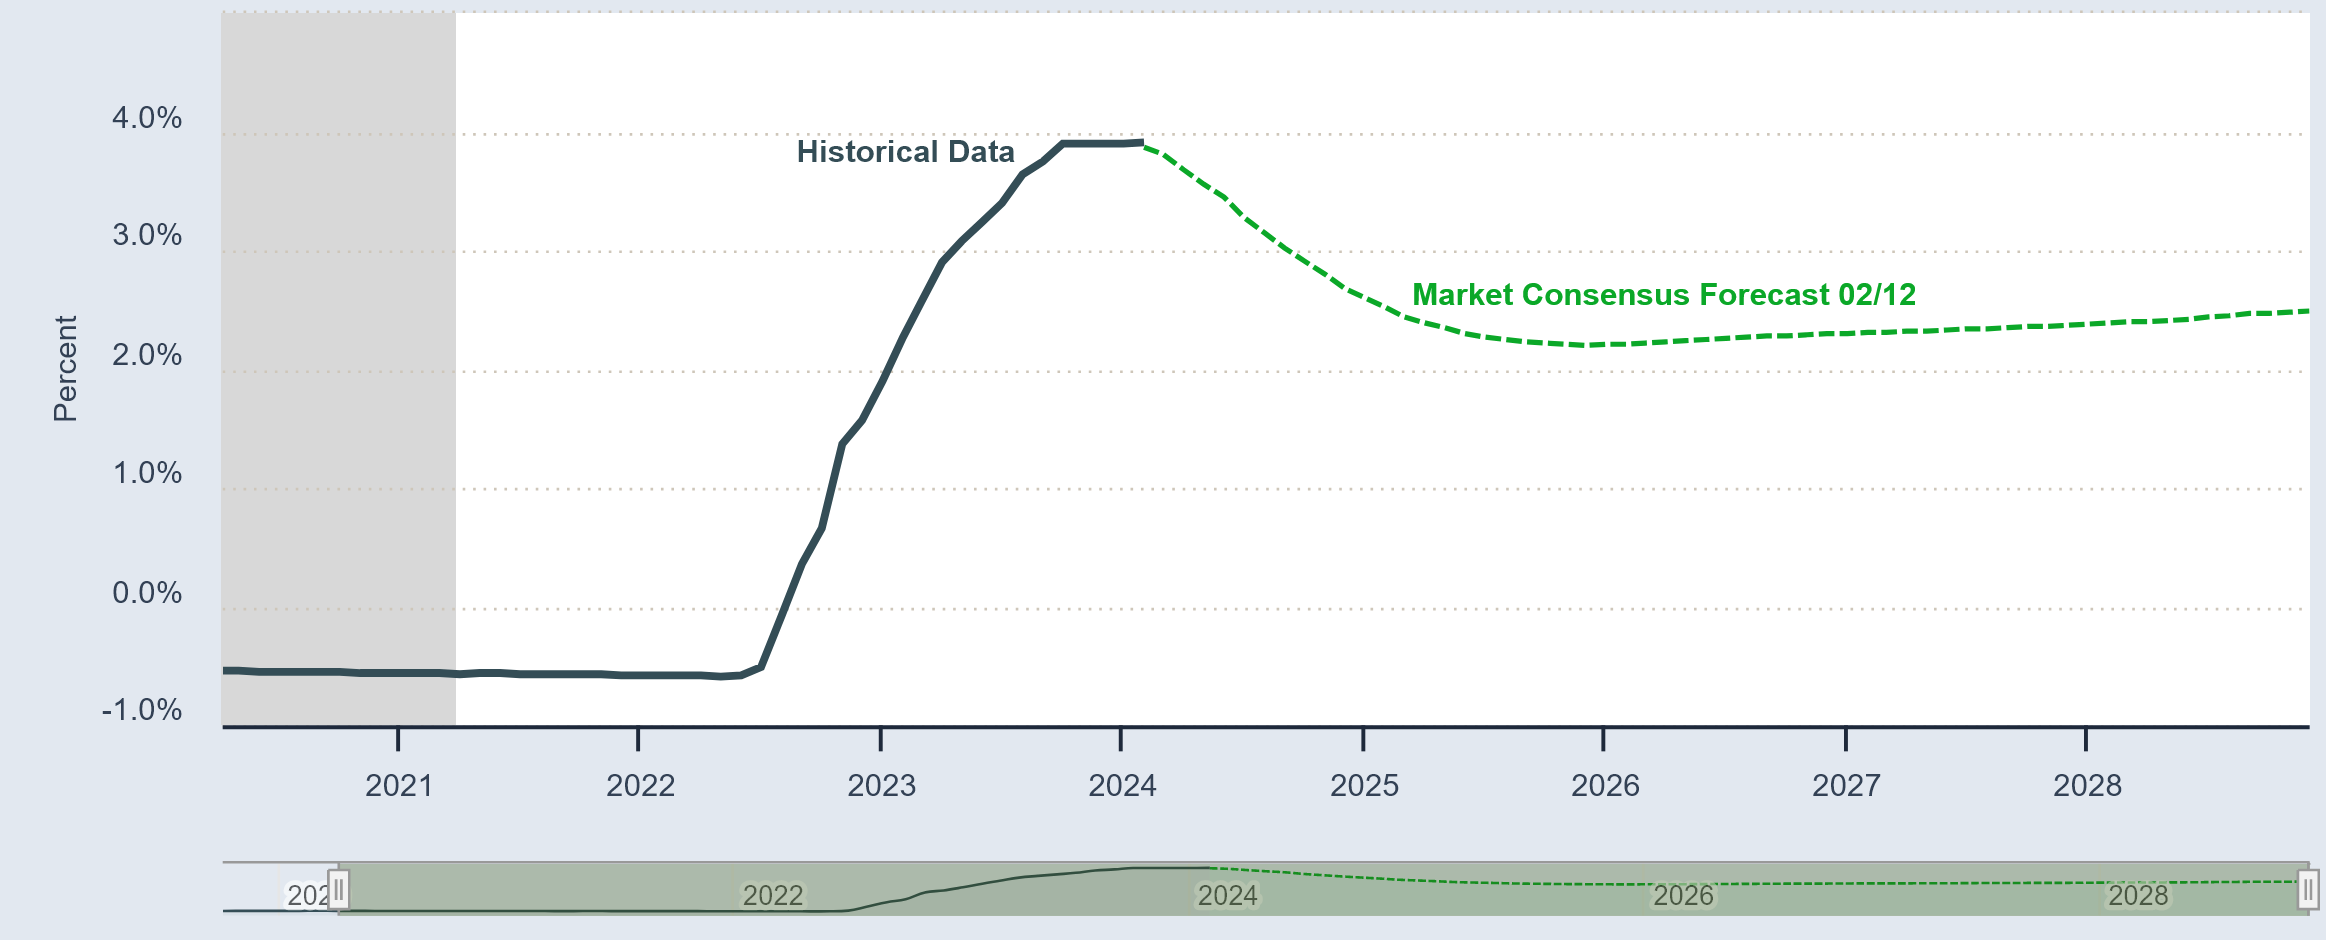
Figure 29. European Central Bank’s Governing Council Hawk & Dove Members. ( Hawkishness Remains Among The European Central Bank’s Governing Council Members ).
If you ask me, what does this mean for markets? I’d tell you that these statistics and data suggest that monetary policy will likely remain under a hawkish nimble stance, as there really is no need for rate cuts. Monetary policy will likely keep rates at current levels until after the European Central Bank’s price stability goal is achieved ( quantified approximation is two months until the European Central Bank’s price stability goal is achieved ). Euro-Zone markets alike to the United States’ markets are betting on the soft-landing outcome, given the fact that statistics support the positioning and narrative.
Figure 30. DB Eurozone Gross Equity Futures Index.
[ Left Y-axis: Index data. (🟦) | Right Y-axis: Volatility of the index. (🟥) ]
![[ Left X-axis: Index data. (🟦) | Right X-axis: Volatility of the index. (🟥) ] | Data as of 02/09/2024 market close. |](https://substackcdn.com/image/fetch/f_auto,q_auto:good,fl_progressive:steep/https%3A%2F%2Fsubstack-post-media.s3.amazonaws.com%2Fpublic%2Fimages%2F4a921118-c19e-4ab3-9a92-ad59295b0c6b_3806x1932.png "[ Left X-axis: Index data. (🟦) | Right X-axis: Volatility of the index. (🟥) ] | Data as of 02/09/2024 market close. |")
Figure 31. Croci World EUR Master TR Index.
[ Left Y-axis: Index data. (🟦) | Right Y-axis: Volatility of the index. (🟥) ]
![[ Left X-axis: Index data. (🟦) | Right X-axis: Volatility of the index. (🟥) ] | Data as of 02/09/2024 market close. |](https://substackcdn.com/image/fetch/f_auto,q_auto:good,fl_progressive:steep/https%3A%2F%2Fsubstack-post-media.s3.amazonaws.com%2Fpublic%2Fimages%2F438d08b8-a8a3-453e-9925-f643c6eb94f1_3802x1938.png "[ Left X-axis: Index data. (🟦) | Right X-axis: Volatility of the index. (🟥) ] | Data as of 02/09/2024 market close. |")
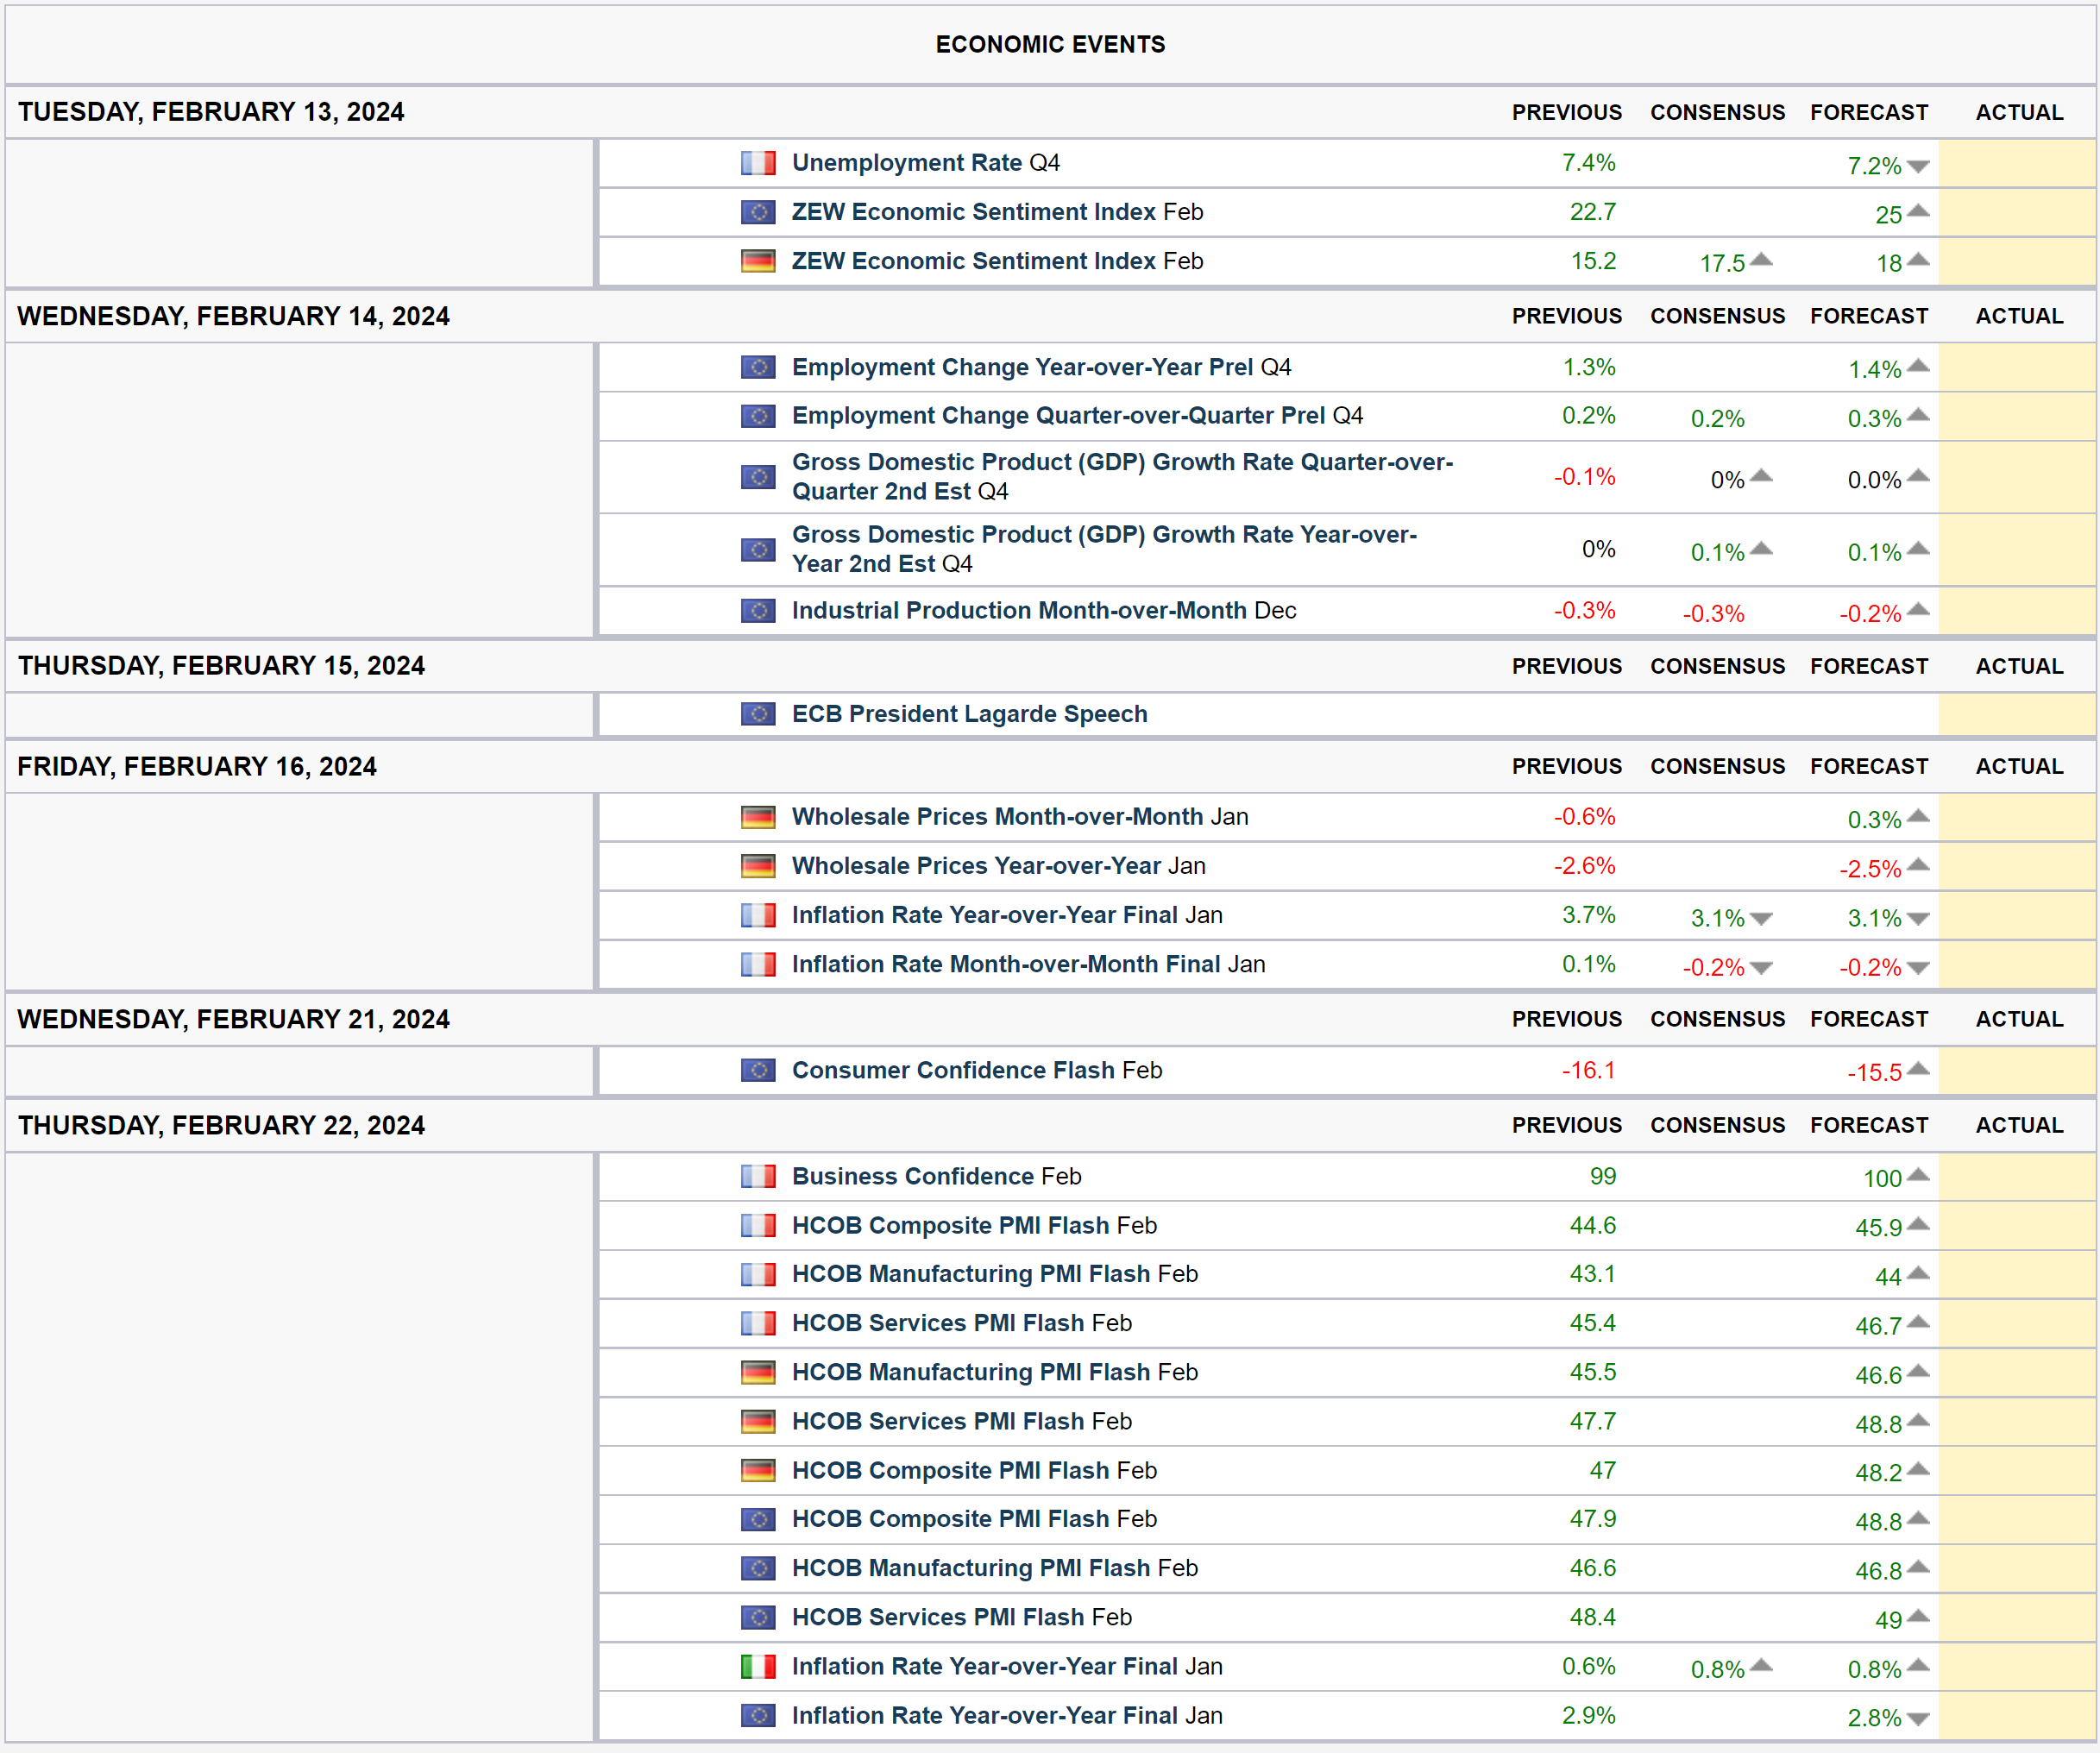
If you ask me, what should I be attentive to? I’d tell you to be attentive to next week’s economic sentiment data releases, the Gross Domestic Product (GDP) data release, and to the European Central Bank’s Ms. Lagarde’s speech, as it’ll likely indicate the forward stance ( which is hawkish ). The week after consumer confidence data release and inflation data release are also important, as monetary policy would react hawkishly ( if inflation data is higher than expectations ) or dovishly ( if inflation data is lower than expectations ) to these statistics, as monetary policy is data-dependent.
Figure 32. Next Two Week’s Euro-Zone Data Release Expectations.
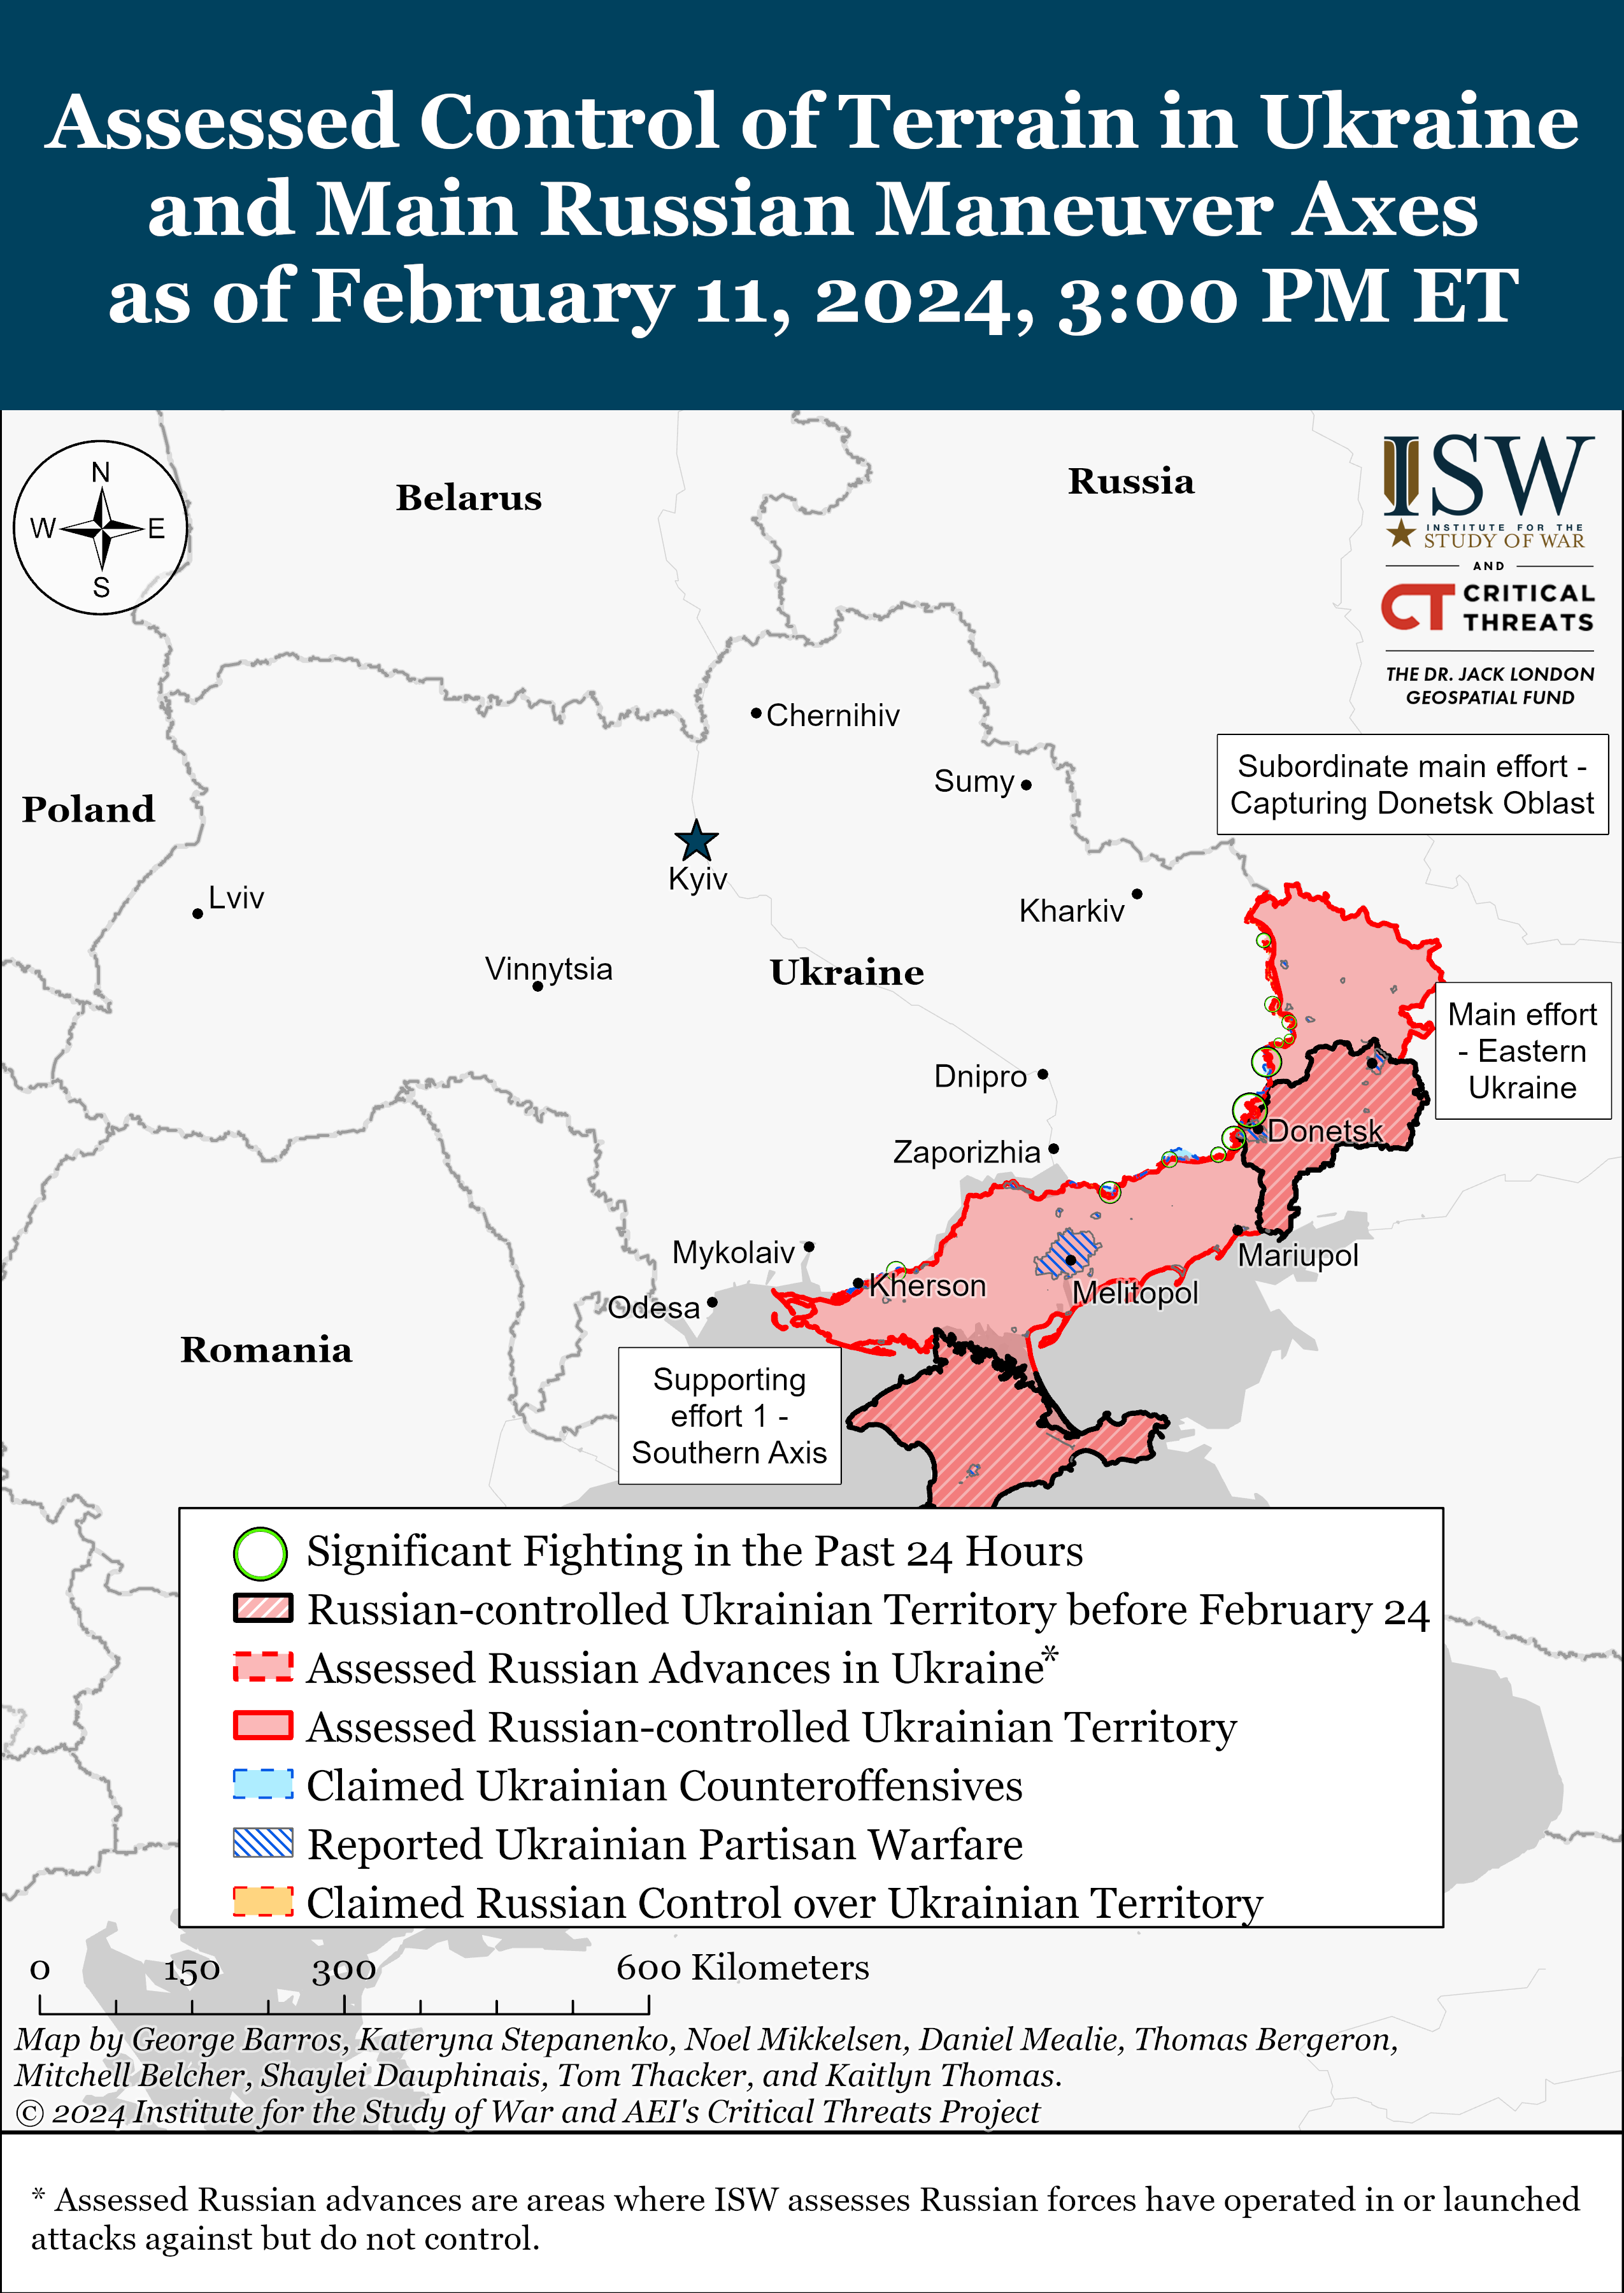
The previously mentioned electric grid security measures taken by European countries, measures that replaced the Russian natural gas with Norwegian natural gas, keep ensuring stability in the Euro-Zone, record natural gas production by Norway keeps lowering natural gas prices (KOLD 0.00%↑) and consequently energy prices. To conclude, when it comes to geopolitics, the Russo-Ukrainian war continues, Ukraine’s European Union admission and Ukraine’s NATO accession remain impossible as NATO and the European Union prefer a proxy war rather than invoke the UN Article 51 / EU Mutual Defense Clause and NATO Article Five. The developments in the region keep being concentrated in Luhansk and Donetsk.
Figure 33. Russo-Ukrainian War Situation Map.

Figure 34. Israel-Hamas War Situation Map.

The Israel-Hamas war has caused supply-chain disruptions far more drastic than the 2020’s pandemic supply-chain disruptions; rising freight costs have generated a shipping sector (BOAT 0.00%↑BDRY 0.00%↑MMM 0.00%↑) crisis and a supply-driven inflationary vector which have materialized first in the Institute For Supply Management (ISM®) statistics as shown in the fifth figure early in the post.
Figure 35. The War In The Middle East Made Vessels Deviate From The Suez Canal Route To Cape Of Good Hope Route & Consequently Increased Freight/Shipping Rates & Time.
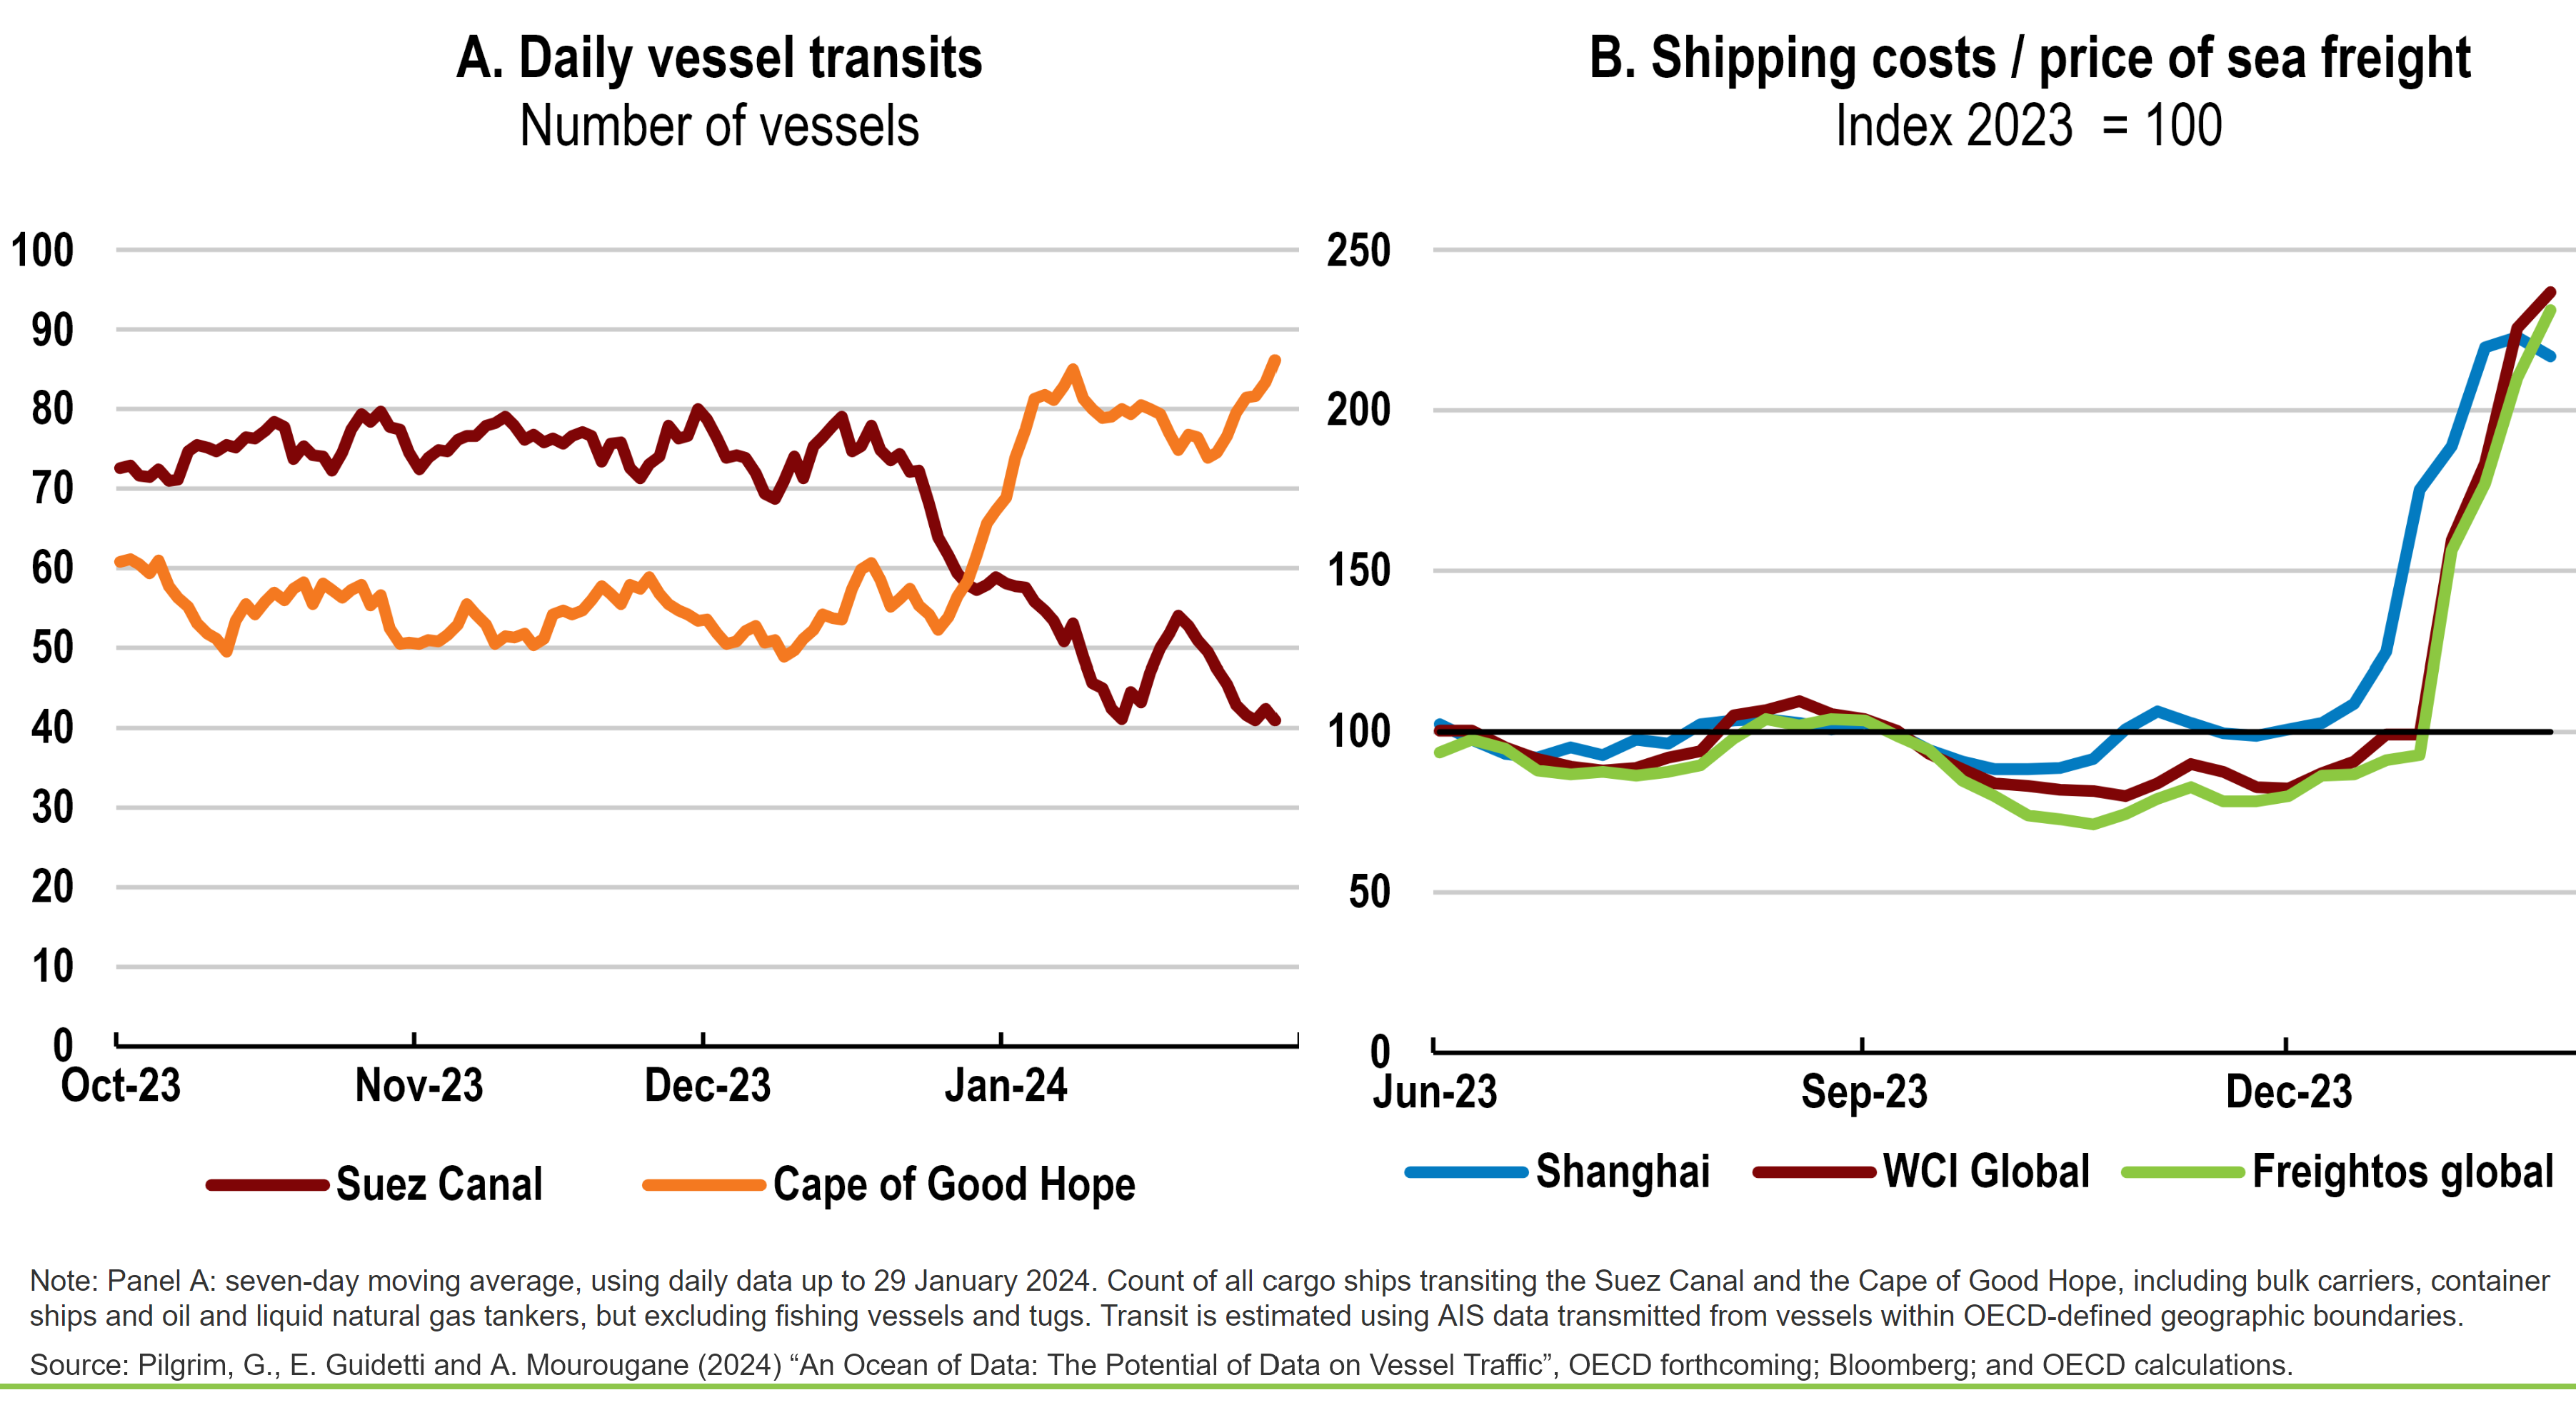
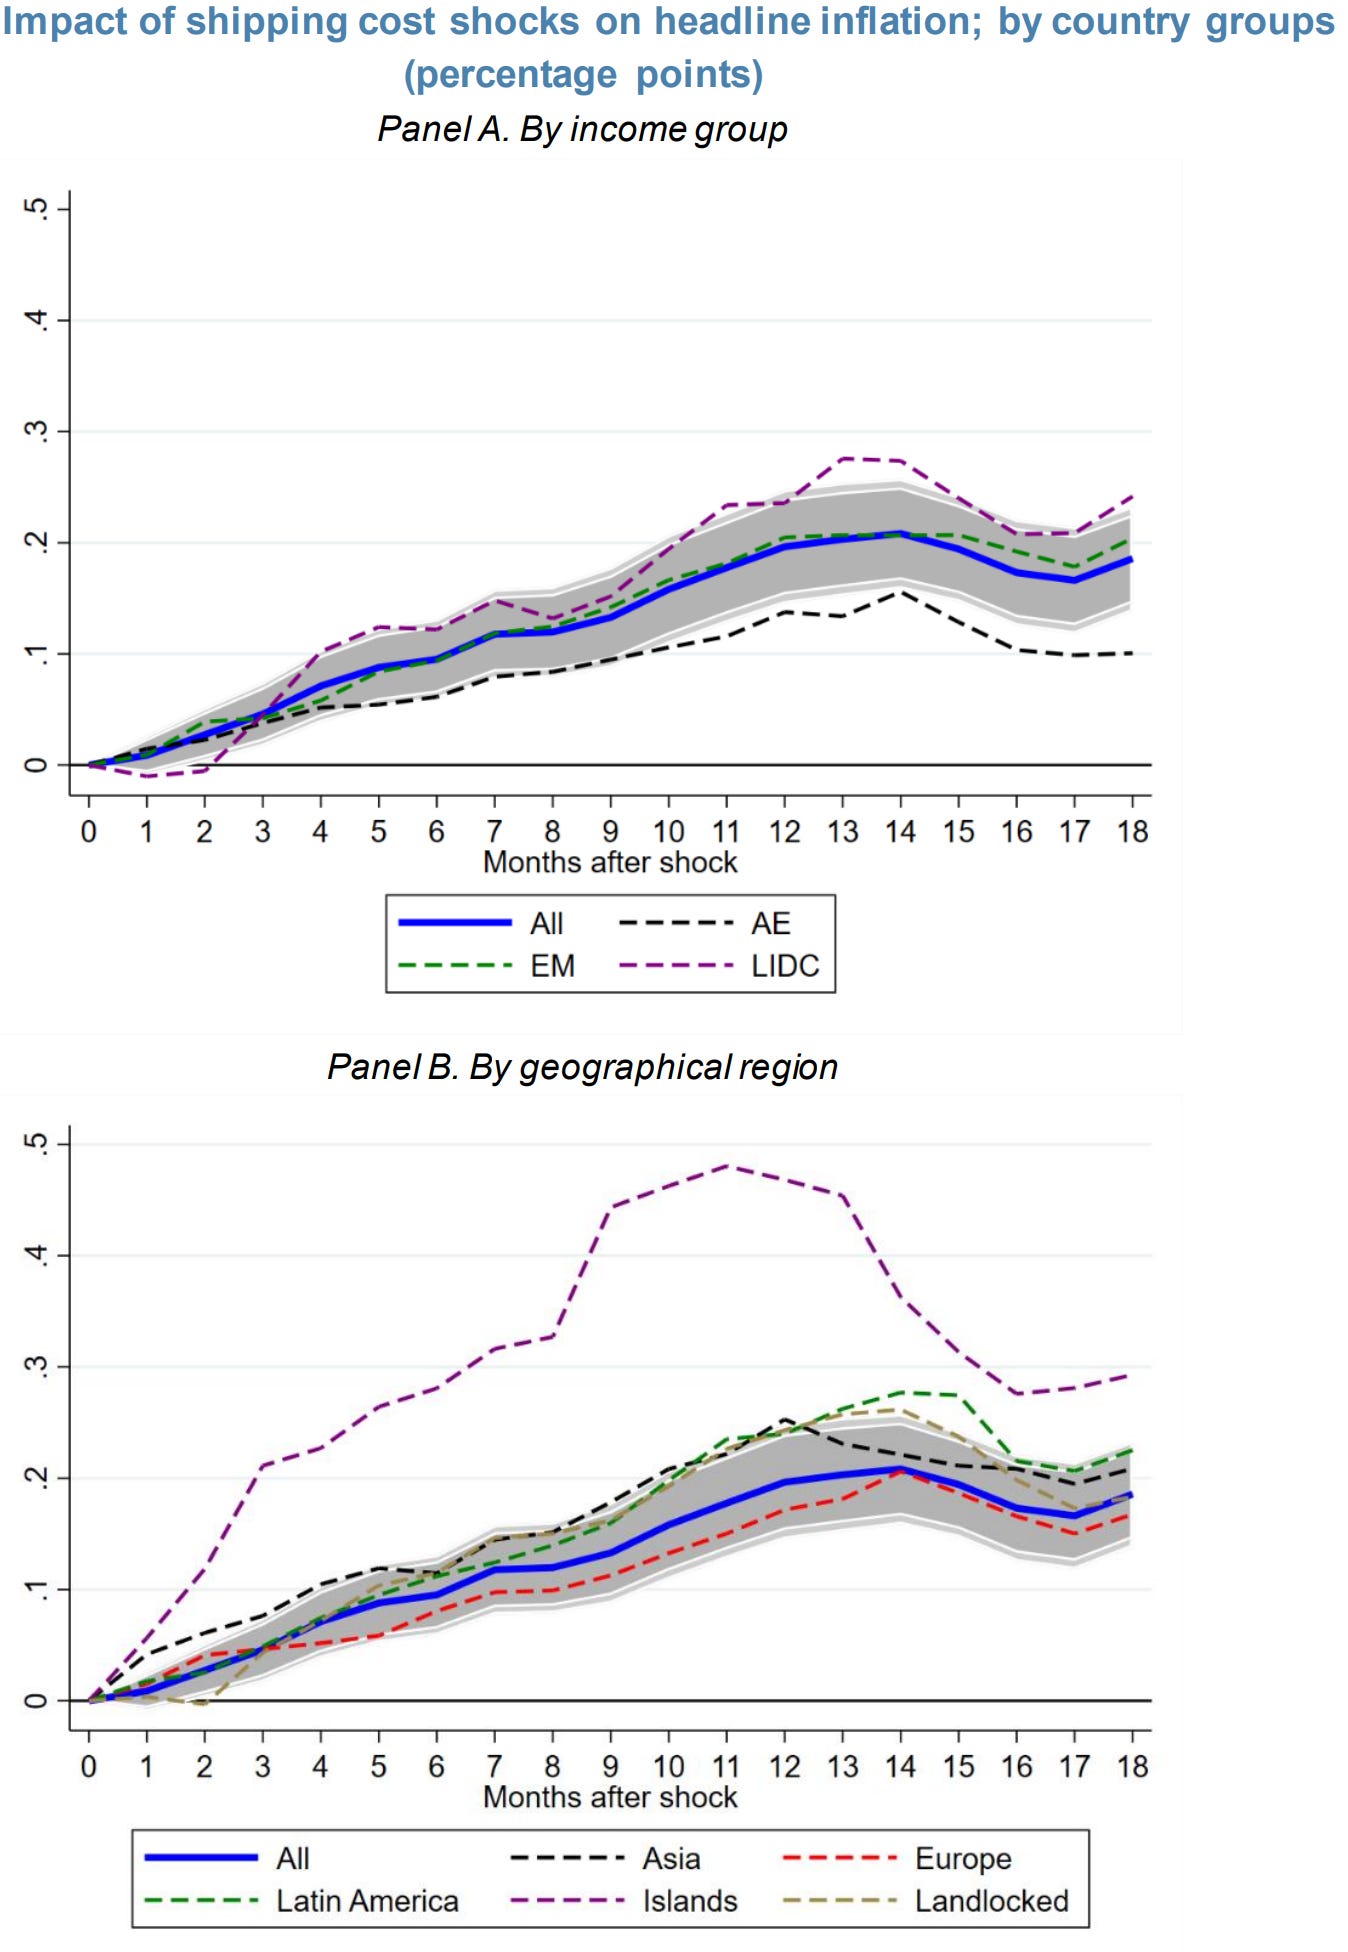
Figure 36. Recent Spike In Freight/Shipping Cost Will Generate A 2% Inflation Rise In the Near-Term.
If you ask me, how do I hedge this? I’d tell you to go long energy sector (XLE 0.00%↑ VDE 0.00%↑) as the supply disruption enhance energy sector (XLE 0.00%↑ VDE 0.00%↑) commodities ( oil ) prices, but something to keep in mind is that geopolitical news-driven volatility in the energy sector is elevated, any geopolitical news generates a one sigma spike in energy sector commodities prices.
Figure 37. Matteo Iacoviello’s Geopolitical Risk Index Keeps Spiking.
( This is not a stock market index )
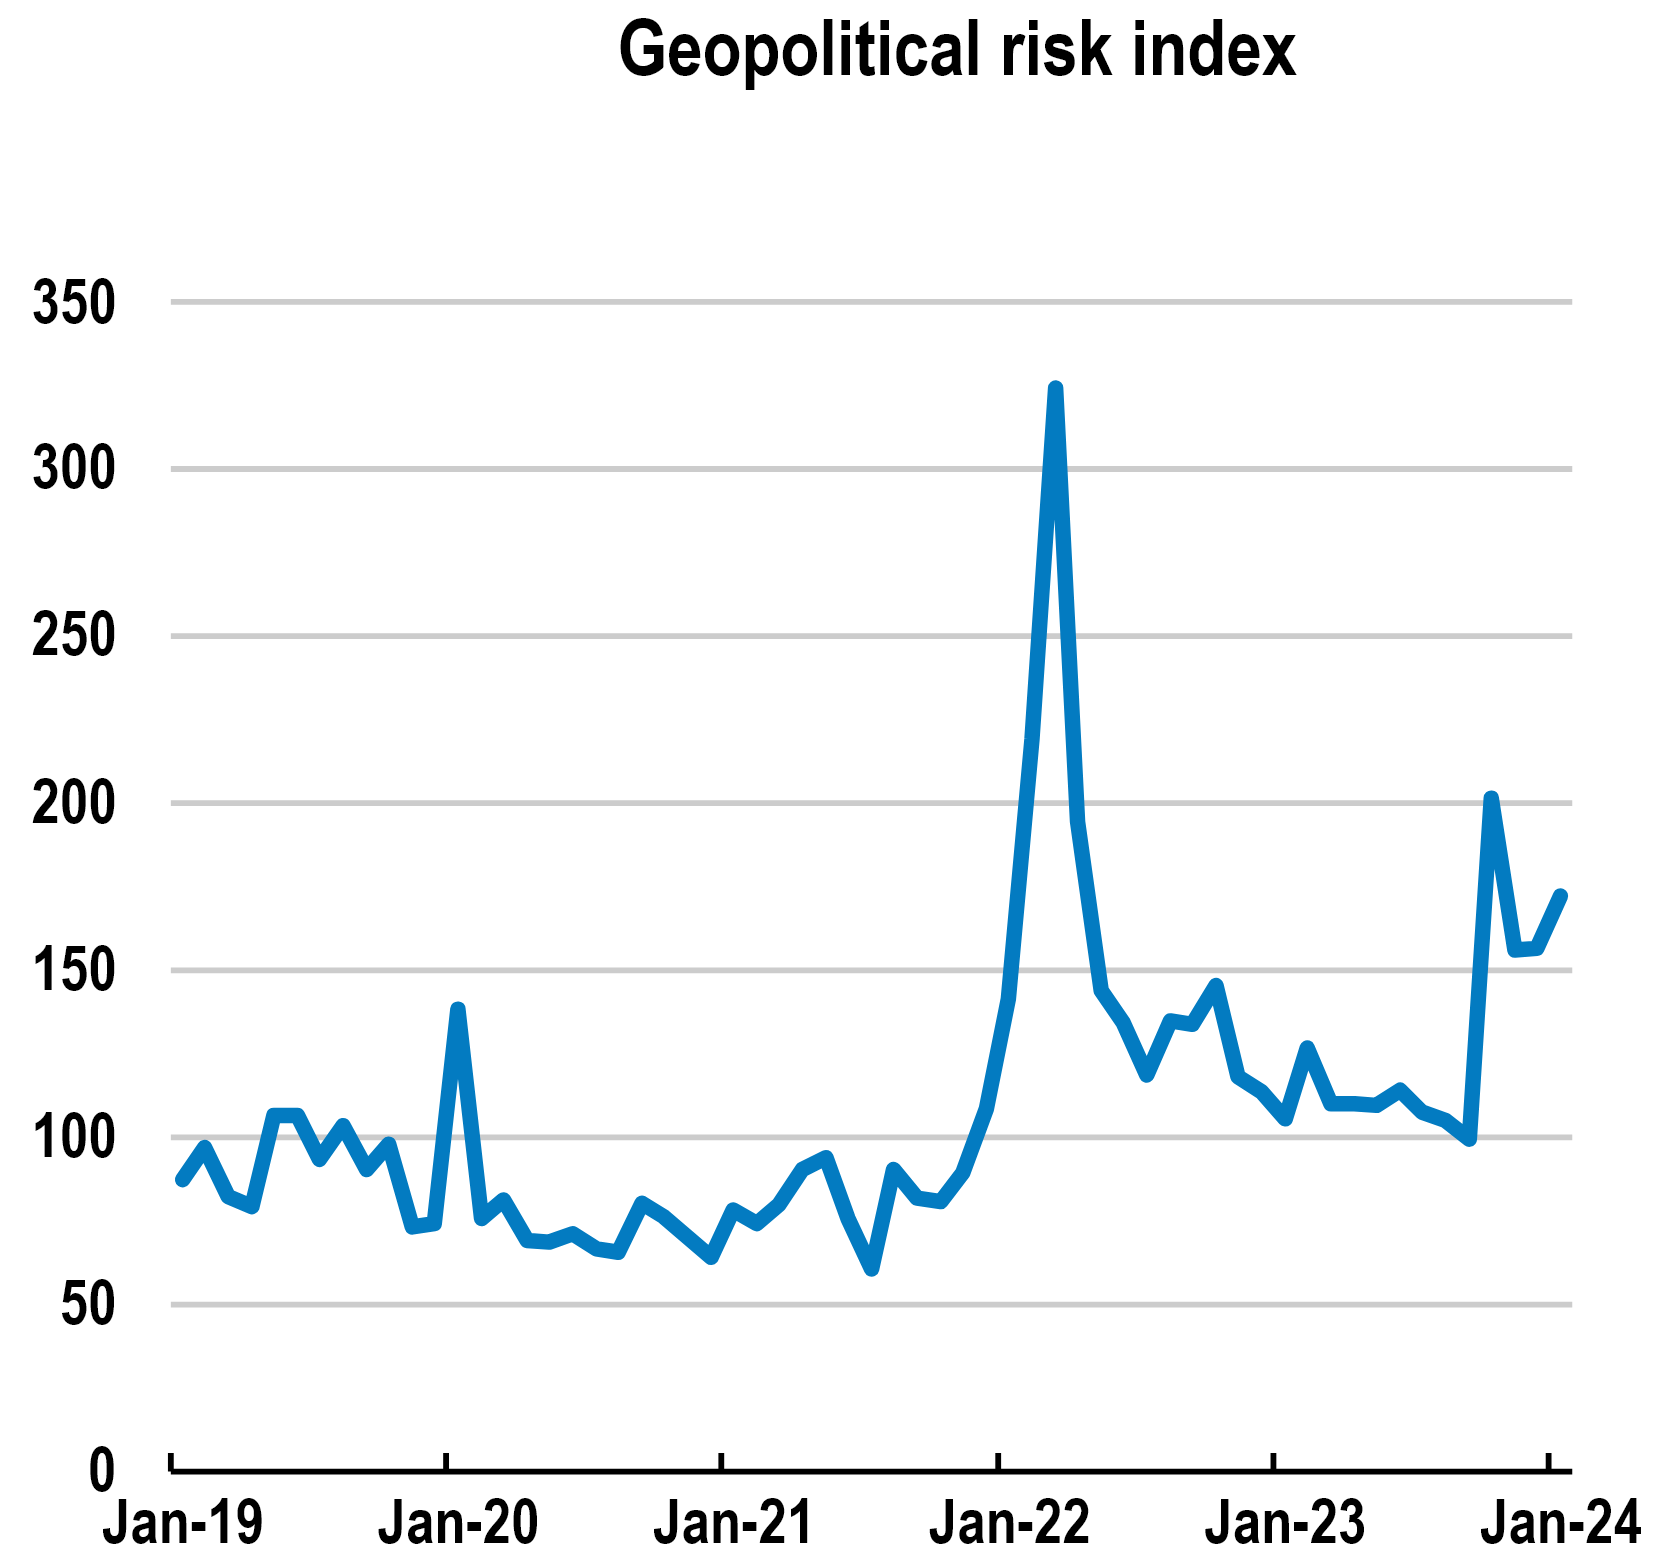
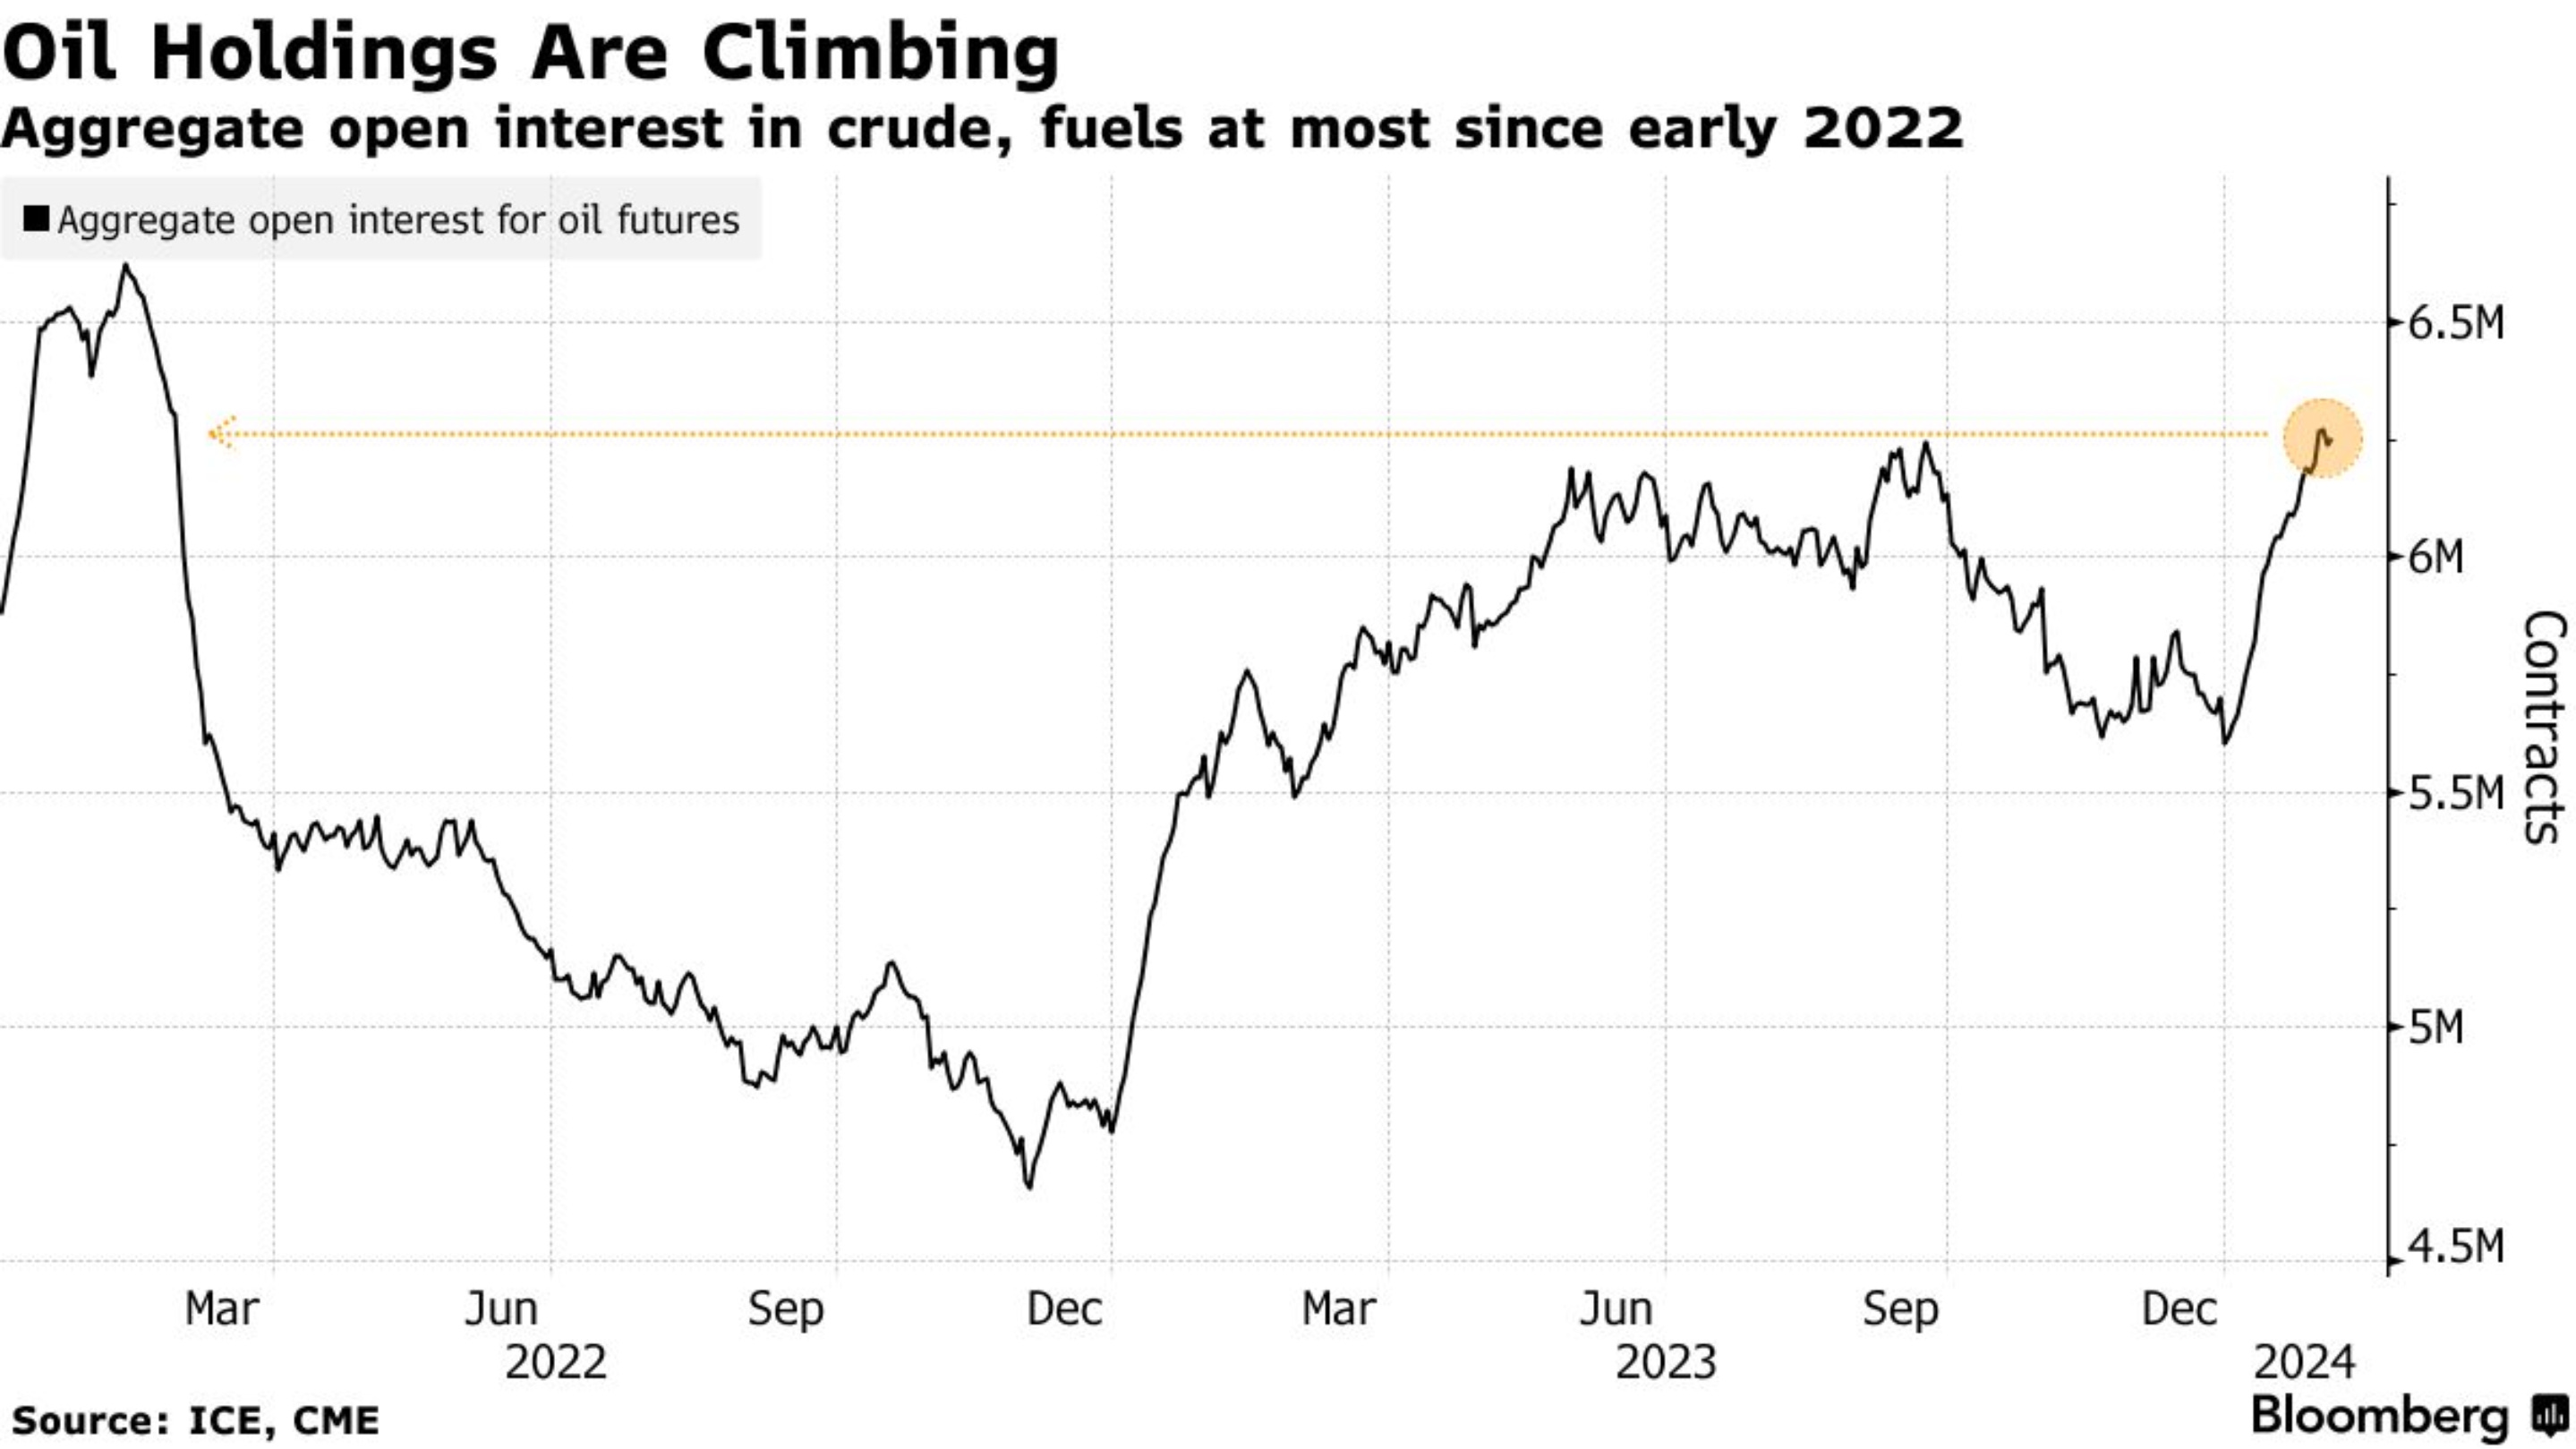
Figure 38. Increased & Increasing Geopolitical Risk Propped Up Market’s Oil Positioning Which Pushed Oil Open Interest To The Highest Level Since Early 2022.
An alternative hedge is to short shipping sector companies (BOAT 0.00%↑BDRY 0.00%↑MMM 0.00%↑) until there are either peace talks over the Israel-Hamas war or keep shorting shipping sector companies (BOAT 0.00%↑BDRY 0.00%↑MMM 0.00%↑) until either side of the Israel-Hamas war wins, which would likely end the supply-chain disruption; until either scenario is materialized, I’d wait to buy shipping sector (BOAT 0.00%↑BDRY 0.00%↑MMM 0.00%↑) stocks while going long energy sector (XLE 0.00%↑ VDE 0.00%↑).
United Kingdom:
The United Kingdom is performing within the range of expectations, continuing improvements in the United Kingdom’s labor market make the Bank of England’s Monetary Policy Committee members stay focused on bringing inflation to the Bank of England’s price stability goal.
Figure 39. United Kingdom’s Labour Force Participation Rate Rebounded From February 2023’s Multi-Decade Low.

It is quite remarkable that the Bank of England’s Quantitative Tightening measures are far more hawkish than the United States’ and Europe’s Quantitative Tightening; the Bank of England’s Monetary Policy Committee’s monetary policy stance is more dovish than in previous months, although still far more hawkish than the market-priced monetary policy stance.
Figure 40. Bank of England’s Monetary Policy Committee’s Monetary Policy Rate Projections.

Figure 41. Market Expectations Over The Bank of England’s Monetary Policy Rate.

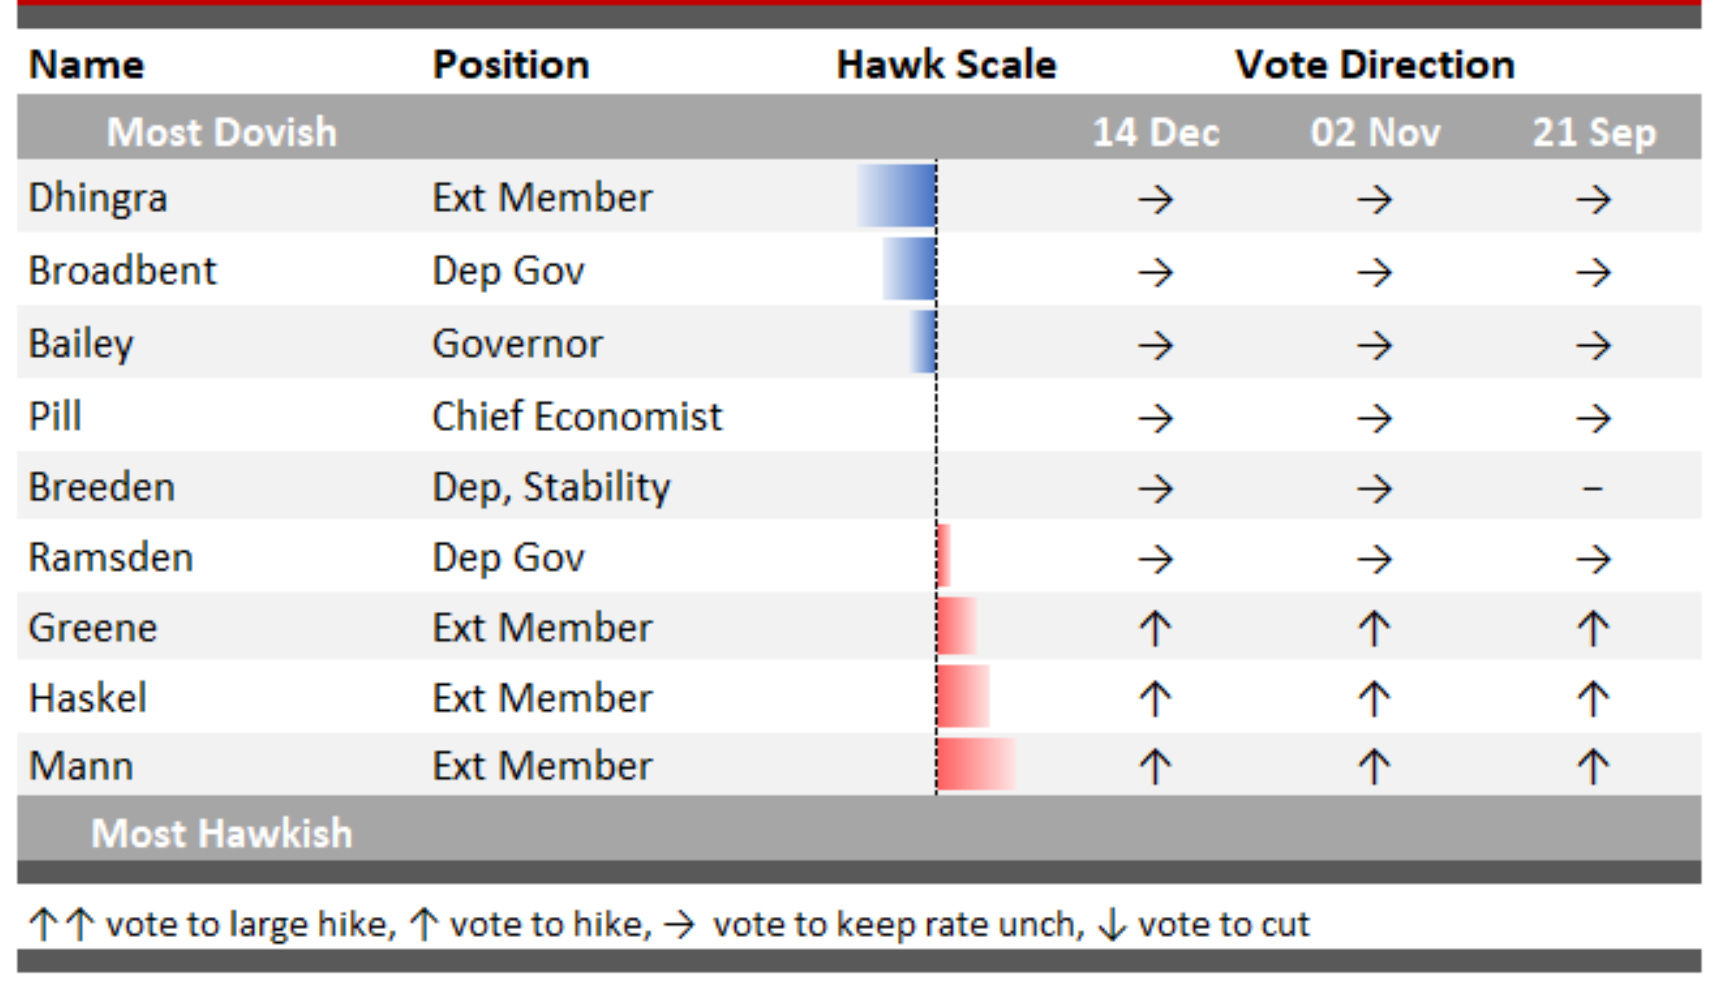
Figure 42. Bank of England Monetary Policy Committee’s Hawks & Doves.
United Kingdom’s inflation has eased but still has not yet reached the Bank of England’s price stability goal, the United Kingdom’s Inflation is mainly supply-driven, something that is interesting is the fact that the United Kingdom’s services inflation is higher than core goods’ inflation, both statistics have eased at different pace but still remain elevated compared to other advanced economies.
Figure 43. The Bank Of England Forecasts Reflation Slightly Higher Than The Bank Of England’s Price Stability Goal.

Figure 44. United Kingdom’s Inflation Is Mainly Supply-Driven.
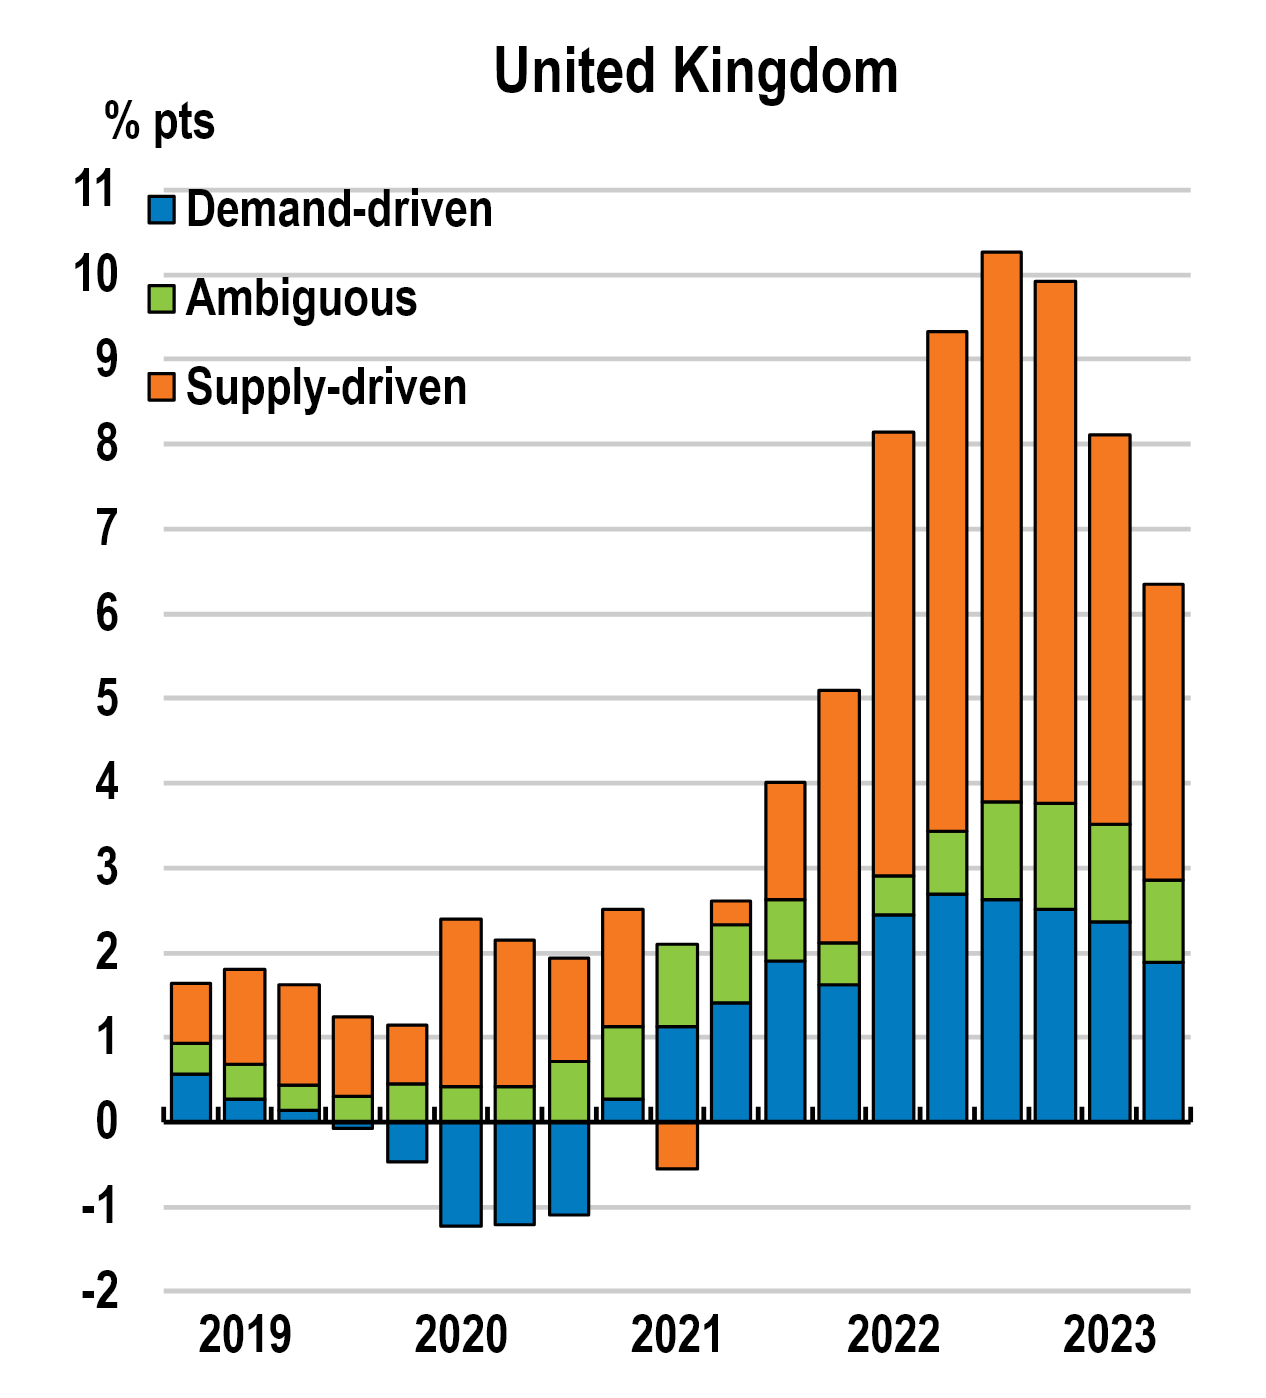
Figure 45. United Kingdom’s Services Inflation Remains At Higher Than Euro Area & United States’ Statistics.

If you ask me, what should I be attentive to? I’d tell you to be attentive to the employment data releases, inflation data releases, the Gross Domestic Product (GDP) data releases, and consumer confidence data release.
Figure 46. Next Two Week’s United Kingdom Data Release Expectations.
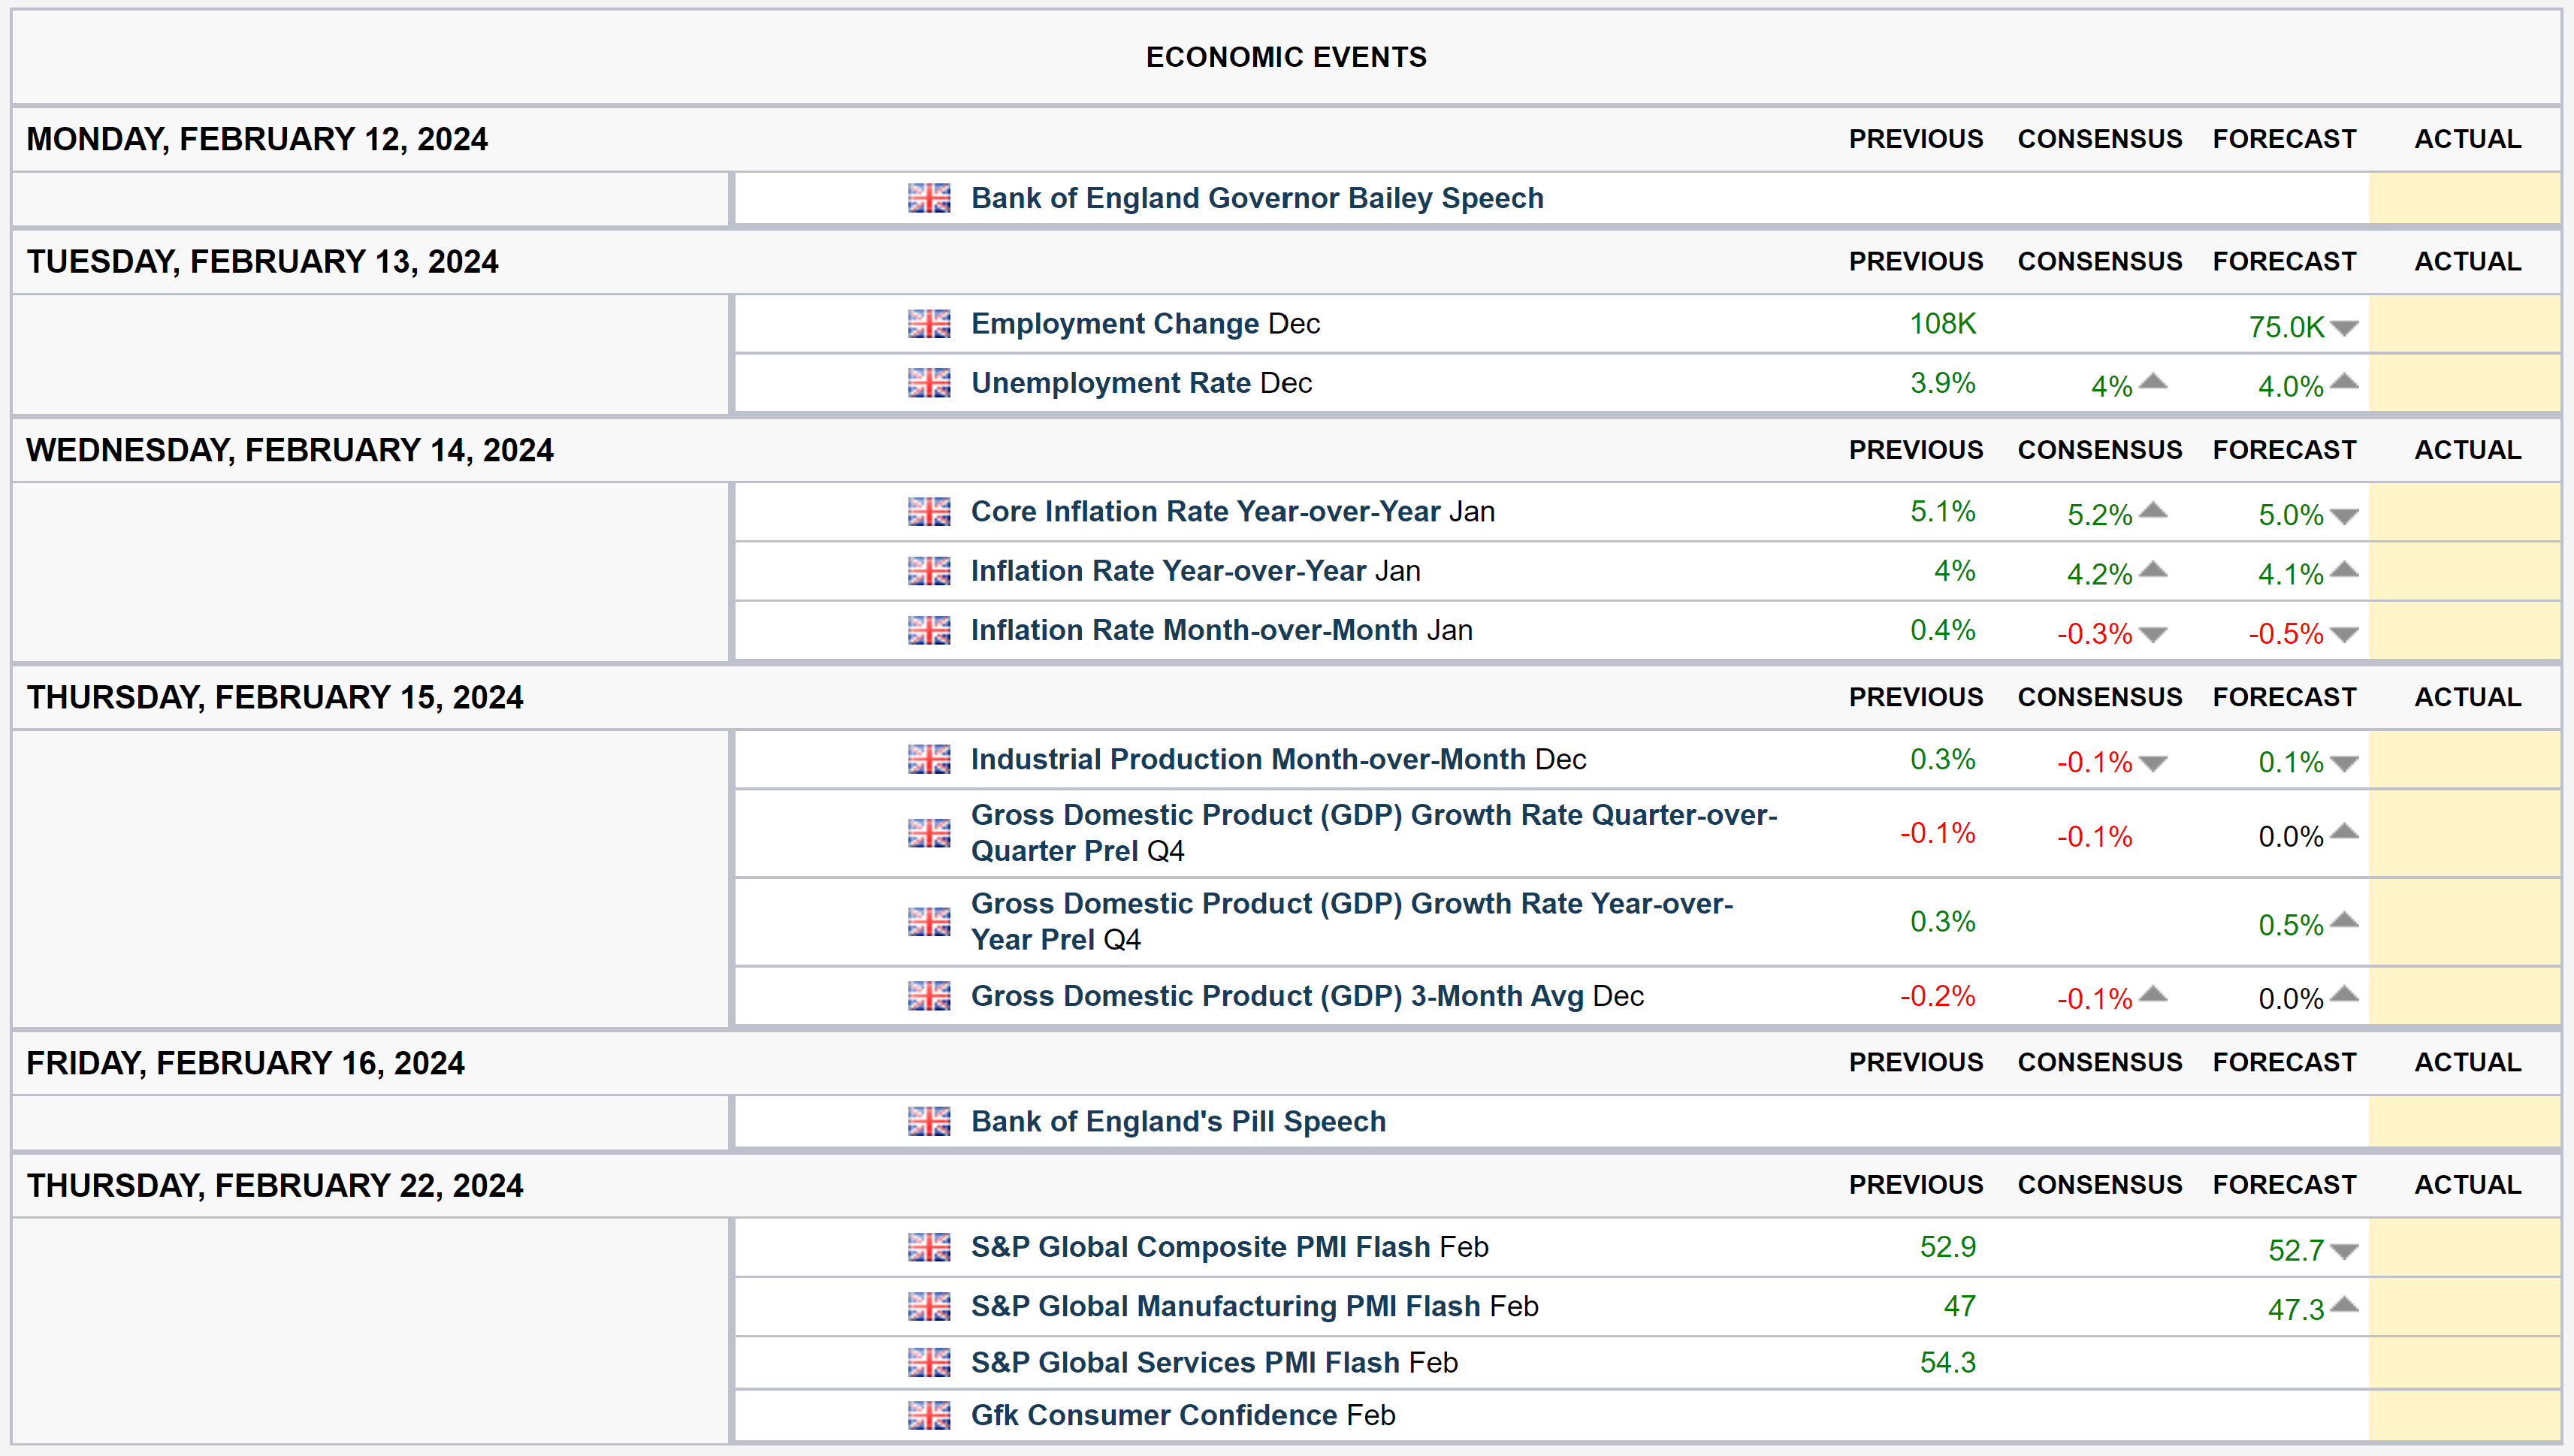
Given the fact that monetary policy is data-dependent, the inflation and job market data statistics will likely skew the forward stance; if inflation data is higher than expectations, a hawkish monetary policy stance should be expected; if inflation data is lower than expectations, a dovish monetary policy stance should be expected. If job market data is greater than expectations, a dovish monetary policy stance should be expected; if job market data is in the range of expectations, a hawkish monetary policy stance should be expected.
Asia:
China:
Taiwan is China, and China's president 习近平's New Year speech assured that "China will surely be reunified, and all Chinese on both sides of the Taiwan Strait" which commitment was reaffirmed during a speech ahead of the Lunar New Year. Expectations over China remain the same. Explained in detail the previous post, here you have a link to it if you want to read it:

Japan:
The Japanese economy is performing within the range of expectations, markets remain optimistic over Prime Minister Fumio and Bank of Japan's Ueda's handling of the Japanese economy, which is reflected in markets' performance.
Figure 47. CROCI Japan Index Total Return.
[ Left Y-axis: Index data. (🟦) | Right Y-axis: Volatility of the index. (🟥) ]
![[ Left X-axis: Index data. (🟦) | Right X-axis: Volatility of the index. (🟥) ] | Data as of 02/13/2024 Tokyo market close. |](https://substackcdn.com/image/fetch/f_auto,q_auto:good,fl_progressive:steep/https%3A%2F%2Fsubstack-post-media.s3.amazonaws.com%2Fpublic%2Fimages%2F9857057d-927e-40e8-875c-758d9f050642_3160x1548.png "[ Left X-axis: Index data. (🟦) | Right X-axis: Volatility of the index. (🟥) ] | Data as of 02/13/2024 Tokyo market close. |")
Figure 48. DB Japan Dividend ER.
[ Left Y-axis: Index data. (🟦) | Right Y-axis: Volatility of the index. (🟥) ]
![[ Left X-axis: Index data. (🟦) | Right X-axis: Volatility of the index. (🟥) ] | Data as of 02/09/2024 Tokyo market close. |](https://substackcdn.com/image/fetch/f_auto,q_auto:good,fl_progressive:steep/https%3A%2F%2Fsubstack-post-media.s3.amazonaws.com%2Fpublic%2Fimages%2F0d959b0b-dccf-4716-83d8-81ec98d3ad36_3370x1636.png "[ Left X-axis: Index data. (🟦) | Right X-axis: Volatility of the index. (🟥) ] | Data as of 02/09/2024 Tokyo market close. |")
Figure 49. Deutsche Bank Japan Gross Equity Futures CTA Index.
[ Left Y-axis: Index data. (🟦) | Right Y-axis: Volatility of the index. (🟥) ]
![[ Left X-axis: Index data. (🟦) | Right X-axis: Volatility of the index. (🟥) ] | Data as of 02/12/2024 Tokyo market close. |](https://substackcdn.com/image/fetch/f_auto,q_auto:good,fl_progressive:steep/https%3A%2F%2Fsubstack-post-media.s3.amazonaws.com%2Fpublic%2Fimages%2F46666fea-6360-41ed-acd8-b3dfe34f652e_3694x1924.png "[ Left X-axis: Index data. (🟦) | Right X-axis: Volatility of the index. (🟥) ] | Data as of 02/12/2024 Tokyo market close. |")
If you ask me, what should I be attentive to? I’d tell you to be attentive to the next Gross Domestic Product (GDP) data release and inflation data releases given the fact that the current monetary policy path of the Bank of Japan is set towards a hike in April of this year.
Figure 50. Next Two Week’s Japanese Data Release Expectations.
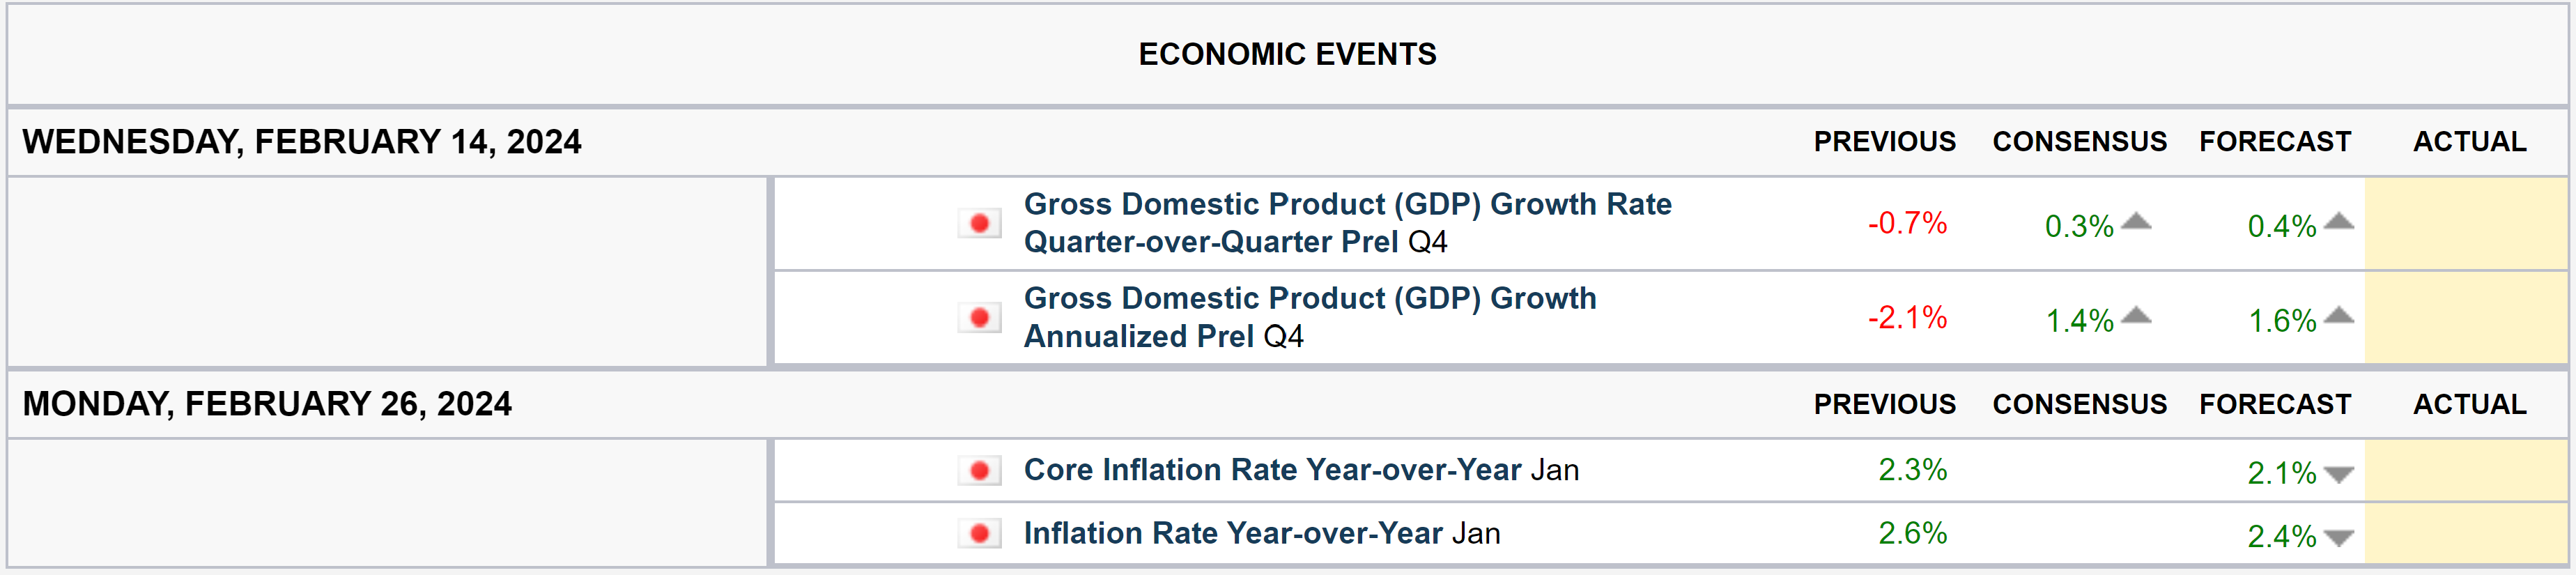
If data releases are higher than expectations a more hawkish monetary policy stance stance should be expected; if data releases are lower than expectations a more dovish monetary policy stance should be expected.
Do feel free, as it’s free, to share, leave a comment, and subscribe to Quantuan Research Substack if you want, by using the next buttons.
It's not about the money (the research is free); it's about sending a message (delivering alpha to the reader).
Note: If the text in the post is grey (example) it is because the source of data is linked; everything is linked in the text, so it’s not messy to add everything at the end like in some tweets.