


Hawkishness remains, but monetary policy dovishness is surging.
Analysis of microeconomic data, macroeconomic data, political data, geo-political data, and monetary policy with commentary on it.

United States:
The United States economy continues to surprise economists' forecasts. Employment statistics show a strong employment market. Recent statistics confirmed the previously explained supply-driven price pressures that would more than likely make monetary policy overreact to these supply-driven inflationary pressures, which monetary policy can't address through monetary policy as monetary policy can only address demand-driven inflationary pressures.
As highlighted in two Substack Note posts ( Posts: 1 | 2 ), it's been notable the recent comments by FOMC members of the Federal Reserve before the FOMC Minutes data release and post-FOMC Minutes release. The comments and stance of FOMC officials lowered the probabilities over the Volcker-like scenario of monetary policy overdoing/overreacting to supply-driven price pressures that monetary policy can't control.
The soft-landing scenario probability has lowered from 80%(±0.5%) early in the year reported to 65%(±0.5%) probability of soft-landing scenario. The main factors that have contributed to the change in probabilities are increased geopolitically-driven risks and a slowing trend in consumer statistics.
Increased and increasing industrial production ( Note: increasing industrial production is important due to the fact that it lowers supply and demand-driven inflationary pressures, further helping monetary policy address more clearly demand-driven inflationary pressures ) and robust employment data keep the probabilities of soft-landing scenario high.
The highest risk for the United States economy and consequently global markets is a Government Bond rating change given an increased and increasing government deficit, which could widen further as the geopolitical scenario escalates ( with prospects of World War ), making the United States increase its fiscal spending focused on defense spending, which would more than likely make politicians raise the government debt ceiling further from recent government measures over it. That fiscal policy dysfunction could cause a rating change in Government Bonds similar to the measure taken by Fitch Ratings early in the year.
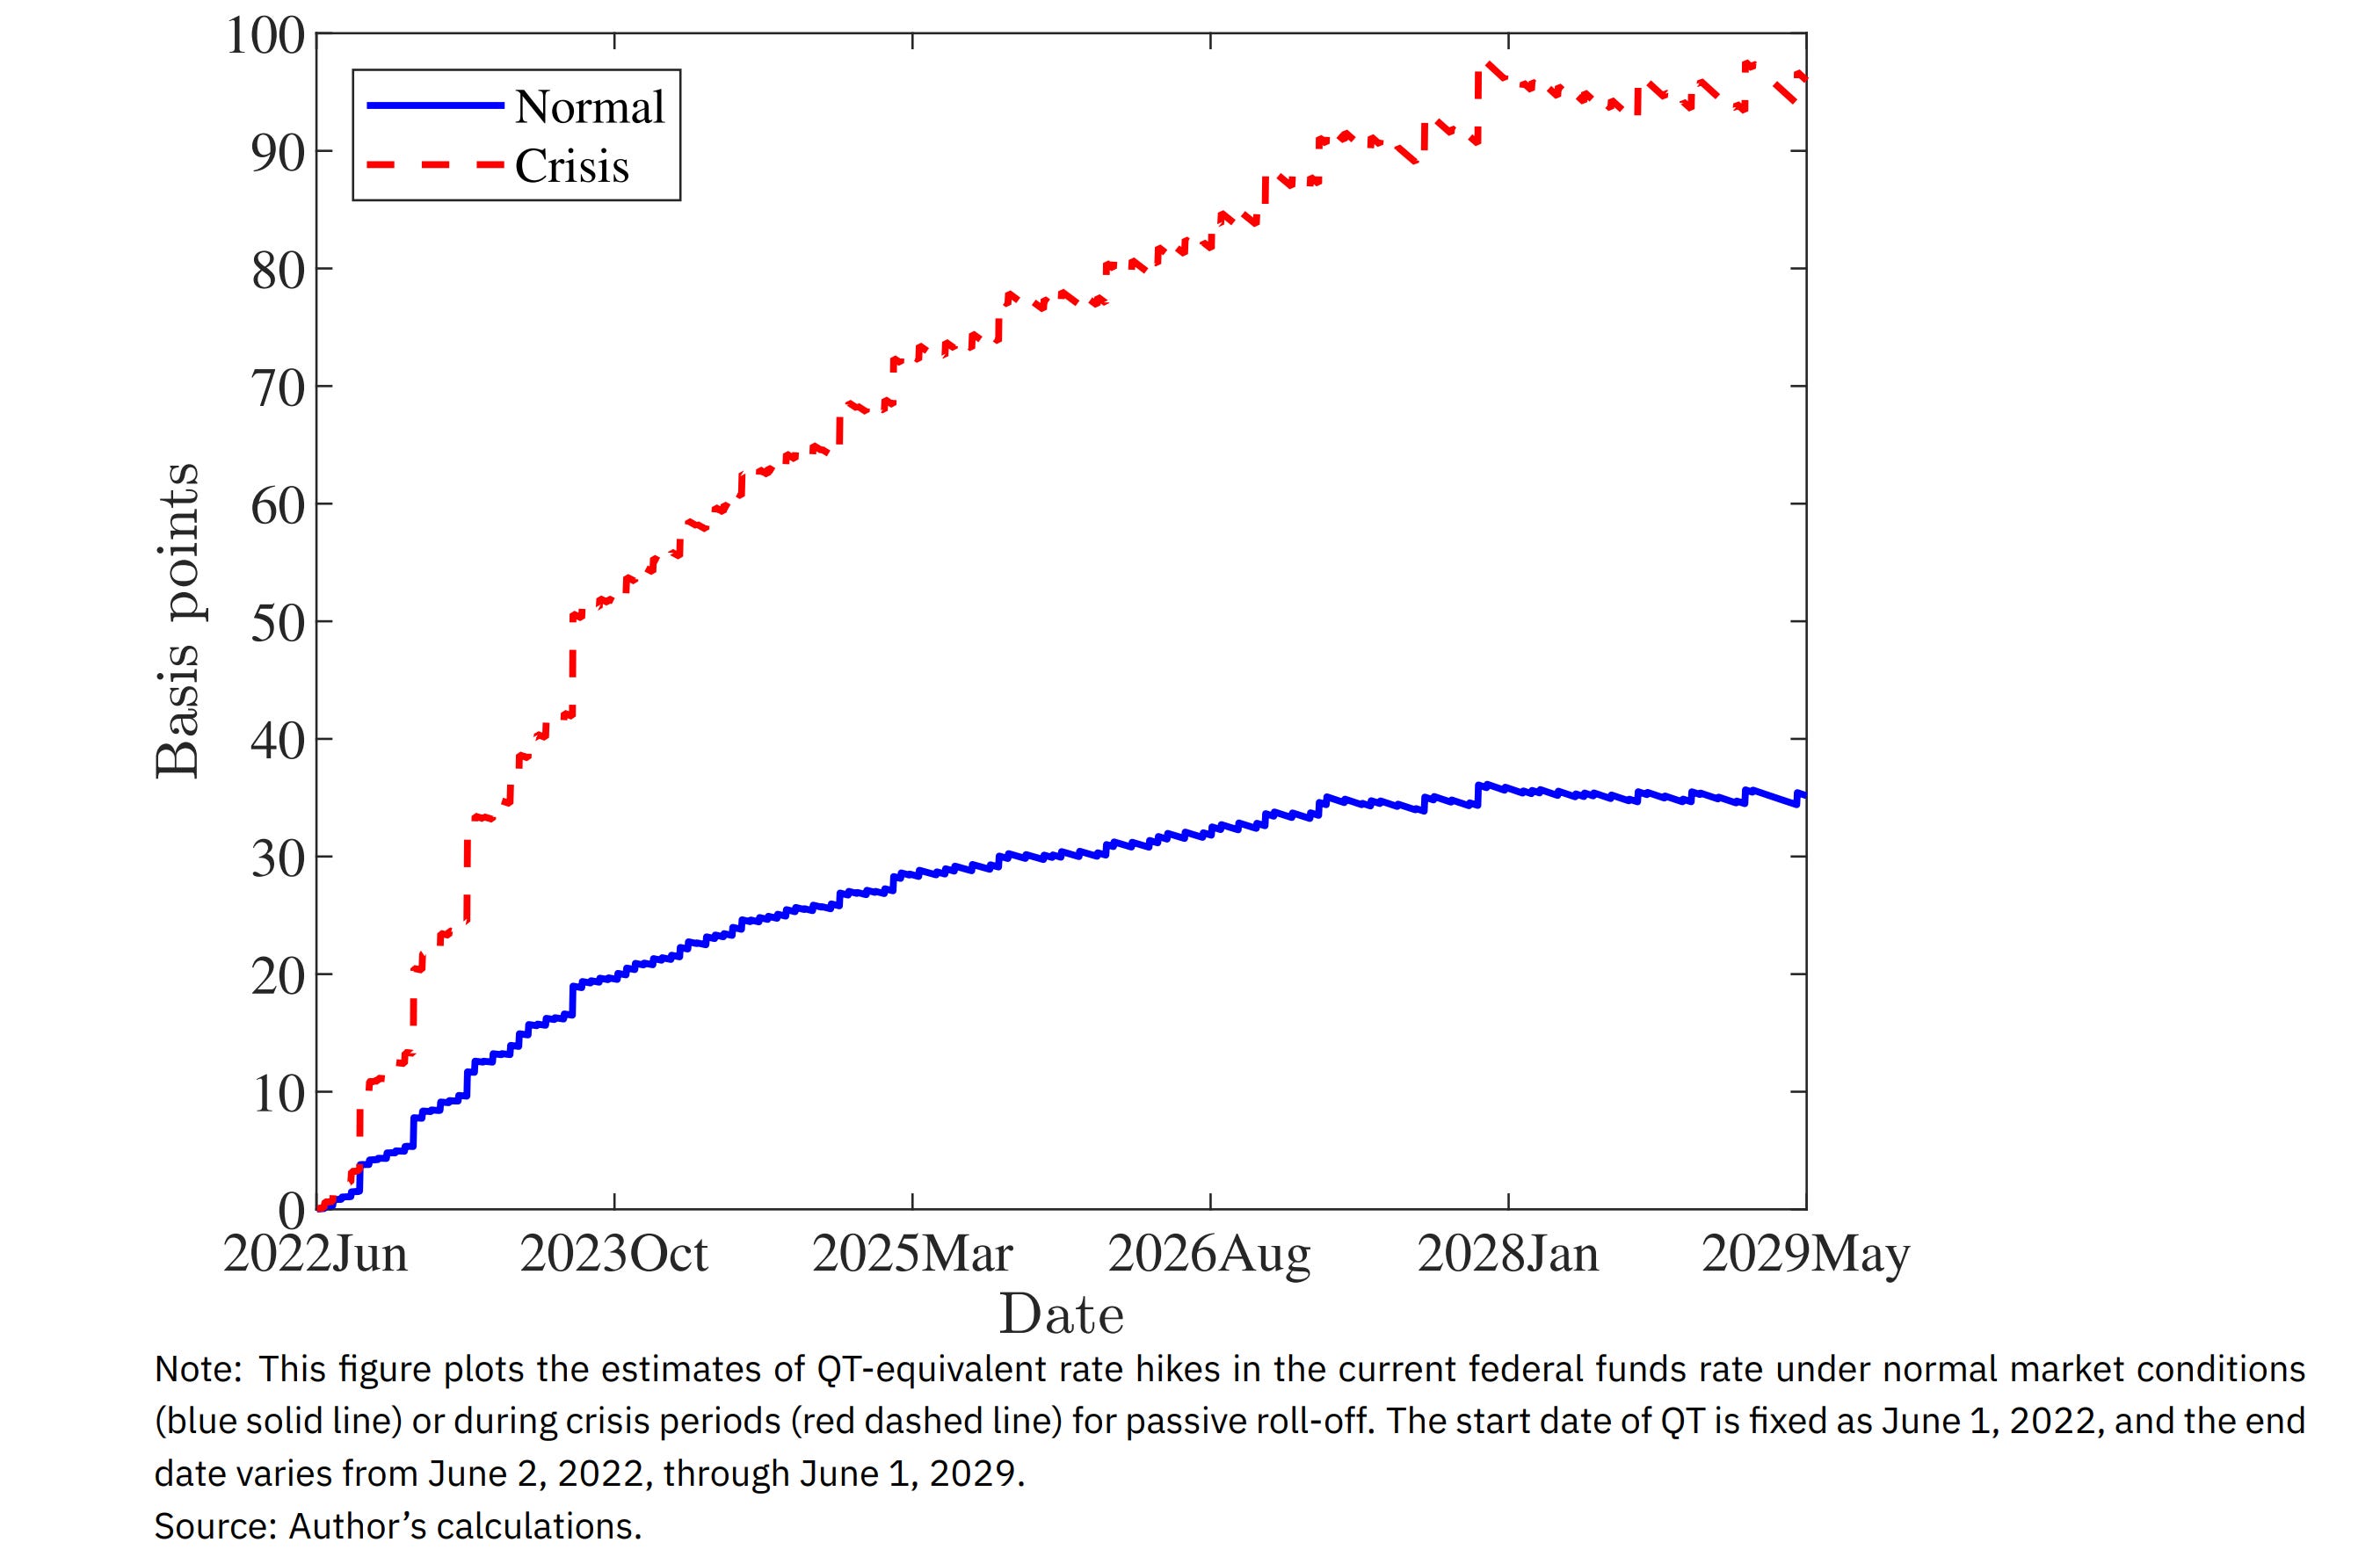
That hypothetical Government Bond rating change could cause another turmoil in the Government Bond market; the continued selling of United States Government Treasuries by China due to China's previously signaled reasons has caused FOMC officials to react to the effects of those measures by China in yields. China's shift from United States Government Treasuries to United States Agency Bonds has increased the Quantitative Tightening interest rate equivalency towards a “Crisis” scenario. The next two figures show China's shift from United States Government Treasuries to United States Agency Bonds and the interest rate equivalency of Quantitative Tightening in a “Normal” and “Crisis” scenario ( shown before ).
Figure 1. China Shifts To United States Agency Bonds From United States Treasuries.
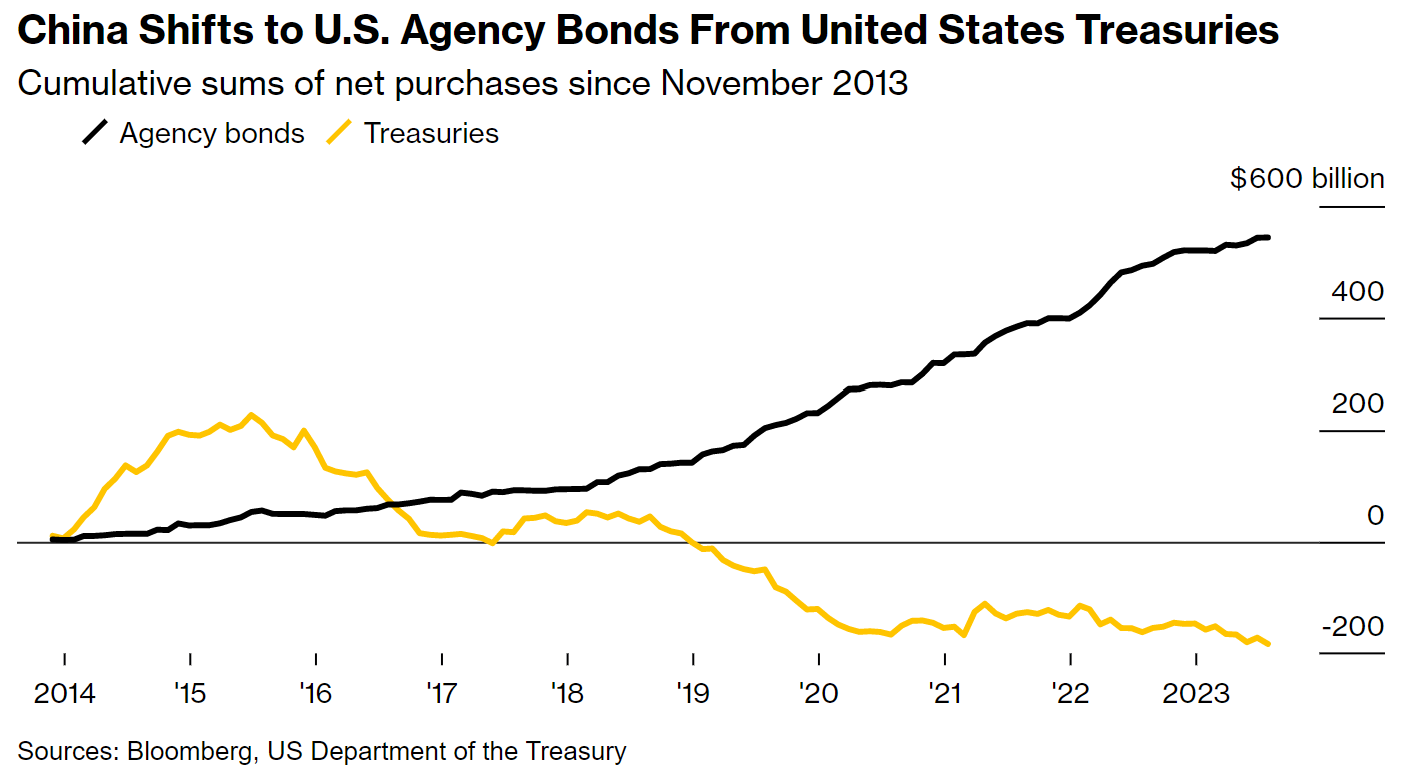
Figure 2. Monetary Policy Rate Equivalency Of Quantitative Tightening (QT) In A “Normal” And “Crisis” Scenario.
Inflation remains higher than the Federal Reserve's 2% target, while employment statistics remain strong, allowing FOMC members of the Federal Reserve to be focused on the price stability mandate of the Federal Reserve's dual mandate.
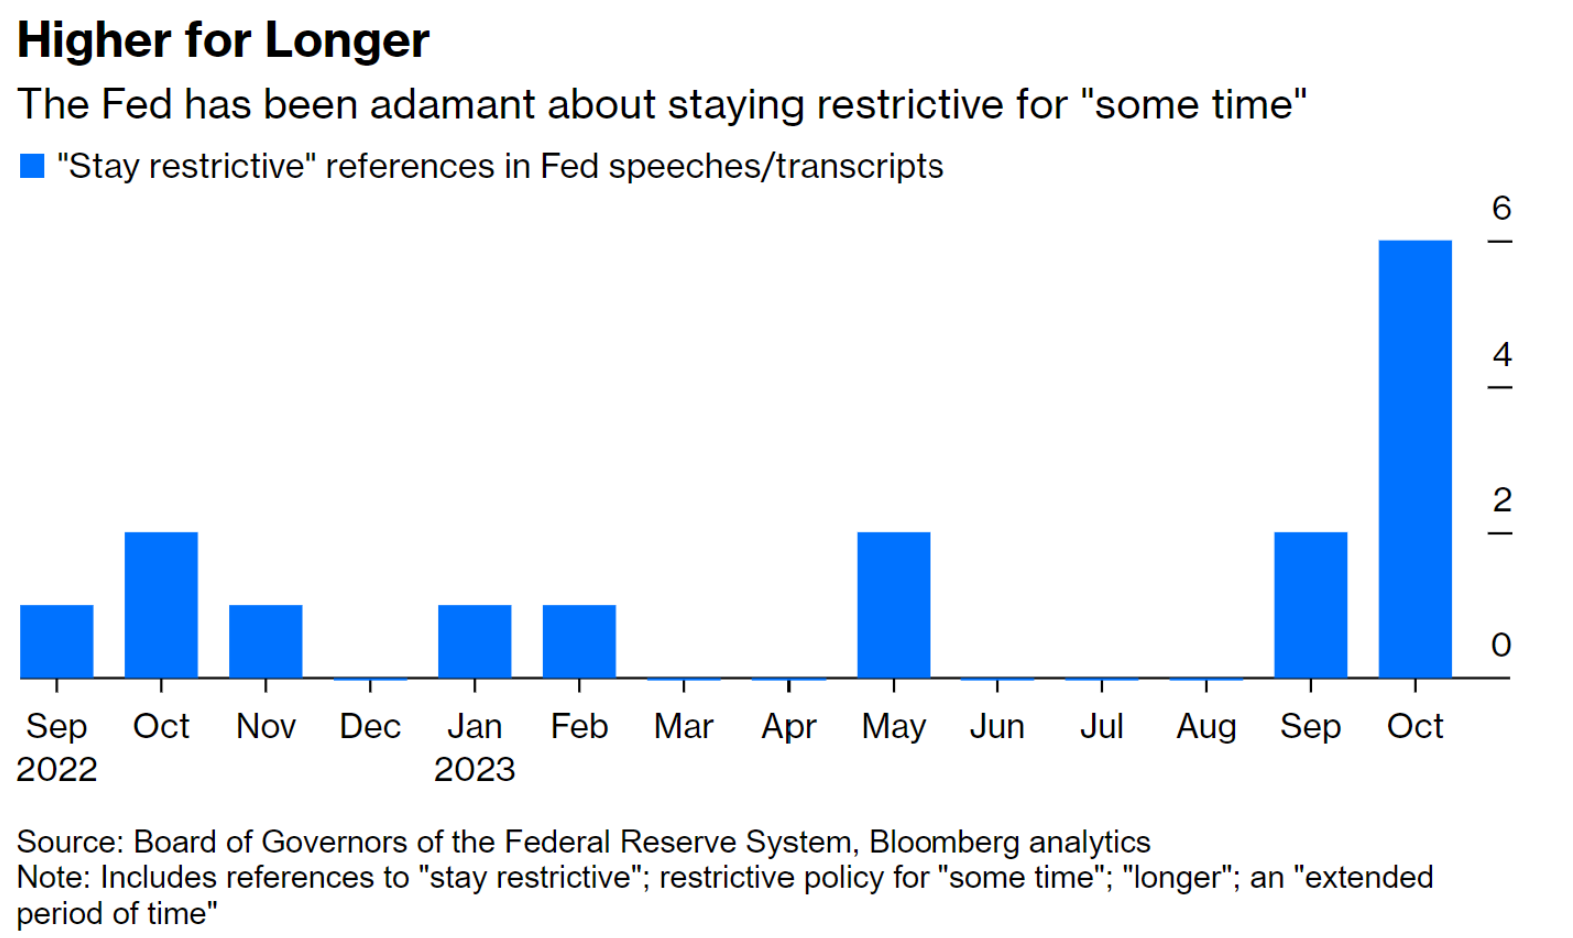
FOMC officials projections show a hawkish but nimble stance, in line with market expectations and previously signaled guidance. FOMC officials' statements remain hawkish; the next figure shows the increased references to monetary policy restrictiveness by FOMC Officials.
Figure 3. FOMC Officials Reiterate The “Higher For Longer“ Monetary Policy Stance.
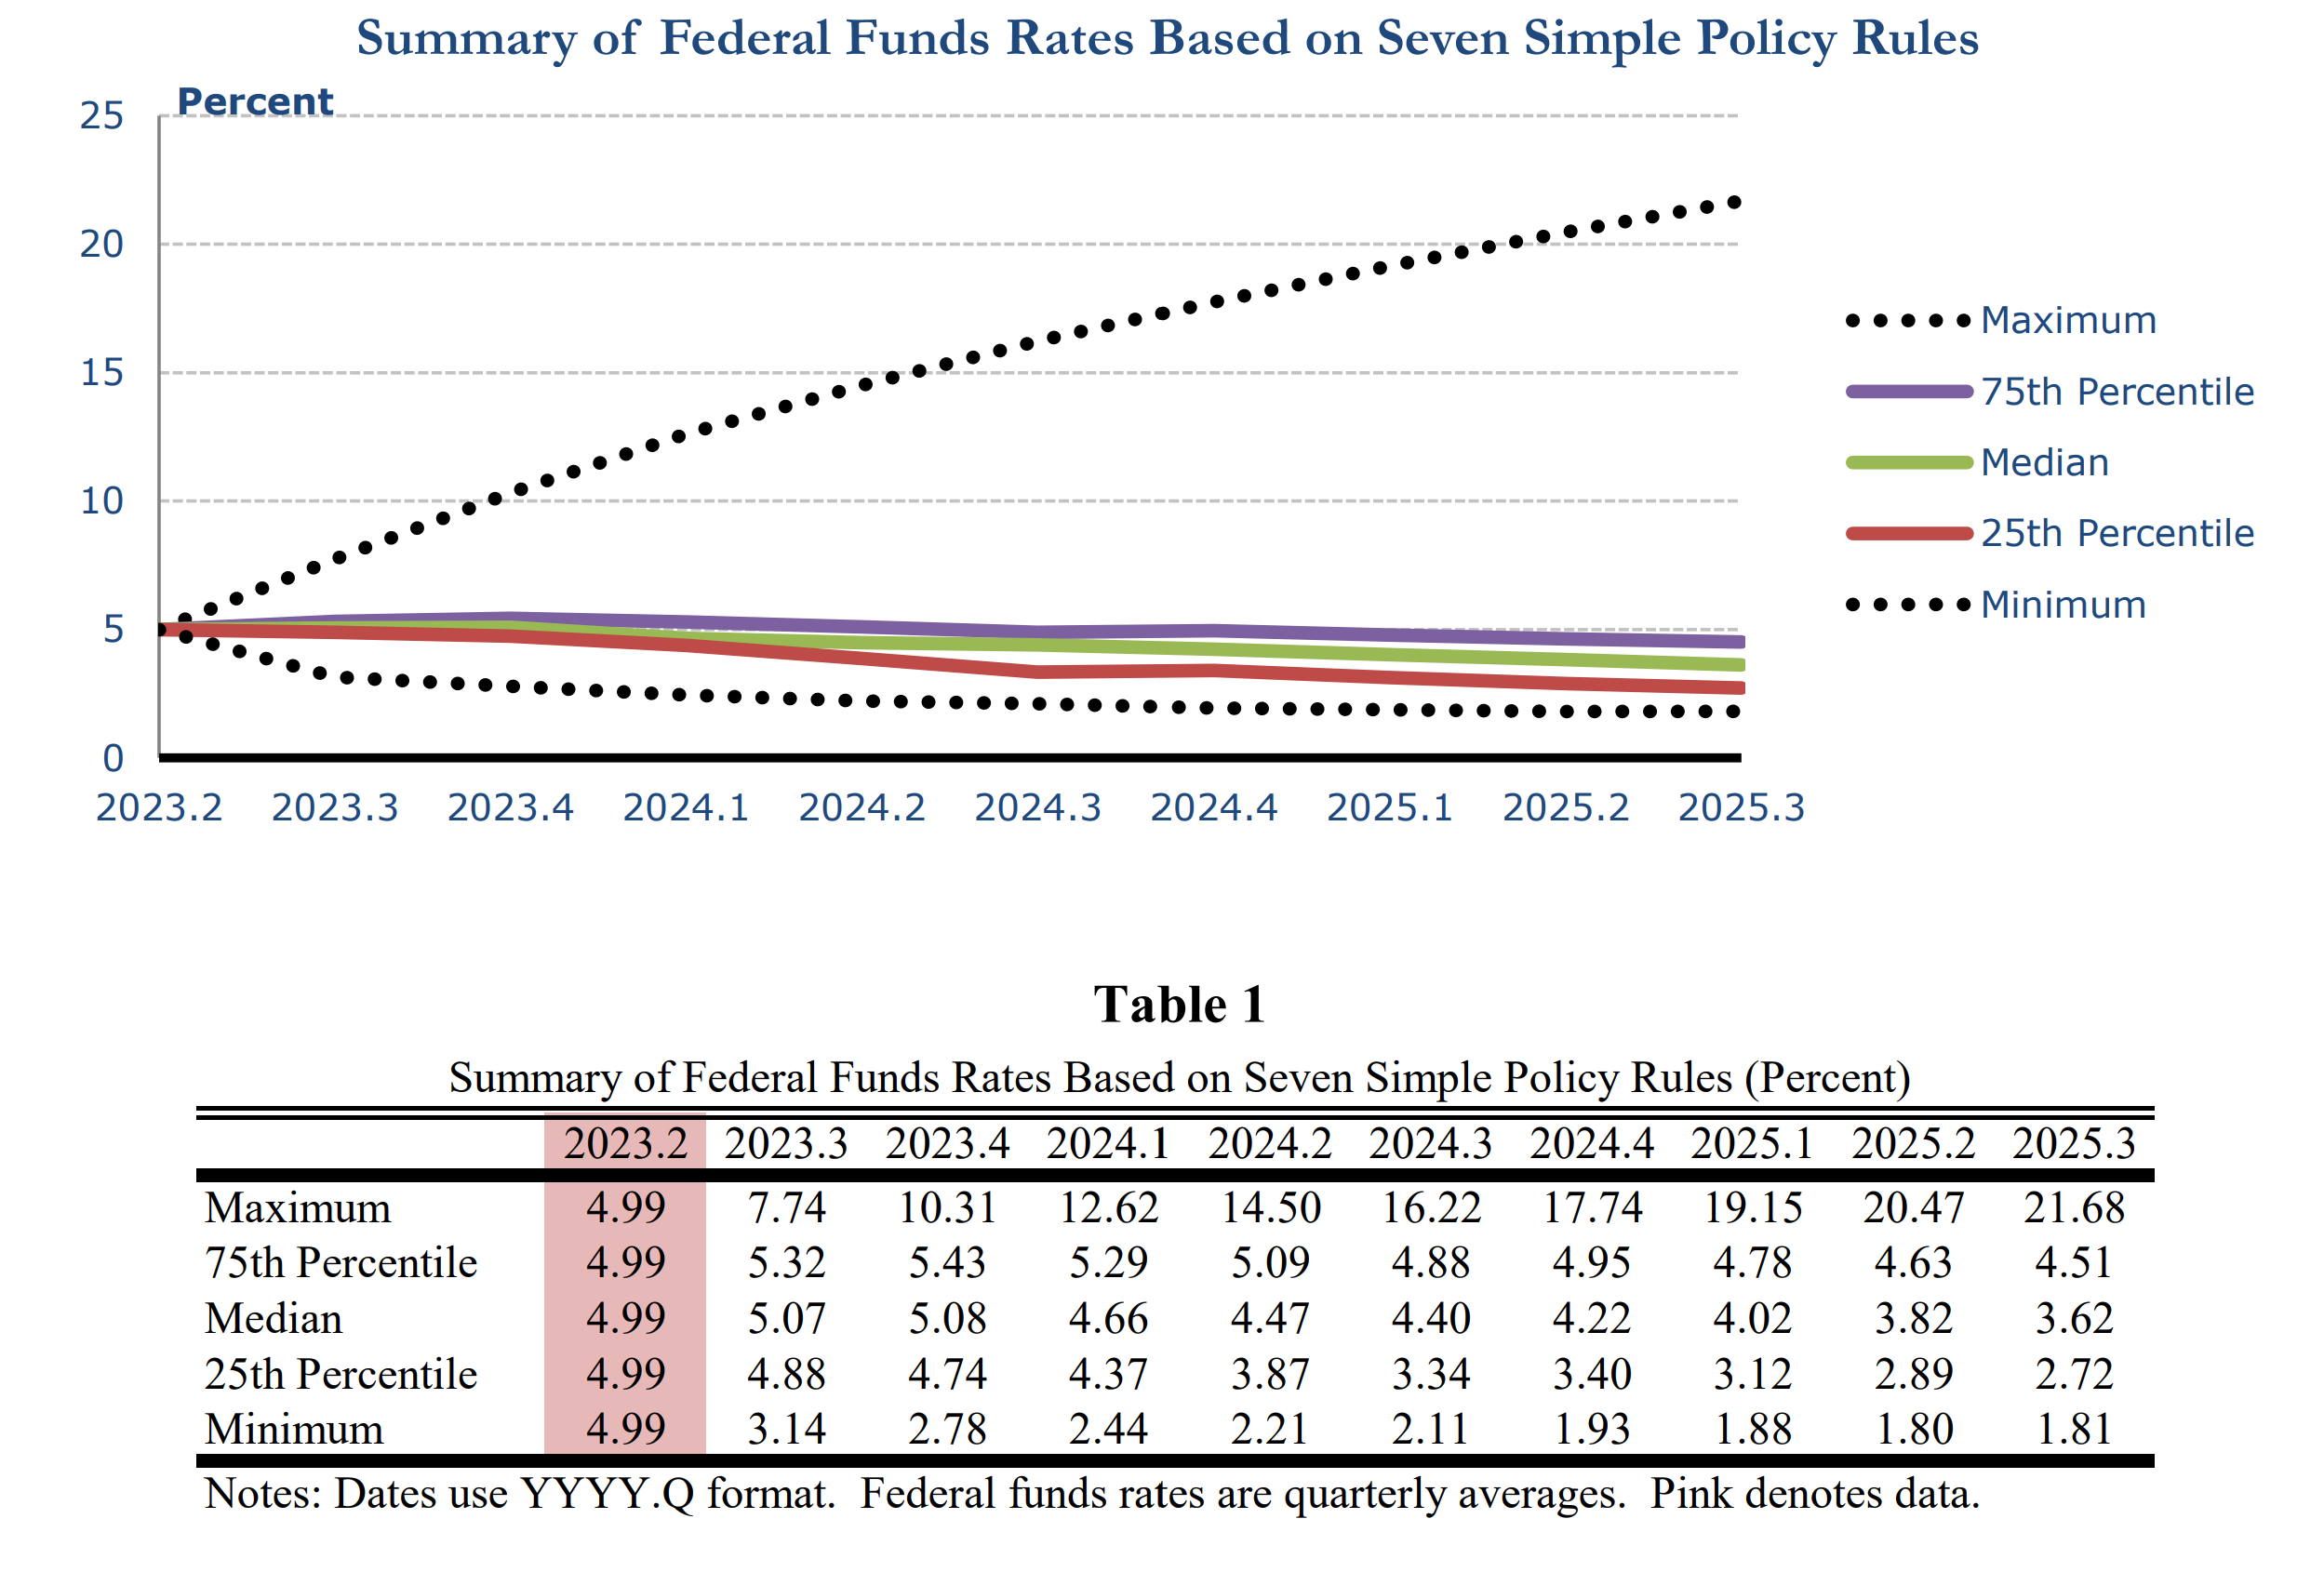
Interest rate models show that monetary policy is reaching its peak, but markets were recently pricing a higher peak rate and a higher neutral rate. The next two figures show FOMC projections over the Effective Federal Funds Rate and where interest rates should be using the Seven Simple Policy Rules.
Figure 4. FOMC projections over the Effective Federal Funds Rate.
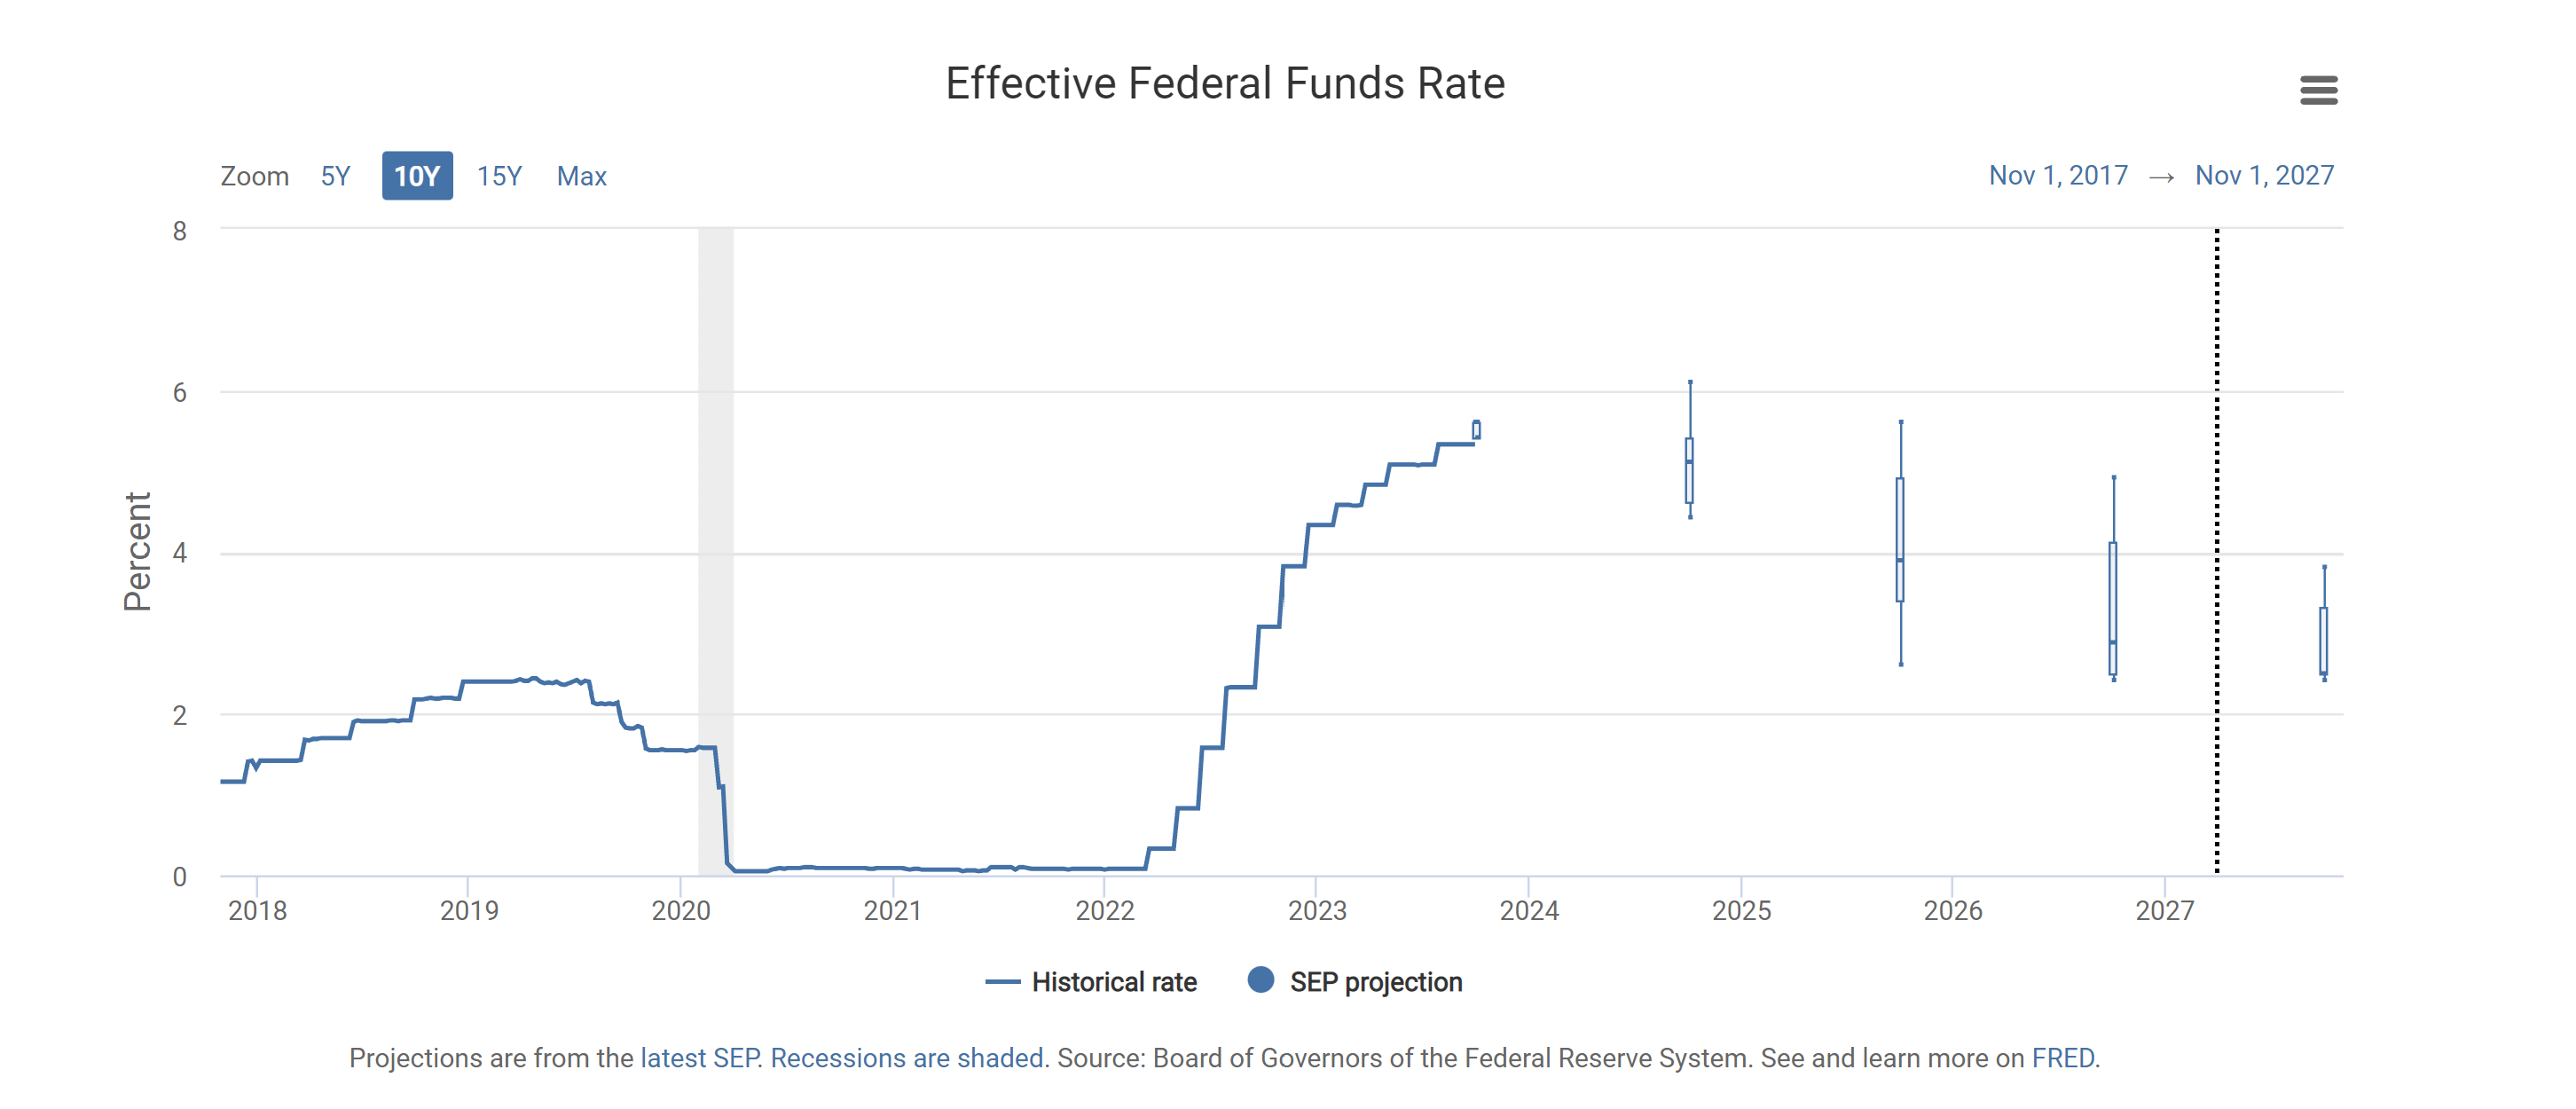
Figure 5. Summary of Federal Funds Rates Based on Seven Simple Policy Rules.
It's remarkable that the risk/reward in the United States Government Treasury Bonds market is high in either hawkish or dovish monetary policy rate changes; the next figure shows the current risk/reward in the United States Government Treasury Bonds market.
Figure 6. United States Government Treasury Bonds Market Risk/Reward.

Note: FOMC officials projections indicate no sign of rate cuts in the near-term ( as shown in the fourth figure ), but this data is something worth mentioning given recent turmoil.
Import and export prices have been uptrending since July 2023, indicating that supply chains may be having bottlenecks again. These bottlenecks can be seen in the Global Supply-Chain Pressure Index statistics. These statistics show further supply-side vectors of current and forward price pressures, but these statistics aren't the main vectors of current and forward supply-driven energy price inflation.
The current and forward supply-driven energy price inflation is still vectored by higher liquid fuel consumption than production; the next figure shows the updated projections from the last time shown.
Figure 7. World Liquid Fuels Consumption Is Expected To Keep Its Trend Above Liquid Fuels Production.
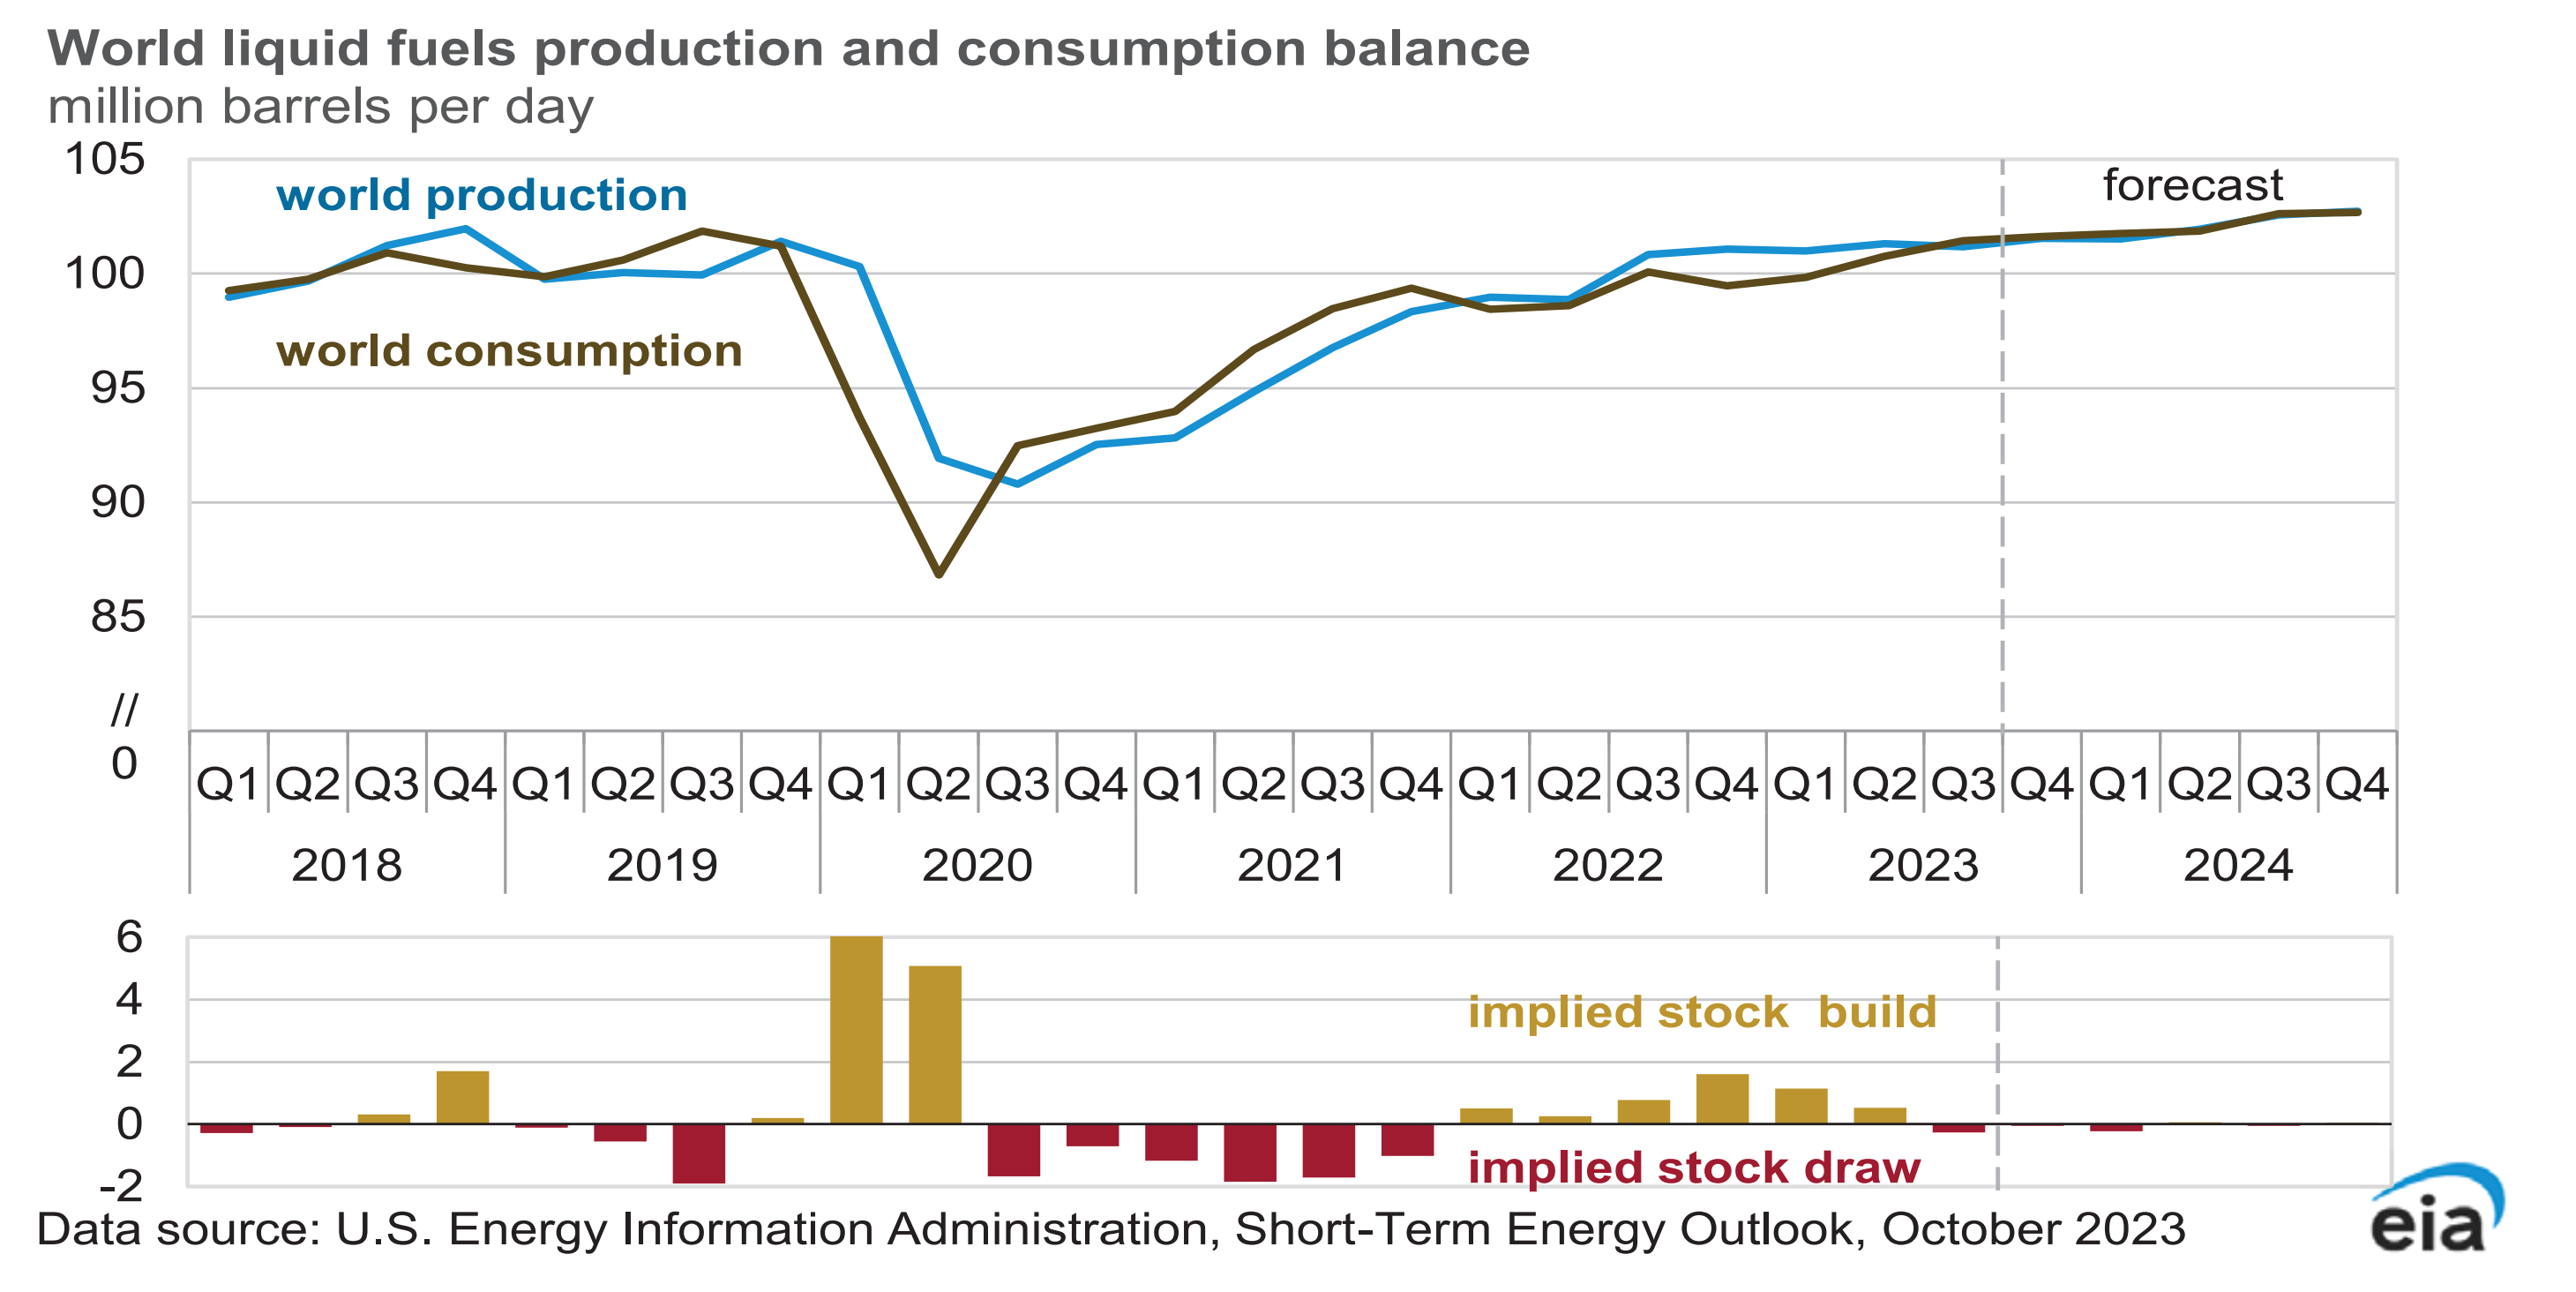
It is notable the change in production in the United States, but it still can't replace the Organization of the Petroleum Exporting Countries Plus (OPEC+) output cuts; therefore, expectations remain the same.
Europe:
European countries measures towards ensuring key commodity supply from Norway have and are ensuring stability in the Euro Area; unlike in the United States, Europe doesn't have much supply-driven energy price inflation given the stable supply of key energy sector commodities from Norway to European countries; this is reflected in European inflation statistics.
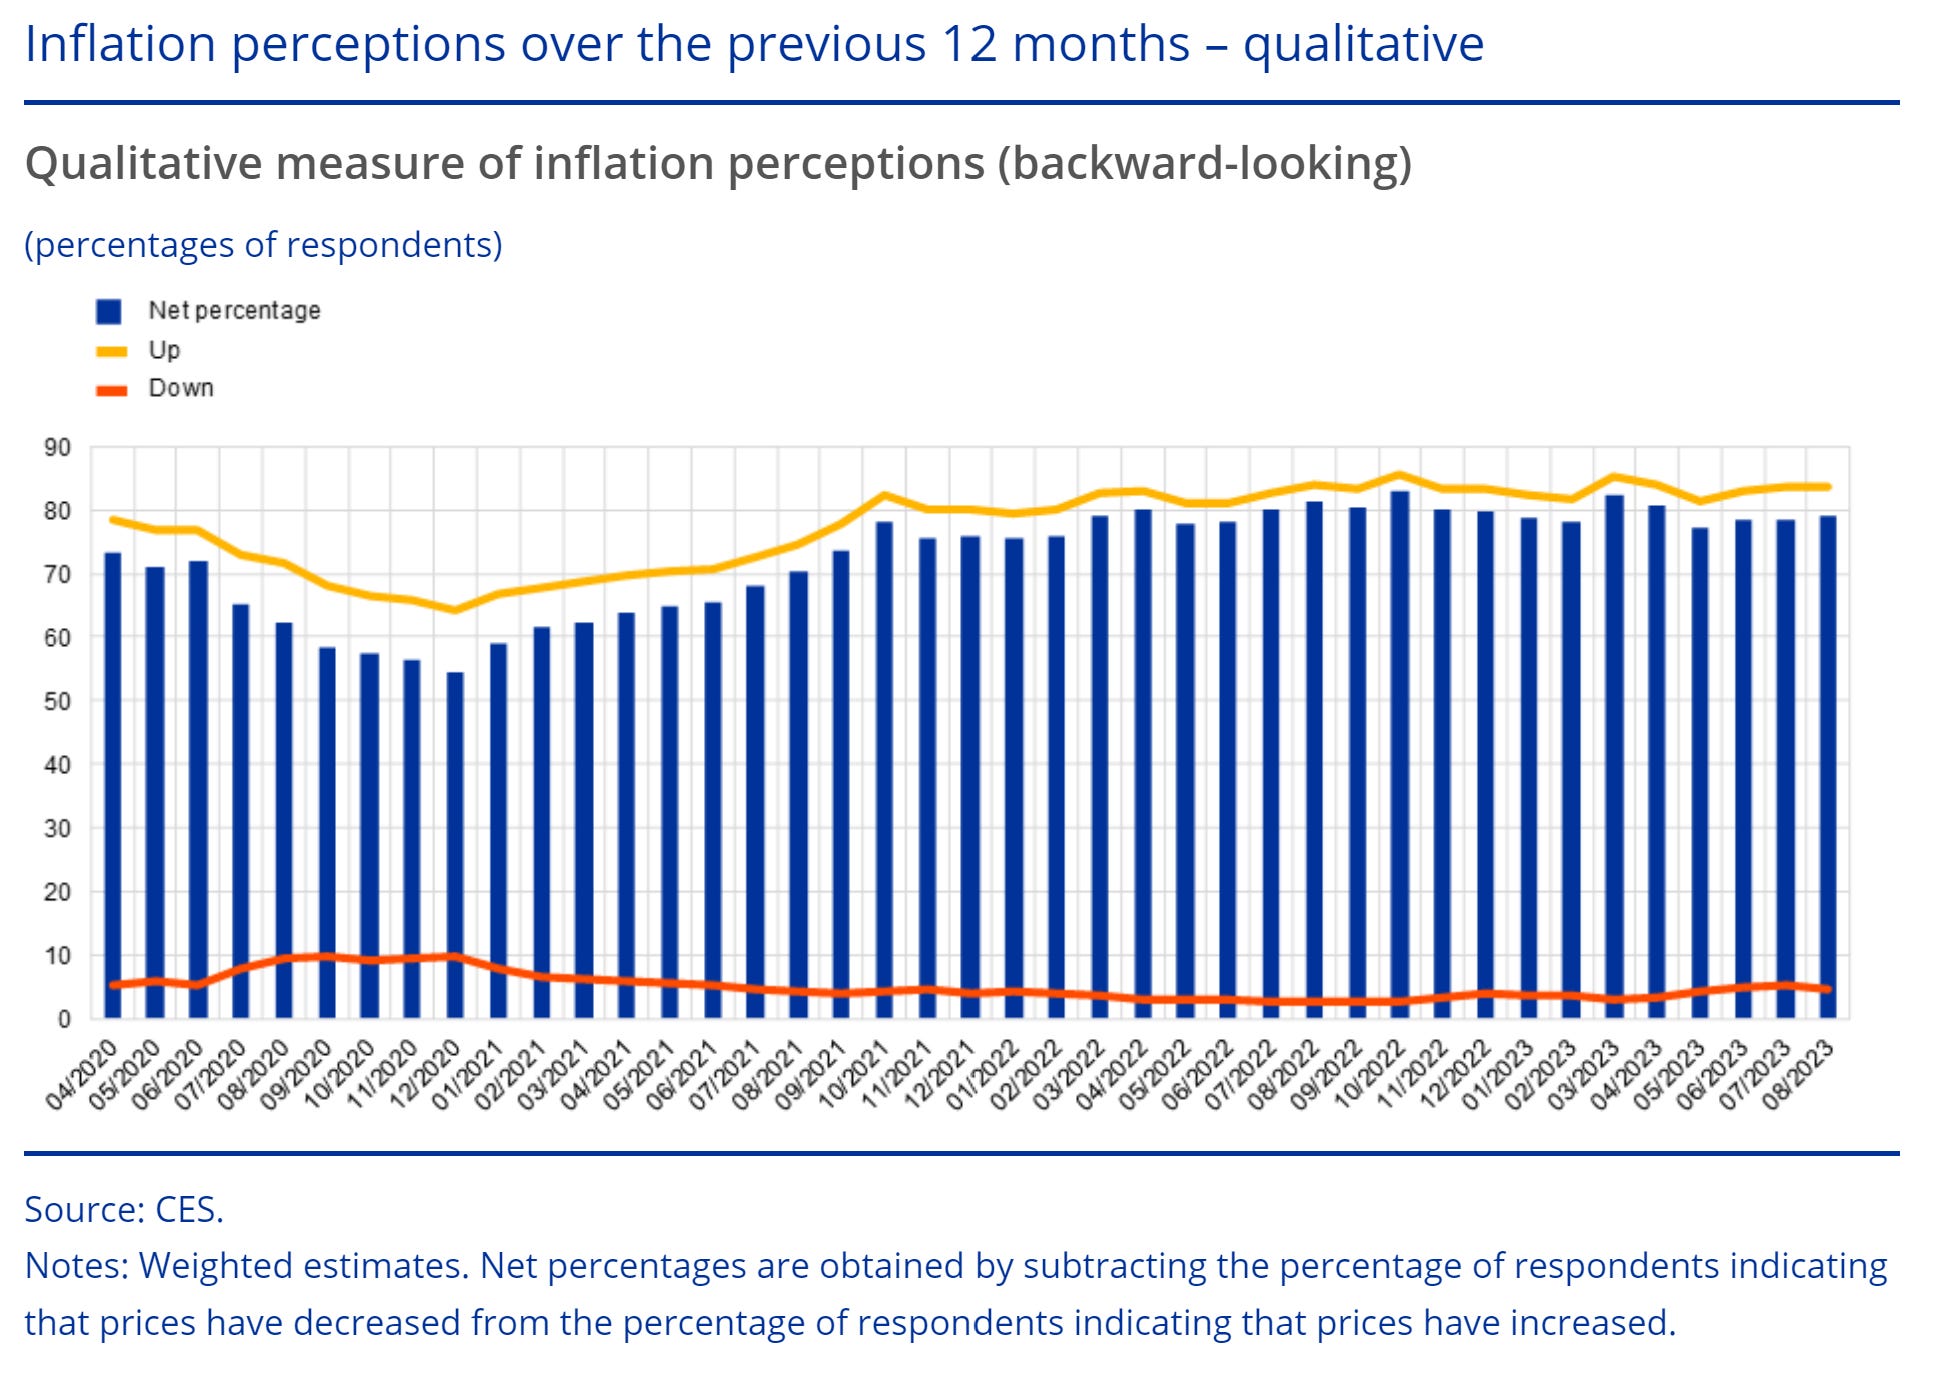
Although core inflation remains higher than the European Central Bank's inflation target, this is something that Ms. Lagarde has noted in various statements. The European Central Bank's macroeconomic projections are realistic. The next figure shows the latest statistics from the European Central Bank's Consumer Expectations Survey which showed increased inflation perceptions and expectations.
Figure 8. European Inflation Perceptions Statistics.
The Euro Area unemployment rate at 6.4% which is a historical low, allows the European Central Bank to be focused on price stability; as no harm is being done by the interest rate increases, further monetary policy measures are expected given the fact that Eurozone inflation is higher than the European Central Bank's 2% inflation target.
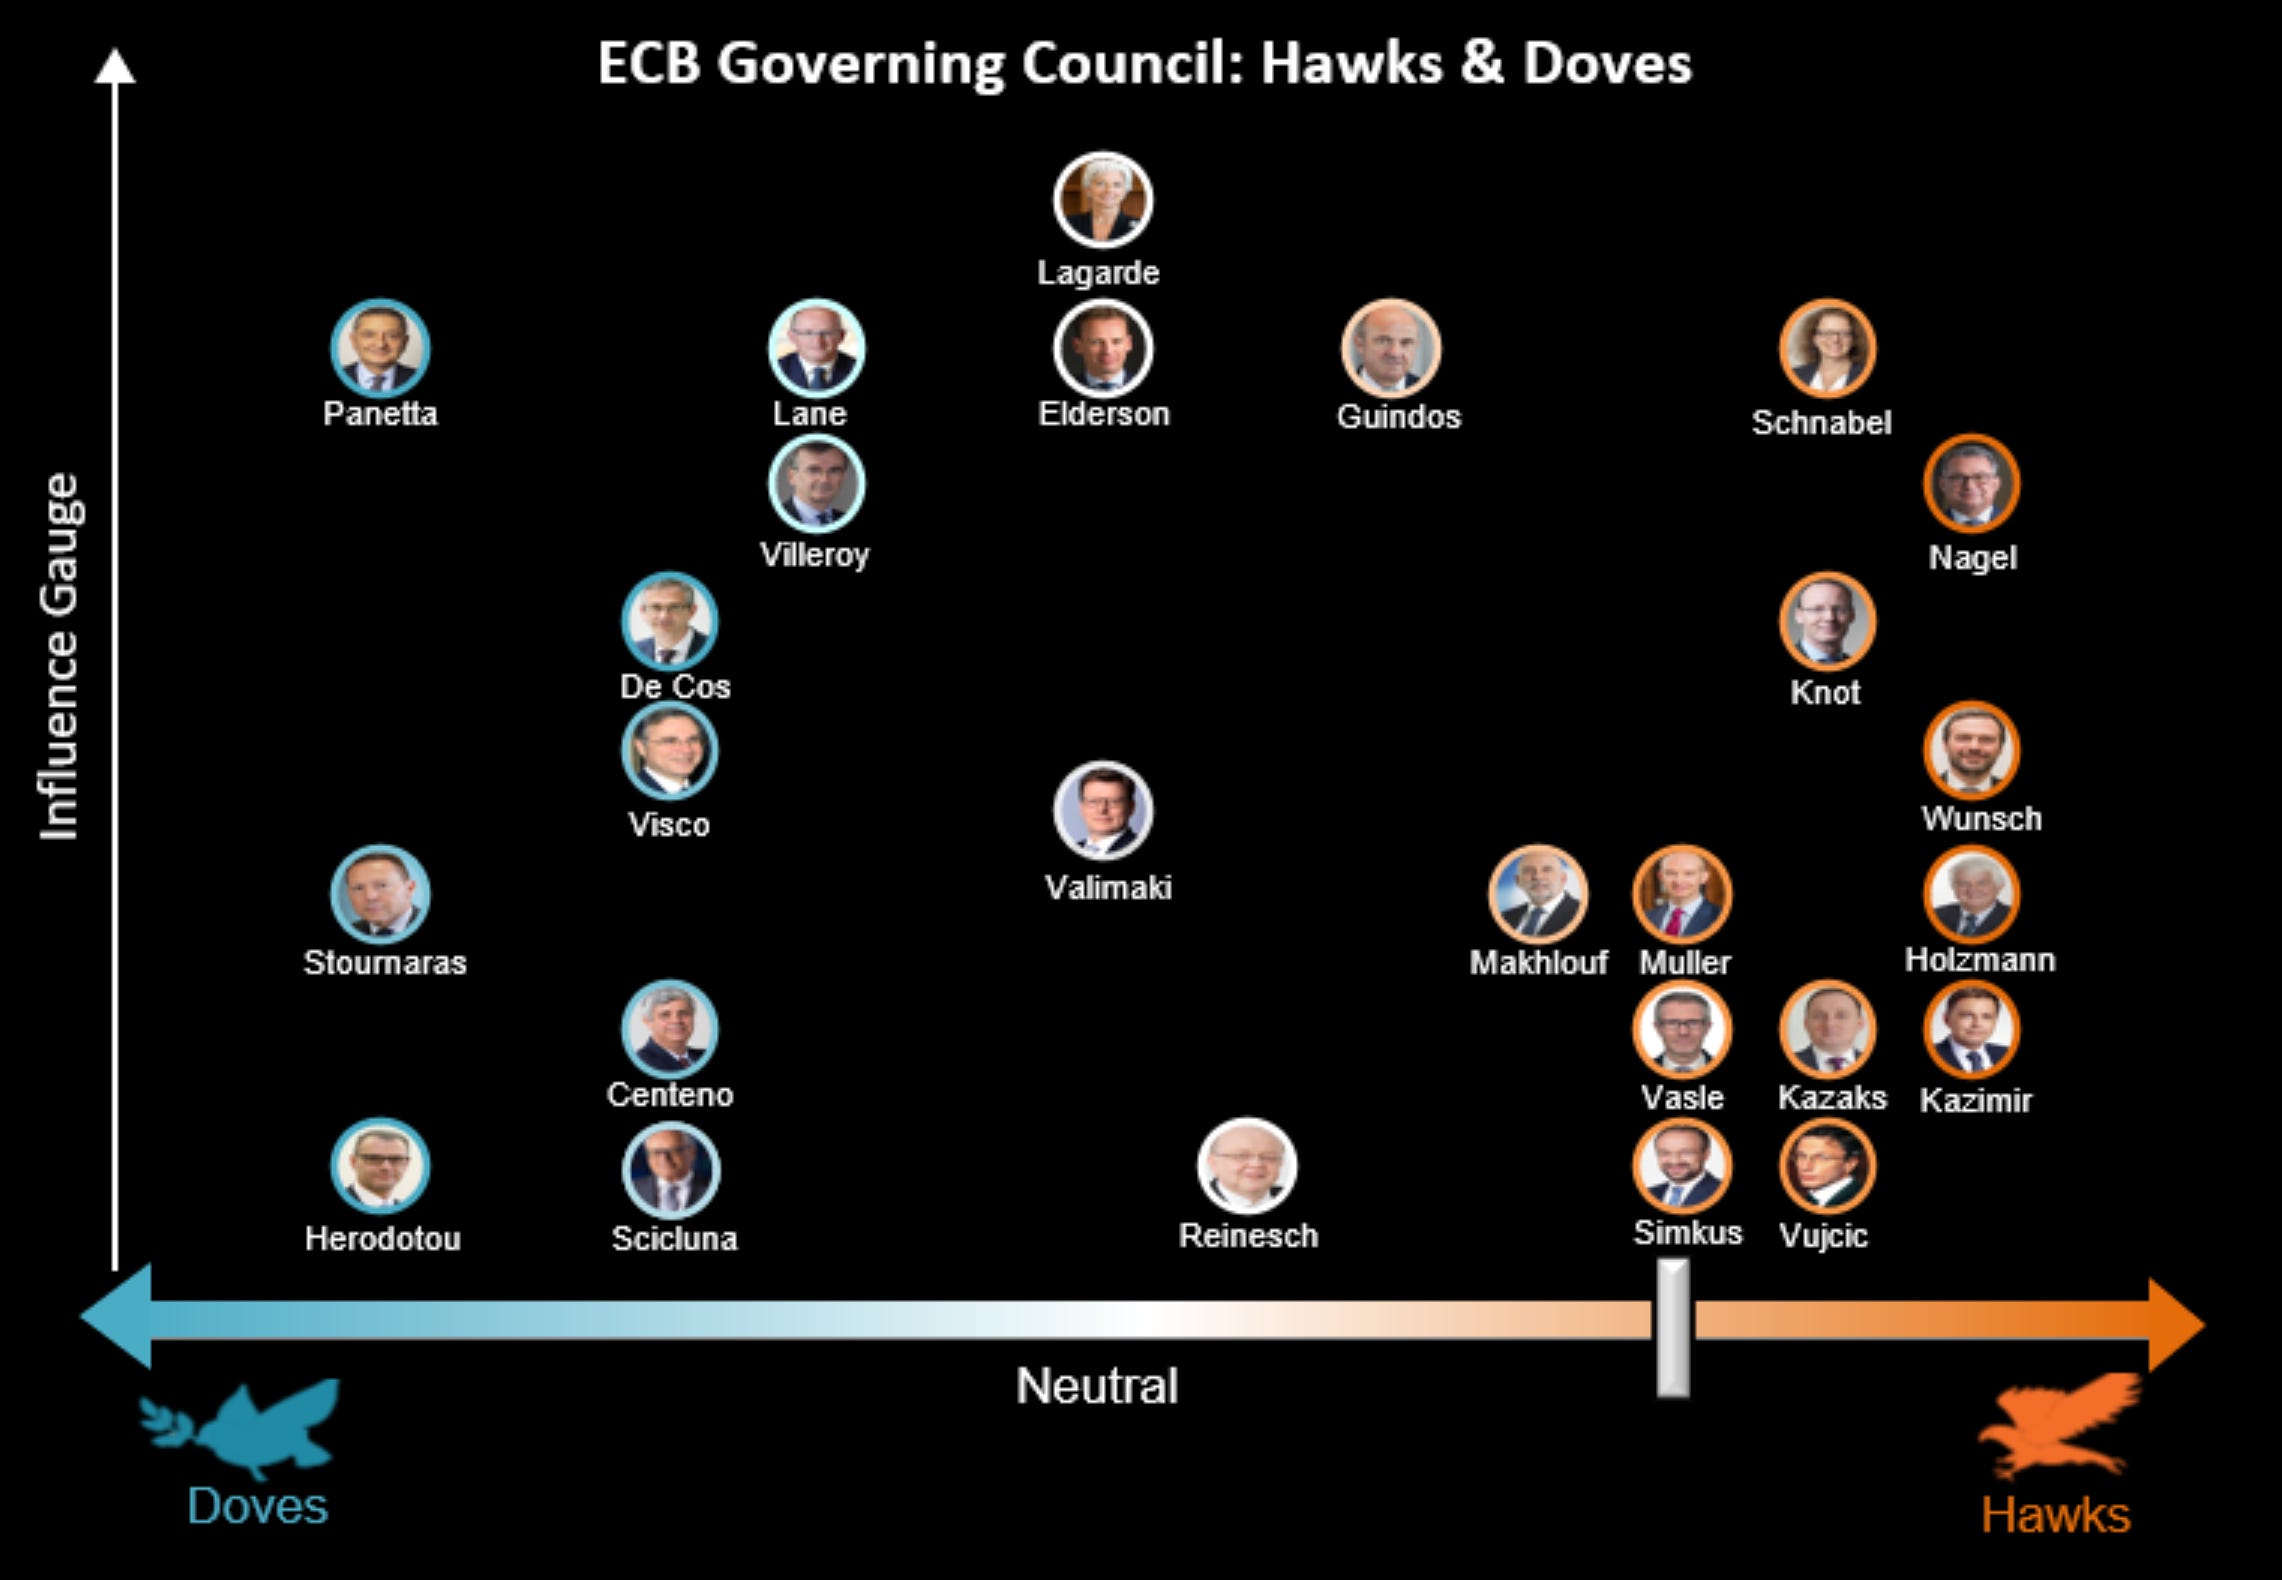
The European Central Bank’s Governing Council doves and hawks haven't changed their stance, although rate-cut expectations remain the same. By late Q3 2024 (September 2024), rate cuts are expected, in line with economists' forecasts, although if Eurozone countries perform better than expectations, the higher for longer monetary policy stance should be expected in Europe.
Figure 9. European Central Bank’s Governing Council Doves And Hawks.
Ms. Lagarde's recent comments at the International Monetary and Financial Committee showed a hawkish but nimble monetary policy stance, which confirmed the forward monetary policy stance, but the latest European Central Bank Minutes release showed the contrary stance, indicating a dovish pause for the next monetary policy decision but a plausible rate hike at the December monetary policy decision. Markets priced in that monetary policy stance and repriced the previously frontloaded monetary policy stance, the market-expected European Central Bank peak rate priced in the €STR curve is now 5.75% ( Note: Data as of Friday 13th of October 2023 market close. ) from the previously peak rate of almost 6%.
Figure 10. Market Expectations Over The European Central Bank Monetary Policy Rate.

Positioning in European markets remains the same, as monetary policy measures and forward guidance remain within the range of expectations and European economies perform as expected.
United Kingdom:
The United Kingdom's economy is performing within the range of expectations; this performance is a result of the Bank of England's monetary policy measures that are ensuring that the United Kingdom's inflation gets to the Bank of England's 2% inflation target and PM Sunak's fiscal and legislative policy measures that are ensuring stable and secure growth in the United Kingdom.
The cooling job market in the United Kingdom is somewhat concerning, but that slowdown in the job market data is seasonal and isn't broad-based. Those worries are shadowed by strong statistics, although recent comments by the Bank of England's Andrew Bailey suggested that the slowdown in the job market complicates monetary policy and that interest rates are likely to remain around the current monetary policy rate.
The United Kingdom's inflation remains higher than the Bank of England's 2% goal; hence, monetary policy is expected to remain restrictive but nimble given recent employment statistics. Markets priced in the change in the monetary policy stance and repriced the previously frontloaded monetary policy stance, alike to Europe, the market-expected Bank of England peak rate priced in the SONIA curve is now almost 5.5% ( Note: Data as of Friday 13th of October 2023 market close. ) from the previously peak rate of almost 6.2%.
Figure 11. Market Expectations Over The Bank Of England Monetary Policy Rate.

Positioning in the United Kingdom's markets remains the same; as monetary policy measures and forward guidance remain within the range of expectations and the United Kingdom's economy performs as expected, the lower peak monetary policy rate gives markets upside.
Asia:
China:
China's economy is performing within expectations, given the strong fiscal policy measures focused on ensuring a steady recovery of the Chinese economy from the pandemic are keeping the forecasts for the Chinese economy high.
The People's Bank of China's monetary policy measures are ensuring that the Chinese economy doesn't enter a recession. Geopolitics remain a factor that alters forecasts for the Chinese economy; remarkable developments in the Indo-Pacific region suggest that China may be willing to take the millitary path towards addressing regional interests.
Recent comments by the People's Bank of China's governor 潘功胜 indicated that monetary policy will maintain its stance; remarks over the Chinese economy suggested that the Chinese government keeps its fiscal policy expansion without altering monetary policy measures.
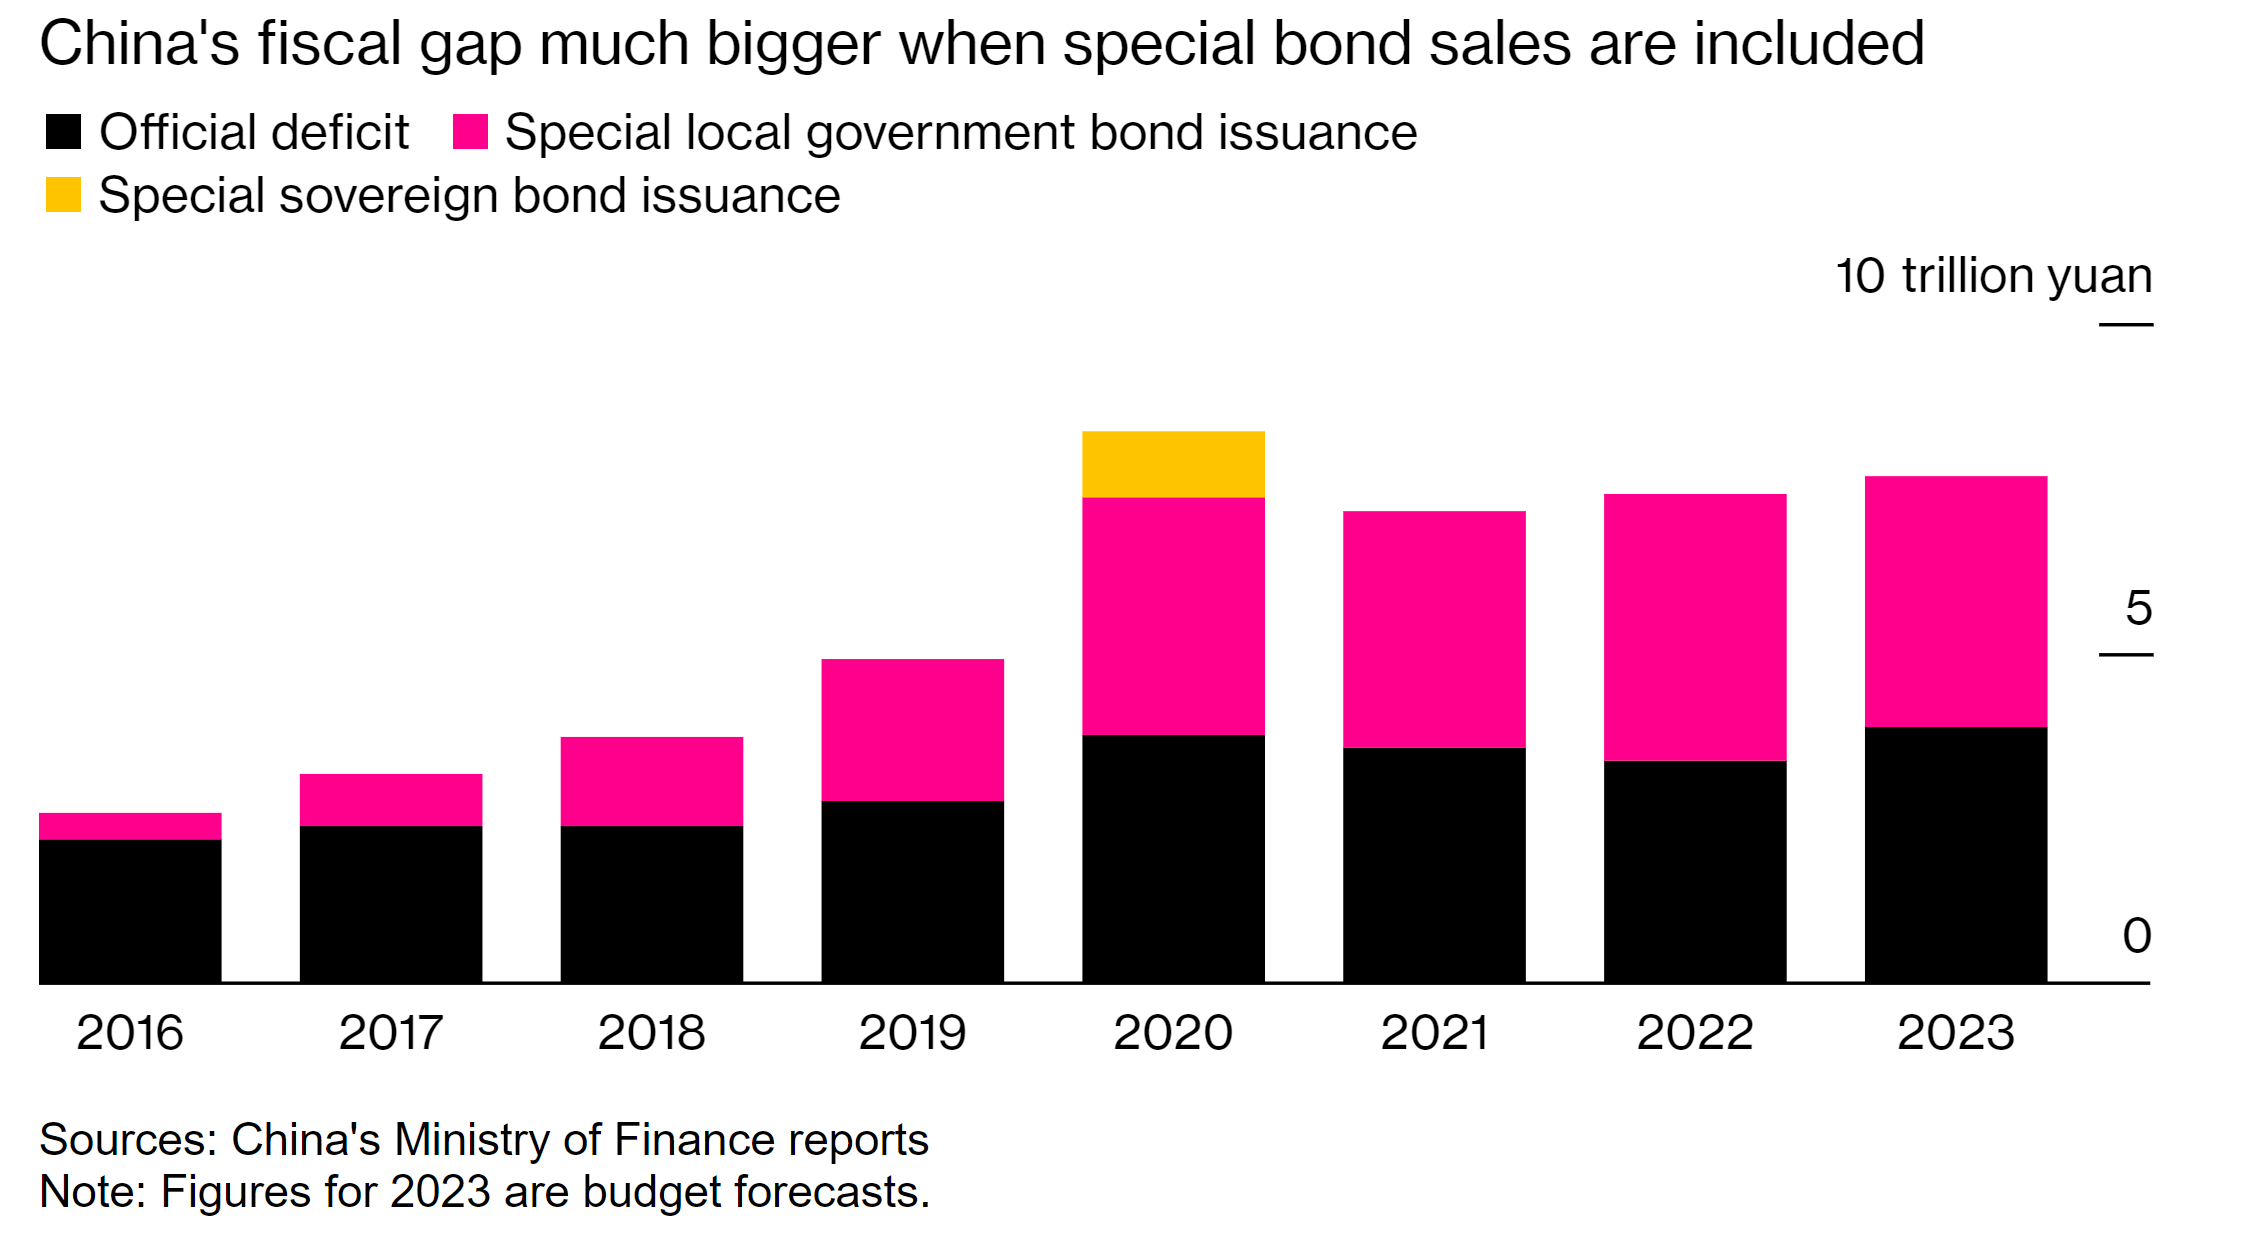
Recent Chinese government fiscal policy measures widened the government budget deficit; that statistic was supported by the People's Bank of China's governor 潘功胜, which lowered worries over it.
Figure 12. China’s Government Budget Deficit.
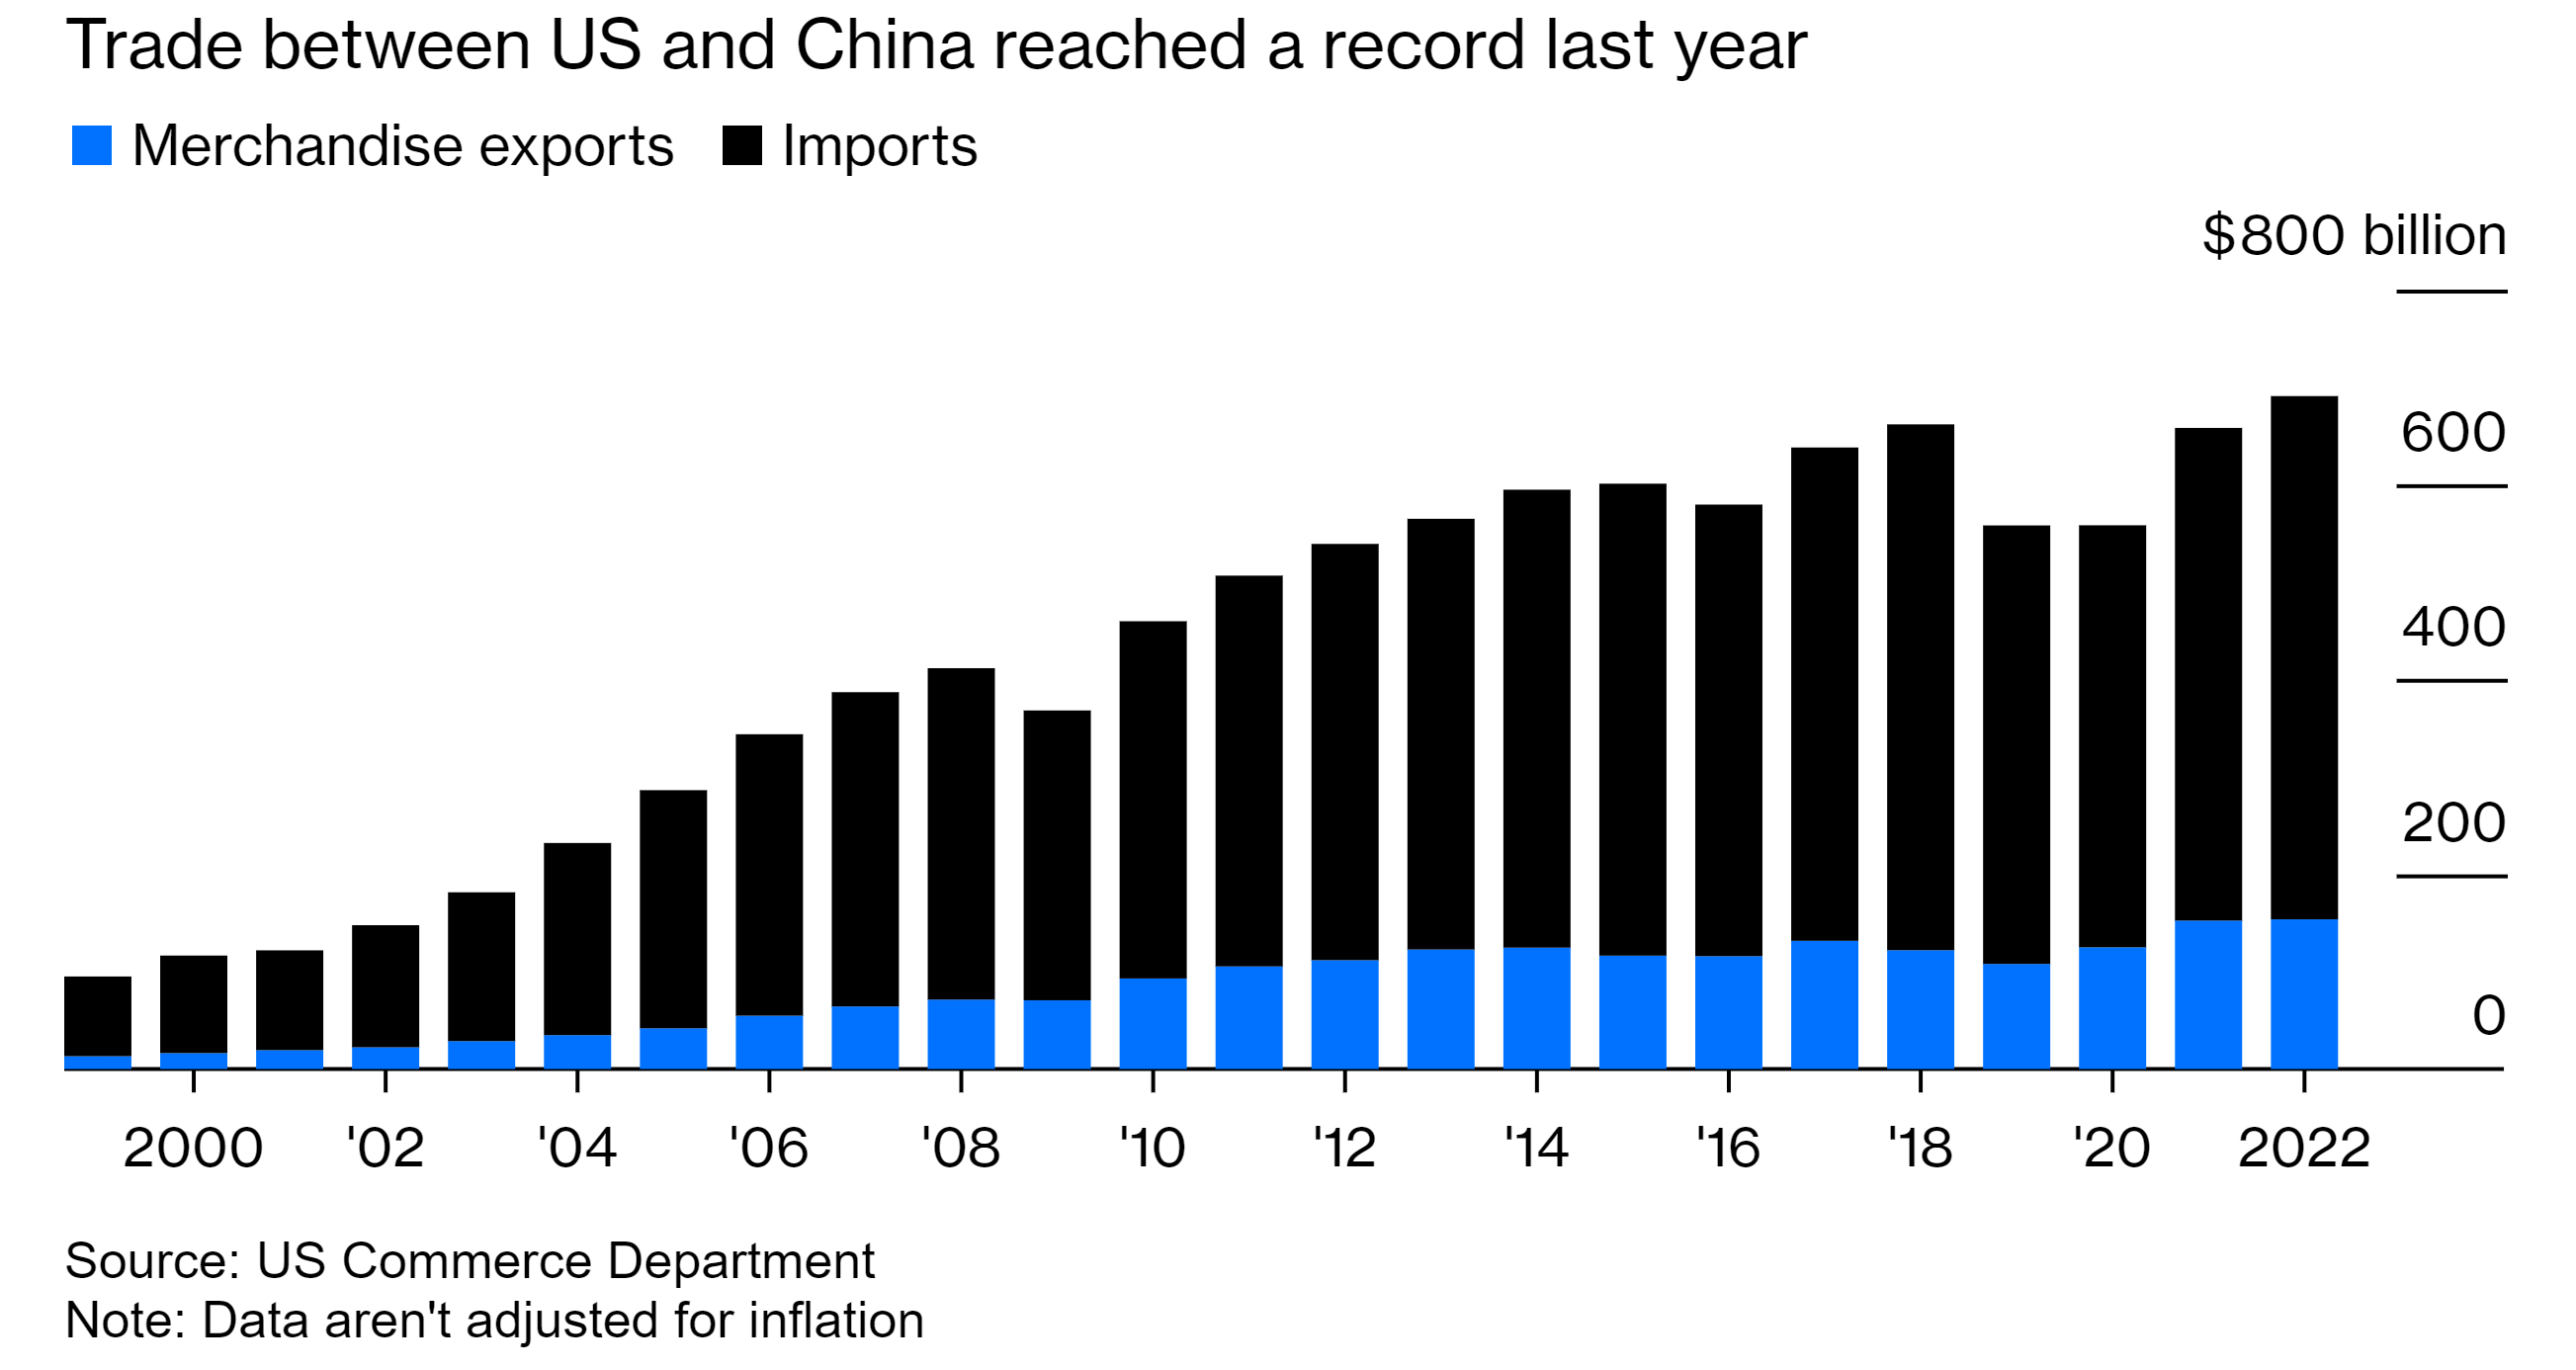
Geopolitical tensions remain high, but recent China's global trade statistics showed that it reached a record last year, as shown in the next figure.
Figure 13. Trade Between US And China Reached A Record Last Year.
Recent comments by the People's Republic of China's 习近平 indicated further erosion of relations between the West and China. 习近平's efforts towards making the West accept the "multipolar world" seem to be in vain. With six new members added to the BRICS alliance, some of whom are currently at high risk of geopolitical war with the West, prospects over geopolitics remain the same.
Japan:
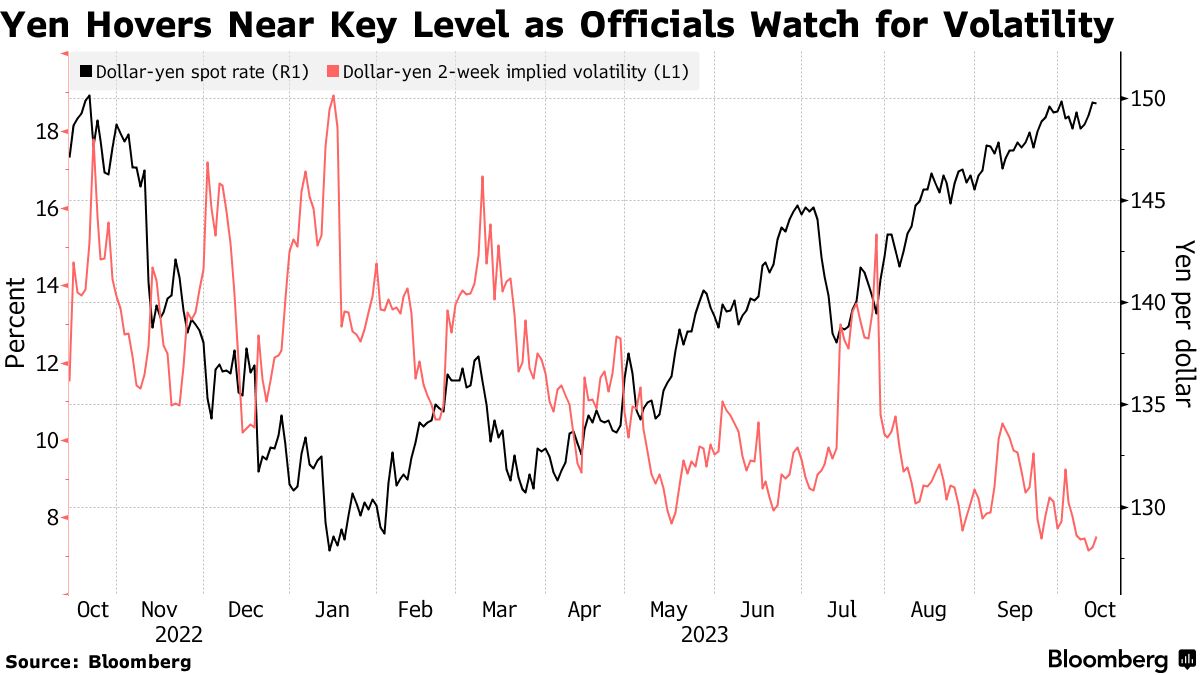
The Japanese economy is performing as expected; recent comments by the Bank of Japan's Seisaku Kameda indicated that the Japanese economy will continue to keep the current trend. Increased Japanese Yen devaluation puts the Japanese economy at risk; goods prices increase by five to six percent every time the Japanese Yen devalues. In dollar terms, the Japanese market is cheap; but in Japanese Yen terms, the Japanese Yen devaluation is eroding consumers' purchasing power, the next figure shows the Japanese Yen devaluation.
Figure 14. Japanese Yen Devaluation.

The increased volatility of the Japanese Yen makes the Bank of Japan's open market operations difficult. The Bank of Japan may have to increase the interest rates in order to stabilize the Japanese Yen; if not further devaluation is more than plausible, the Japanese government's fiscal policy measures will more than likely contribute to further devaluation of the Yen. Until the Bank of Japan increases the interest rates, open market operations by the Bank of Japan will keep having a minimal or just temporary effect.
Do feel free, as it’s free, to share, leave a comment, and subscribe to Quantuan Research Substack if you want, by using the next buttons.
It's not about the money (the research is free); it's about sending a message (delivering alpha to the reader).