


Next Week's Move. ( Second Week of 2024 )
Expectations And Analysis Of Current And Forward Data.

From now on, there will likely be a weekly post with expectations over the data releases of the week after and speculative events expected in markets based on recent news and statistics; the section or post name will be Next Week’s Move; but there will still be updates on the thesis, as always, but in a more timely manner, once every month, due to the fact that it is becoming repetitive in some aspects of it, as nothing much changed from one post to the other; if it becomes too repetitive, there will just be a notes post with the expectations instead of a post.
United States:
The United States' economy remains strong, but recent data suggests that it may be weakening, although Producer Manufacturer data showed no sign of recession, which calmed markets' ( DIA 0.00%↑ SPY 0.00%↑ QQQ 0.00%↑ ) worries. Wednesday's FOMC Minutes showed a hawkish monetary policy stance, whereas markets ( TLT 0.00%↑ ) were quite dovishly positioned. As pointed after the FOMC Minutes data release, frontloading the monetary policy stance seemed off the table given the yields ( TMV 0.00%↑ ) reaction, but after Wednesday's FOMC Minutes, it seems that the frontloading of the monetary policy stance seems to be back on. Friday's Non Farm Payroll data suggested that the job market is strong, erasing the worries caused by the jolts data of the day before.
Figure 1. United States’ Job Growth Tops Estimates.
Next week's inflation data will be key for the forward stance as monetary policy is data-dependent, and so the forward stance should be adjusted based on key data changes in specific inflation and the job market, as monetary policy's main mandate is the dual mandate, which seeks to stabilize prices while maintaining maximum employment. As maximum employment is achieved and inflation remains higher than the FOMC officials' 2% goal, monetary policy is expected to remain in the current path, until after the price stability goal is achieved.
Figure 2. Expectations Over Next Week’s Inflation Data:
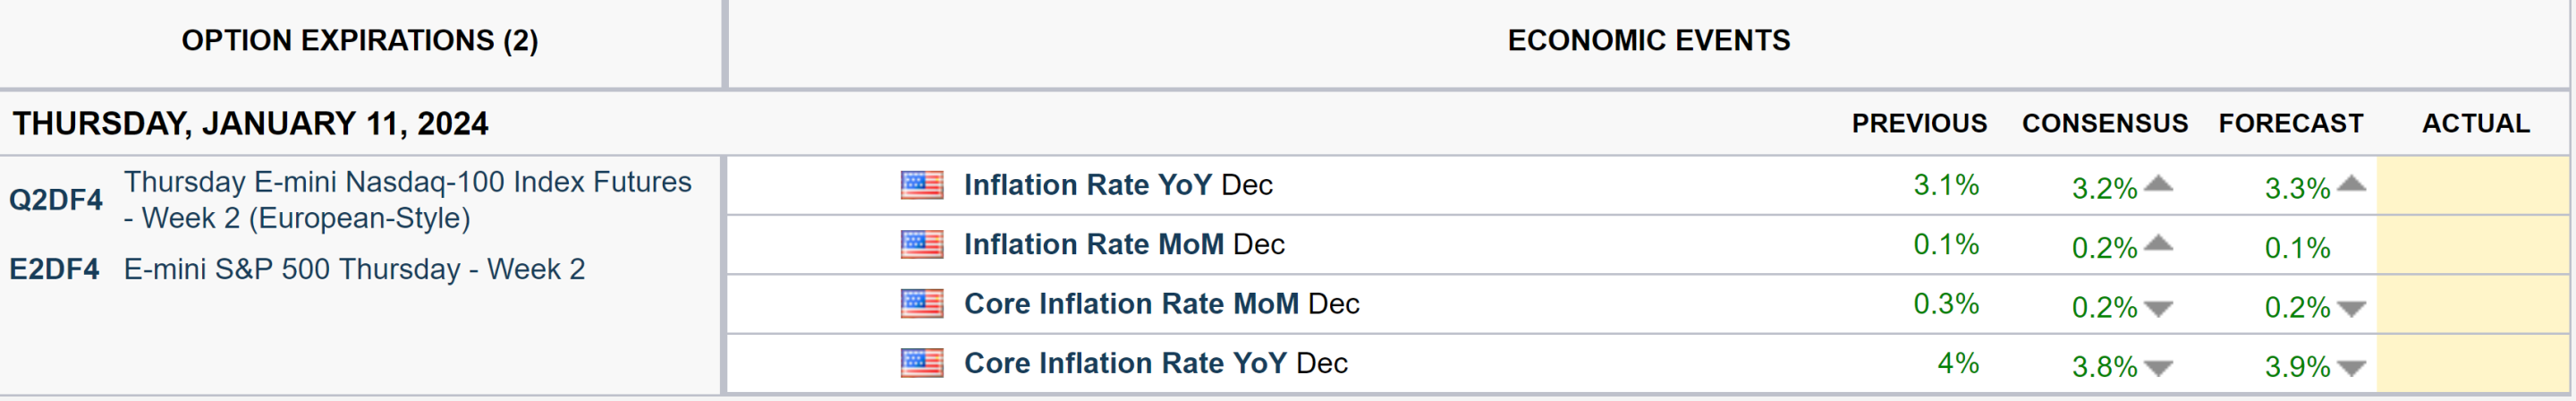
Markets ( DIA 0.00%↑ SPY 0.00%↑ QQQ 0.00%↑ ) remain dovishly ( TLT 0.00%↑ ) positioned; the SOFR market is pricing six rate cuts, but FOMC officials are hawkish. As previously shown, it's quite remarkable the contrast between what markets are pricing and what FOMC officials have signaled in the latest Summary of Economic Projections ( SEP ). The next two charts show the previously mentioned statistics.
Figure 3. Market-Priced Rate Path With Chart:
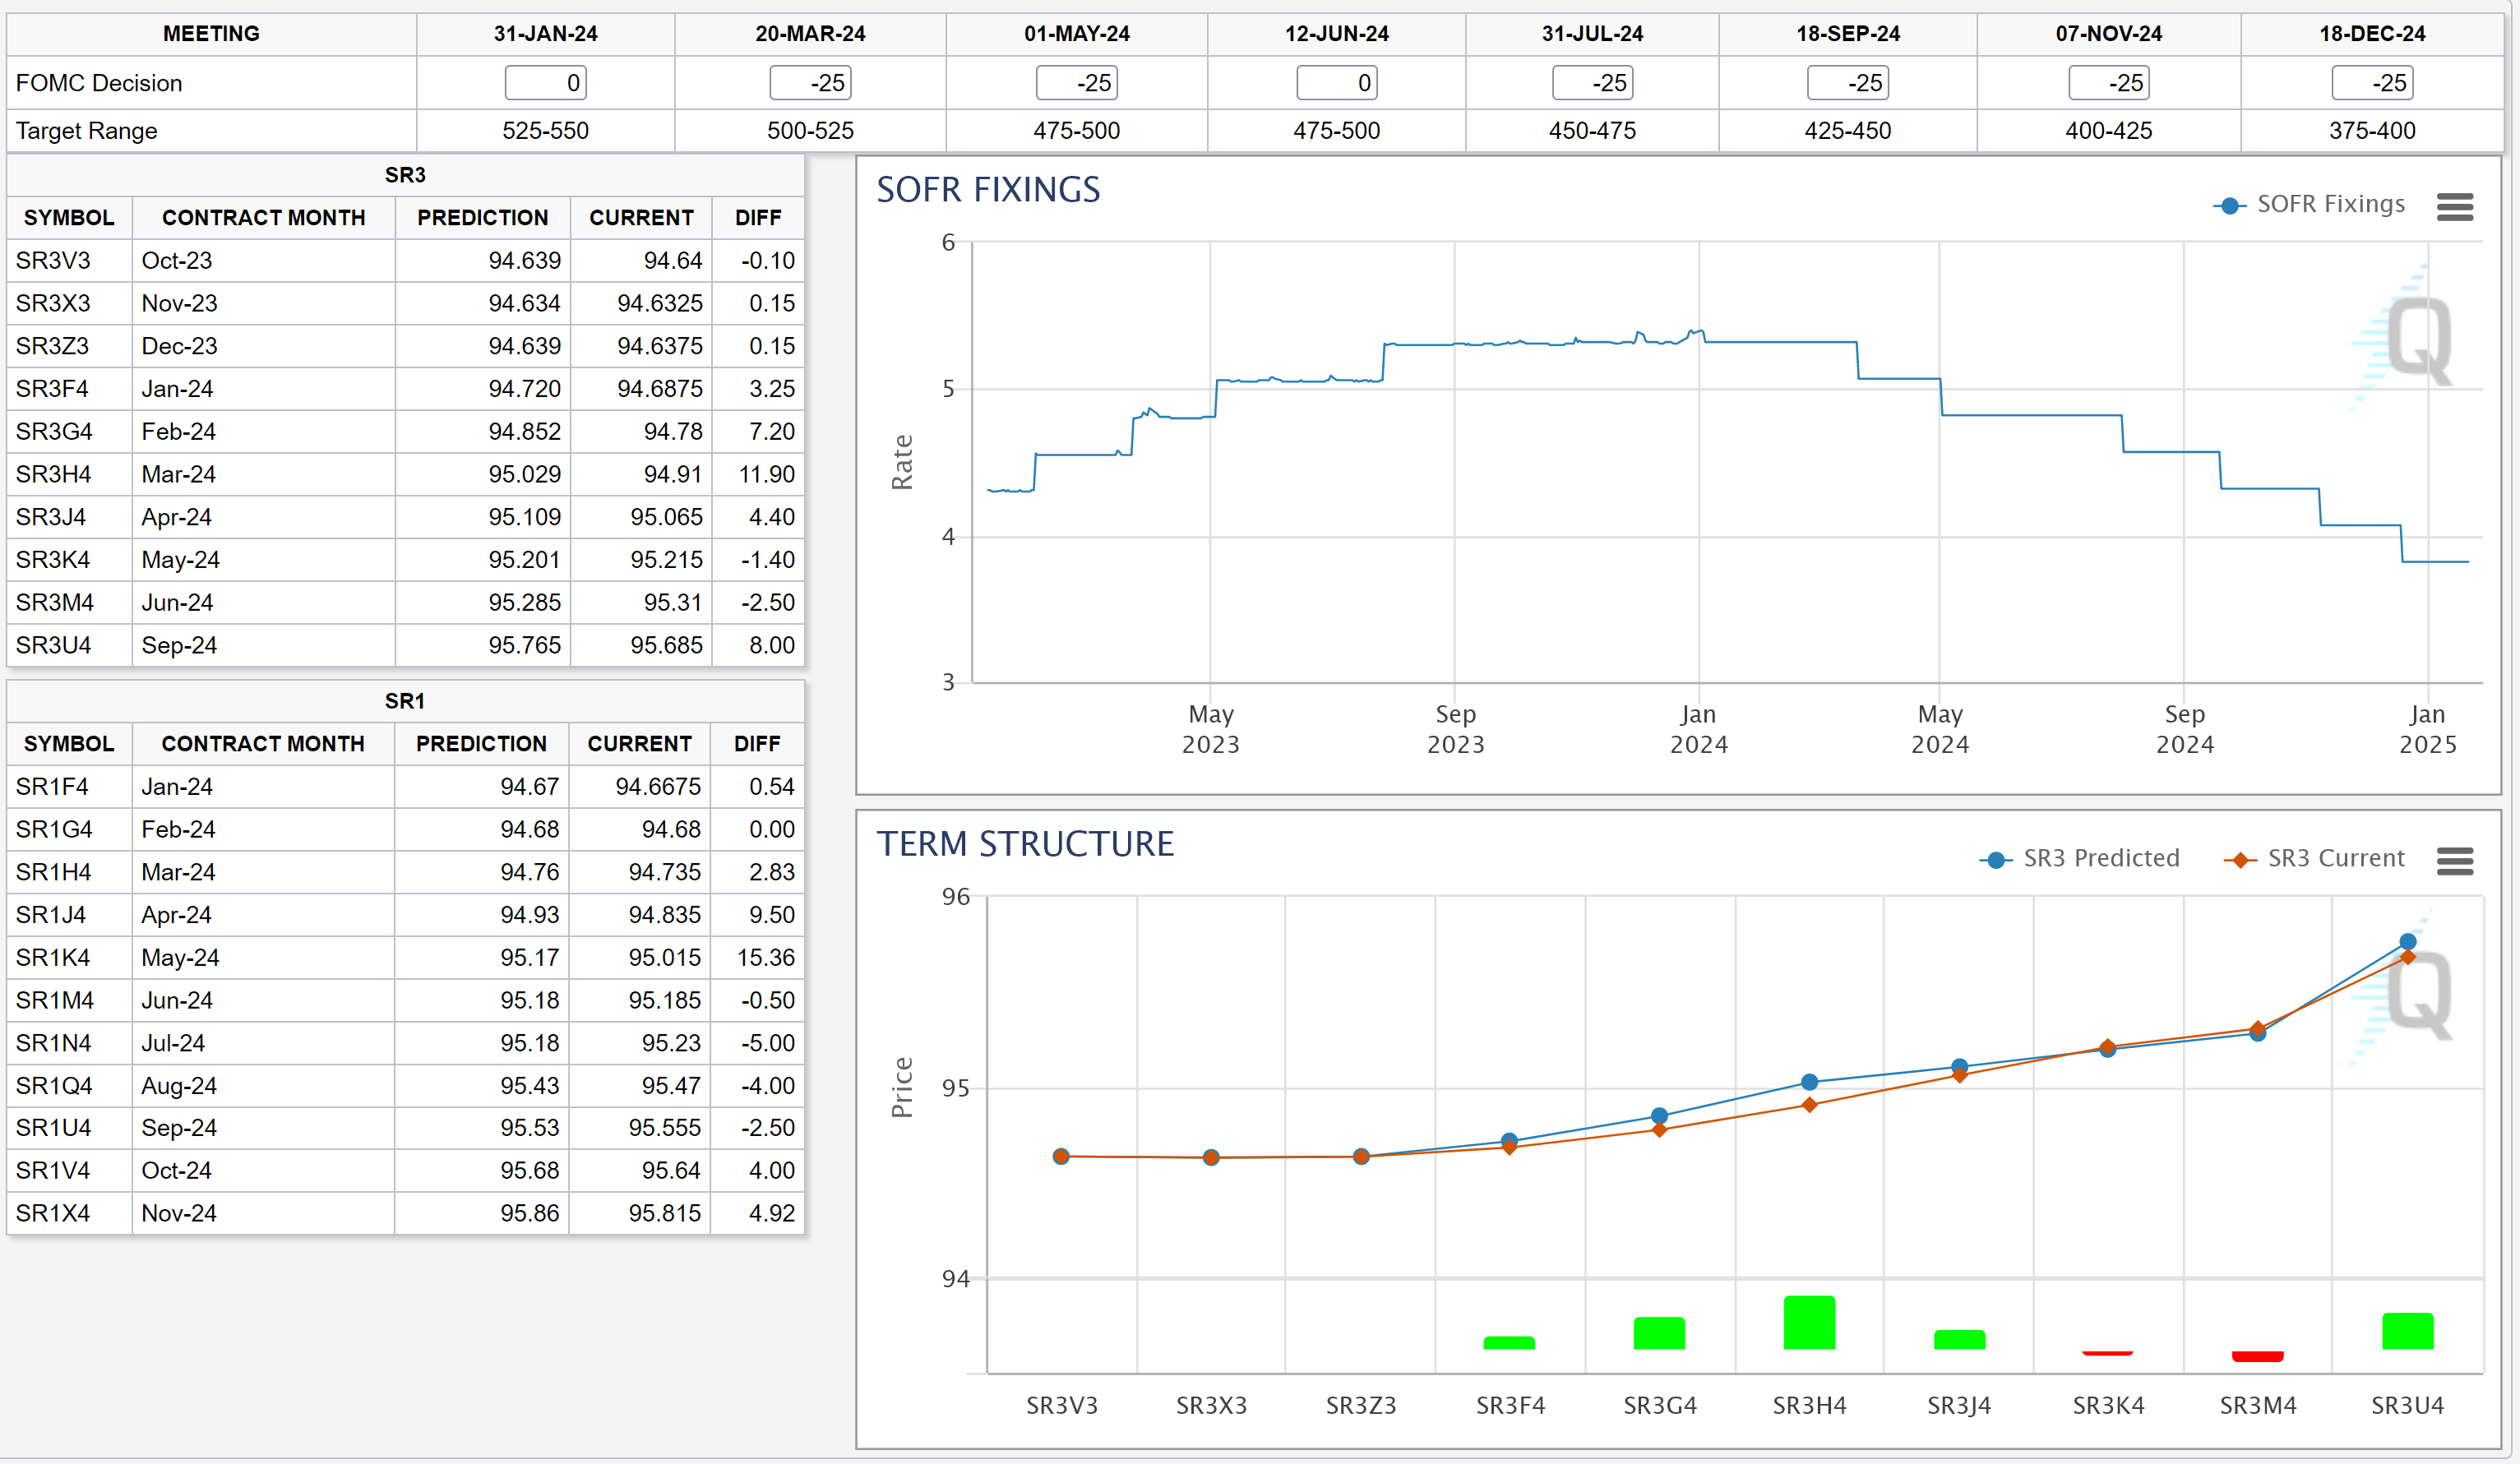
Figure 3.5 Market-Priced Rate Changes Without Chart:

Figure 4. FOMC officials’ Rate Projections:
Figure 4.5 FOMC Officials' Fourth Quarter of 2024 Rate Projections' Ranges:
![FOMC Officials' Rate Projection Ranges ( Fourth Quarter 2024 [Q4 2024] )](https://substackcdn.com/image/fetch/f_auto,q_auto:good,fl_progressive:steep/https%3A%2F%2Fsubstack-post-media.s3.amazonaws.com%2Fpublic%2Fimages%2F87104d6c-5803-403e-9485-8c1ef1fa95c9_446x274.png "FOMC Officials' Rate Projection Ranges ( Fourth Quarter 2024 [Q4 2024] )")
The soft-landing of the economy depends on the government's handling of the government shutdown avertion in two weeks ( January 19th is the deadline for a resolution over the §5860 ). Depending on the outcome, markets ( DIA 0.00%↑ SPY 0.00%↑ QQQ 0.00%↑ ) should react one way or another, but given previous market reactions to government shutdown events, it is convenient to be positioned to the downside until at least the end of the month.
Figure 5. E-mini Nasdaq-100 Chart:
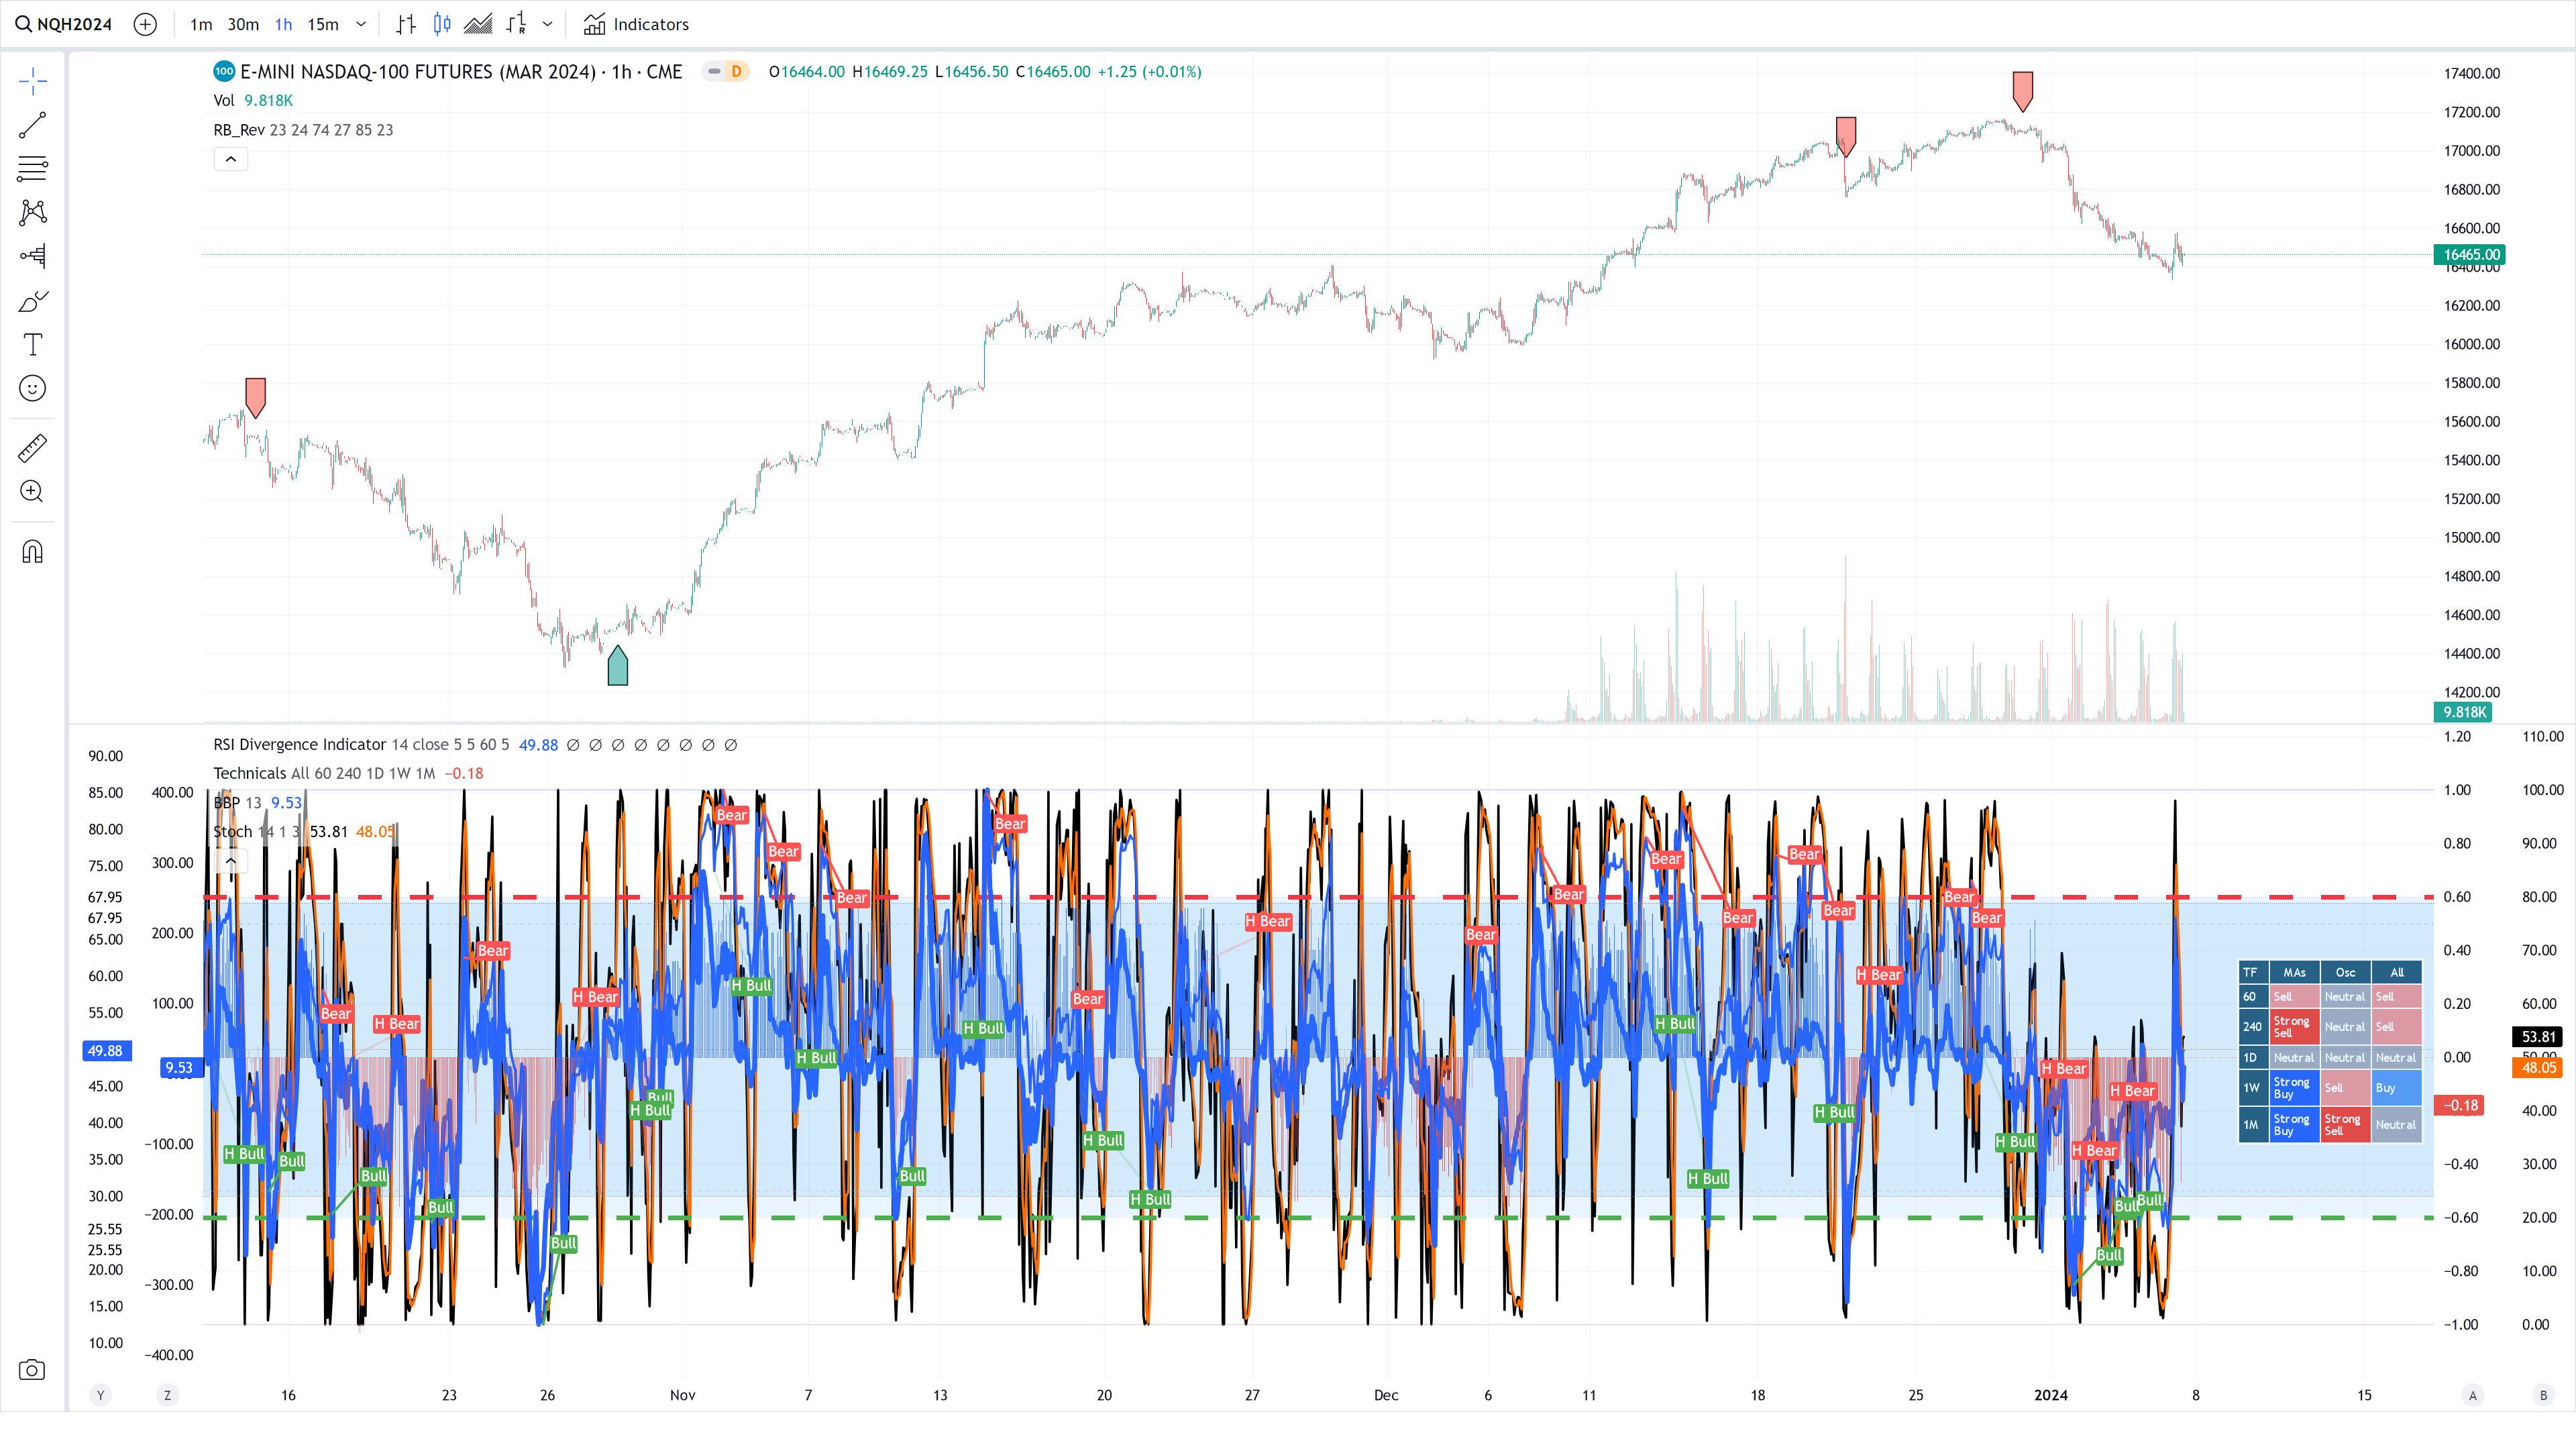
Figure 6. E-mini S&P 500 Chart:
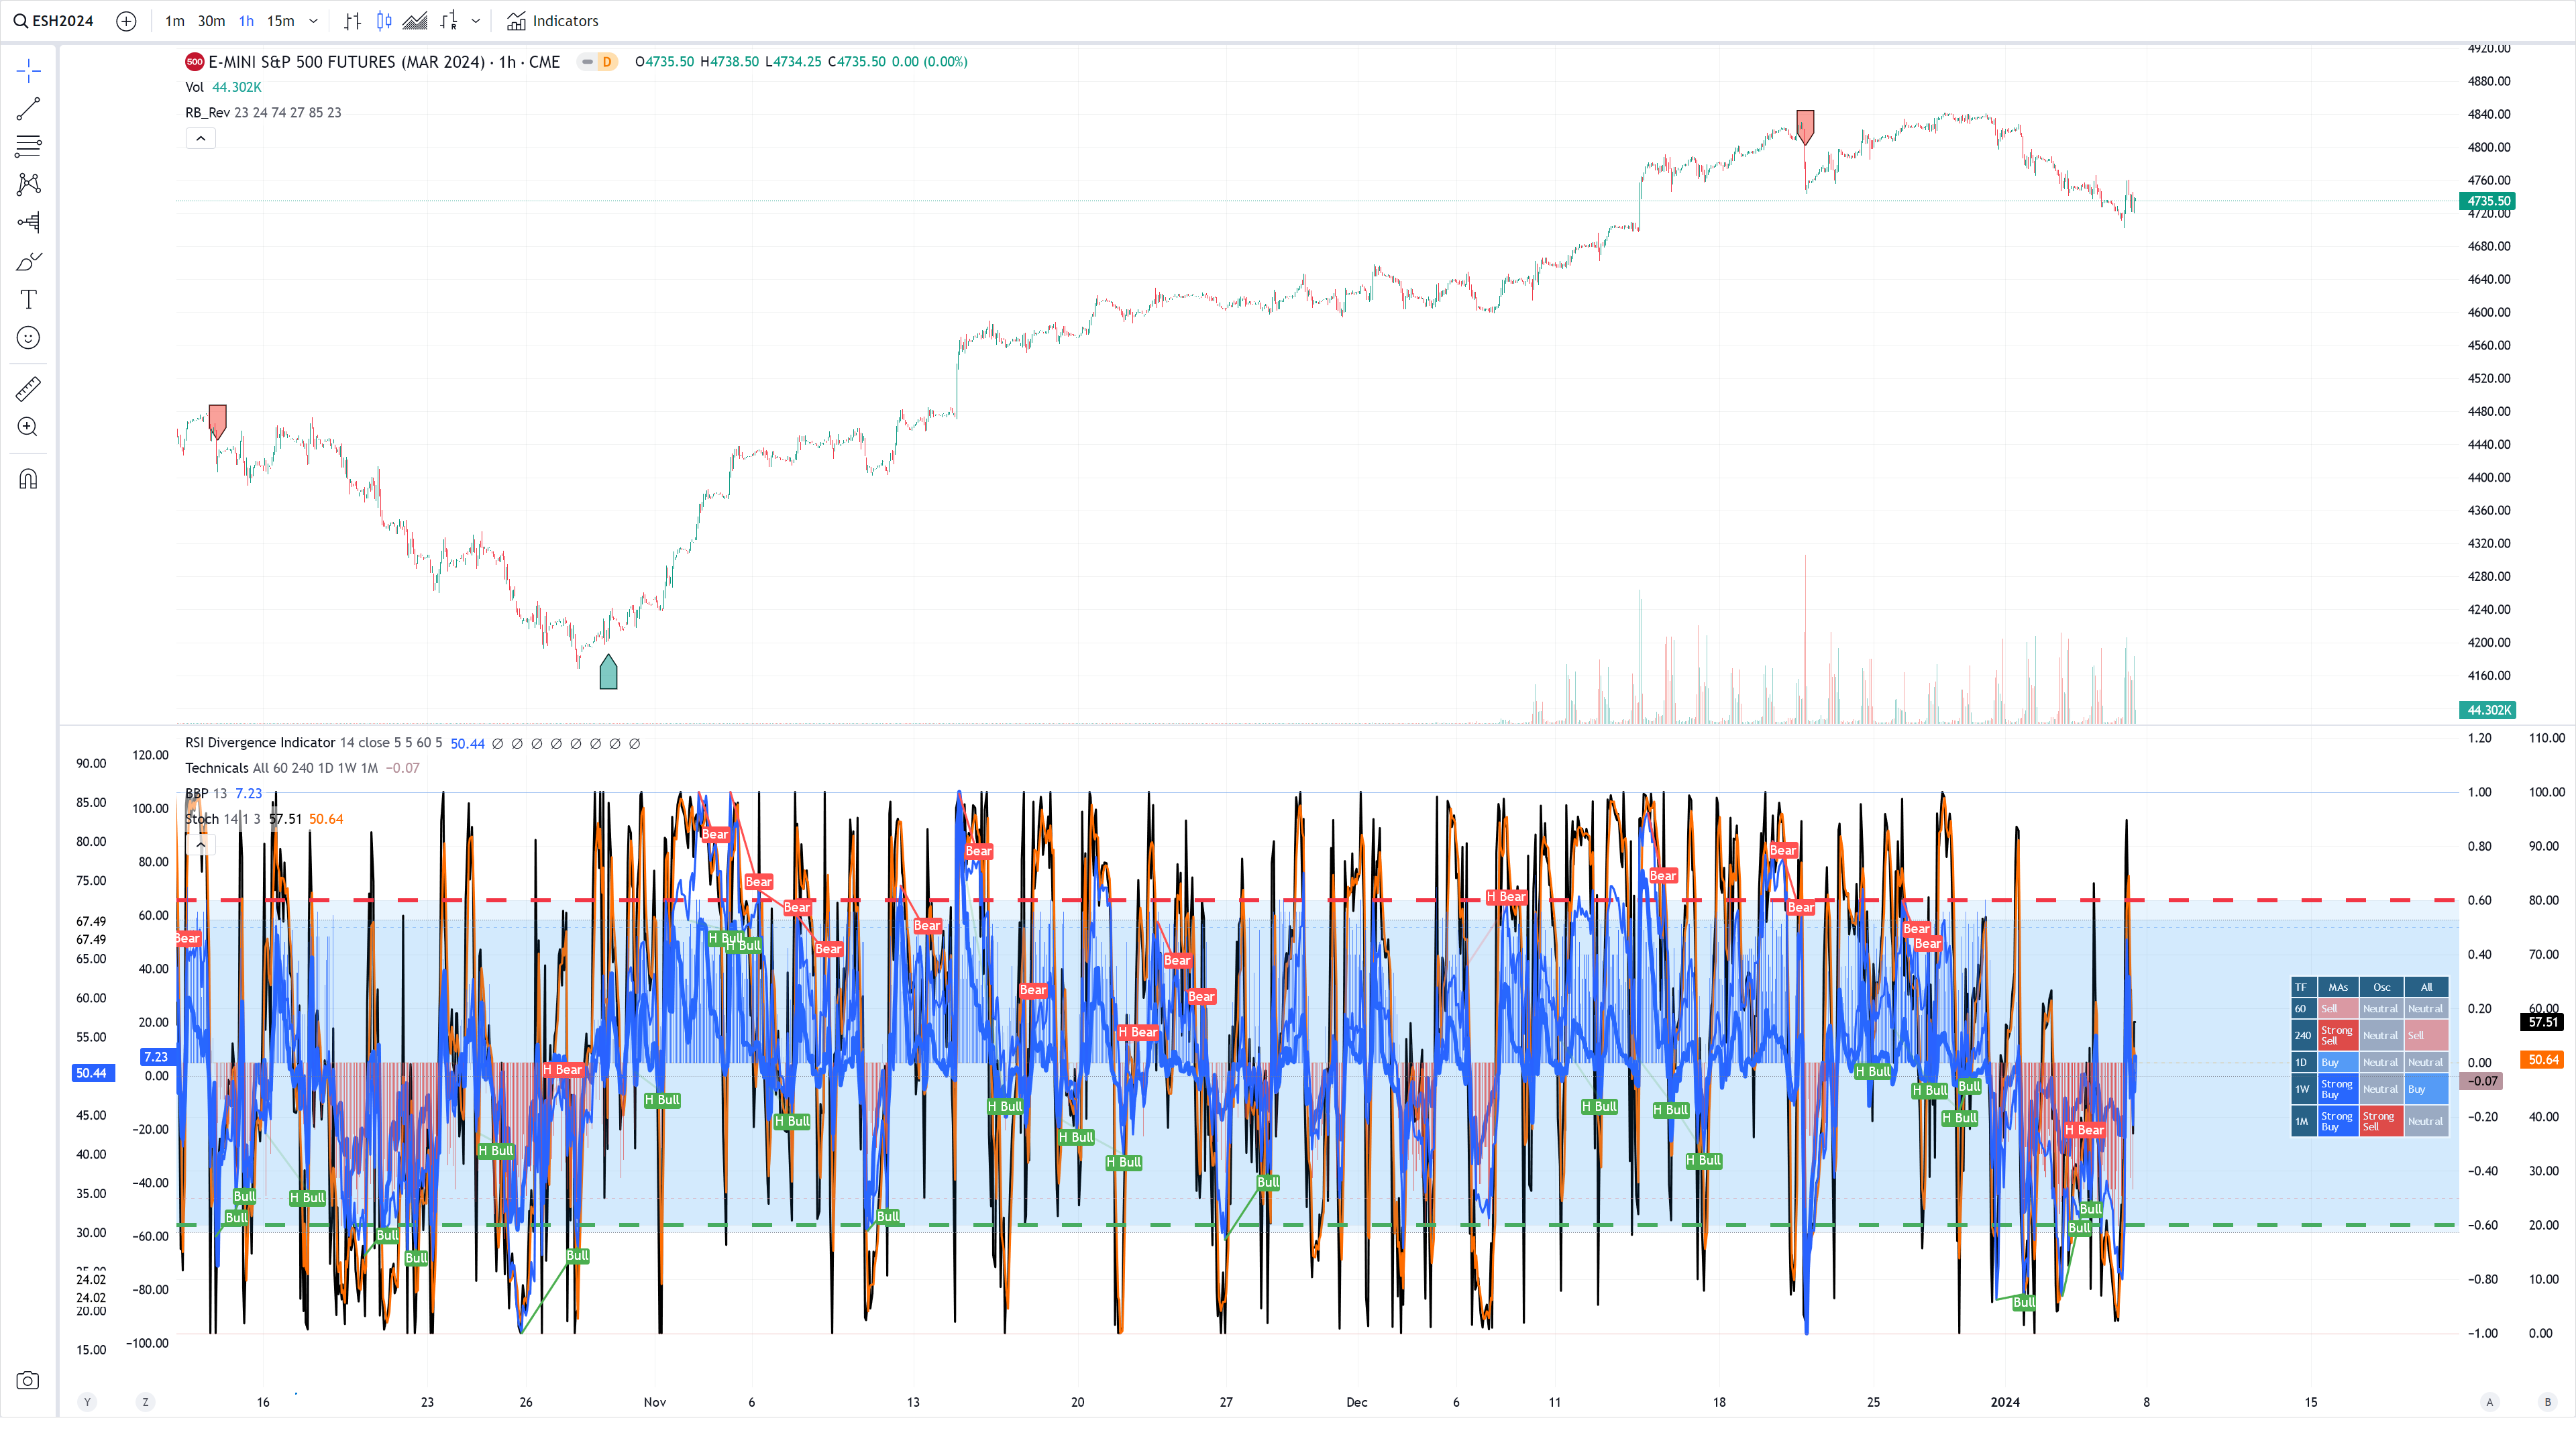
Markets are still at overheated levels, but they are approaching, to put it this way, the buy zone. Oil cooled from previously shown high stochastic levels, a cooldown in the stochastic that marked the rally; last year's OPEC+ measures started to recently take effect; opening 70 strike straddles every time oil reaches that level while holding 75 strike straddles remains the appropriate way to hedge oil arbitrarily; given the volatility adhered to geopolitical news, staying positioned directionally is the only way to not be affected by volatility and hence profit from it.
Figure 7. OPEC and Non-OPEC Liquid Fuels Production Outages Statistics:
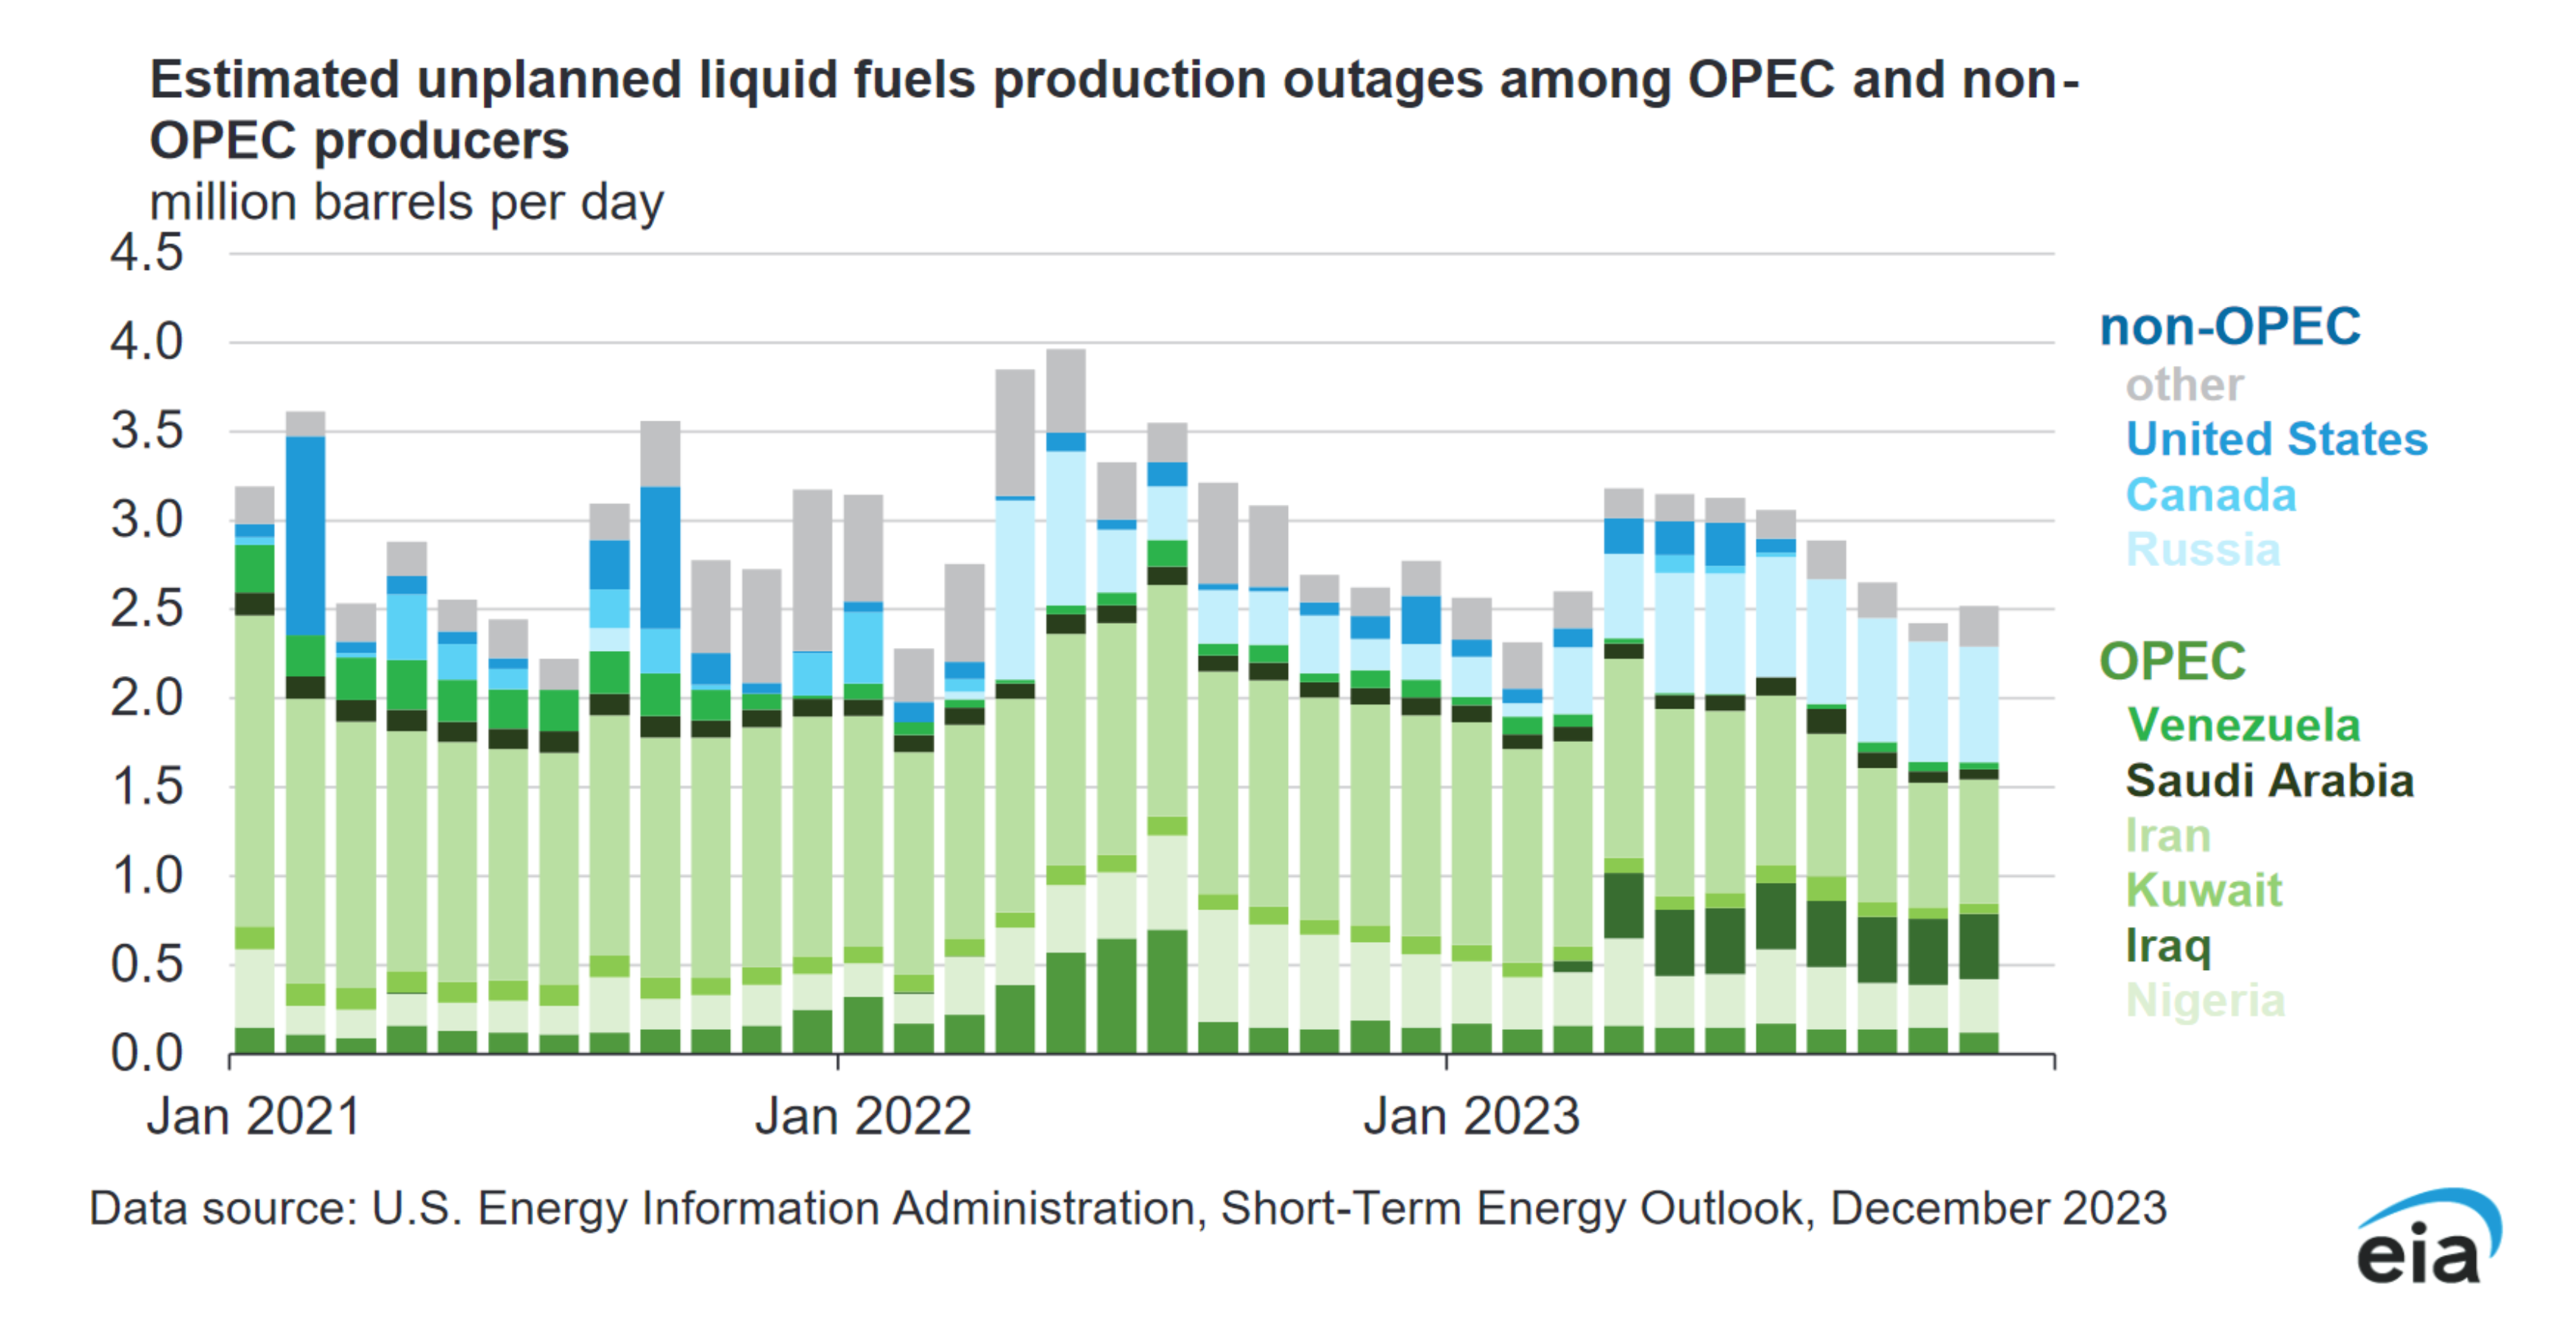
If you ask, how's the oil supply and demand right now? The answer is that the United States' oil and gas production is going up while OPEC+ members reduce supply. It is quite remarkable that there have been changes in the members of OPEC+, with some leaving and others joining this year.
Figure 8. United States’ Oil & Natural Gas Production Statistics:
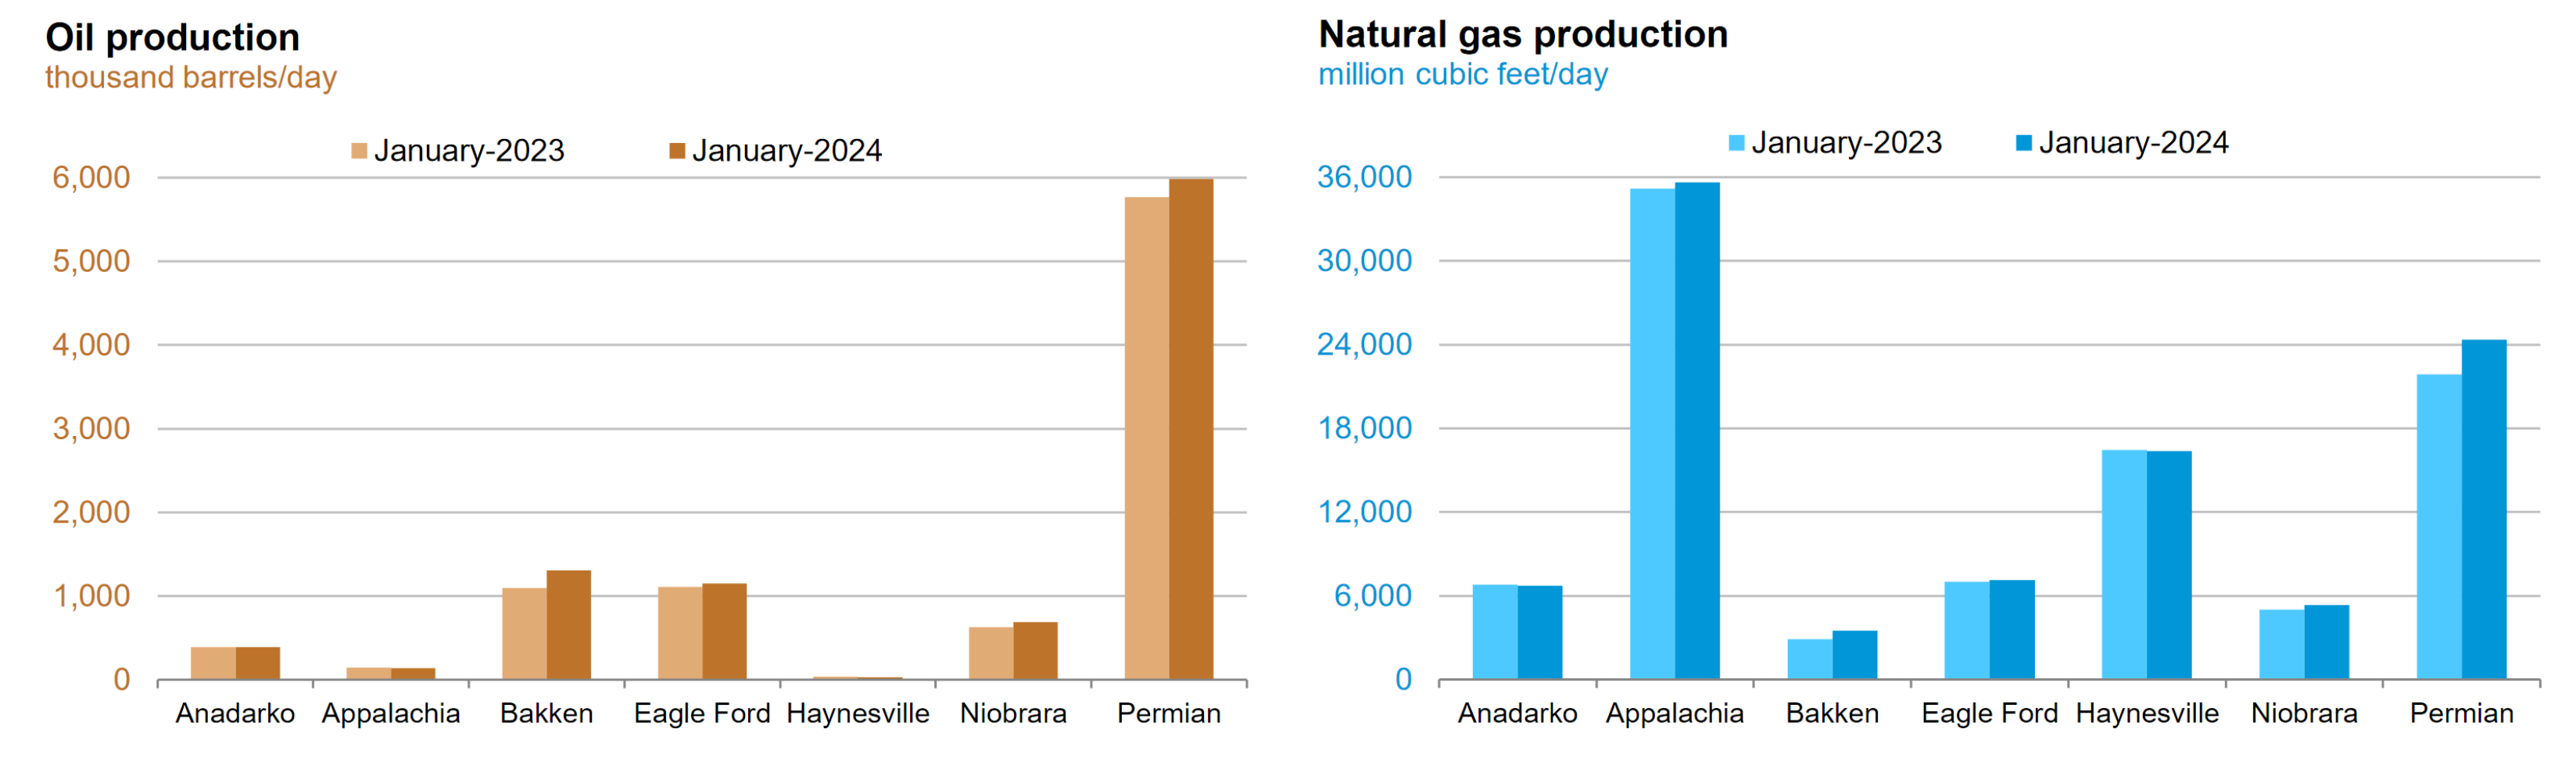
Figure 8.5 United States’ Oil & Shale Gas Regions:
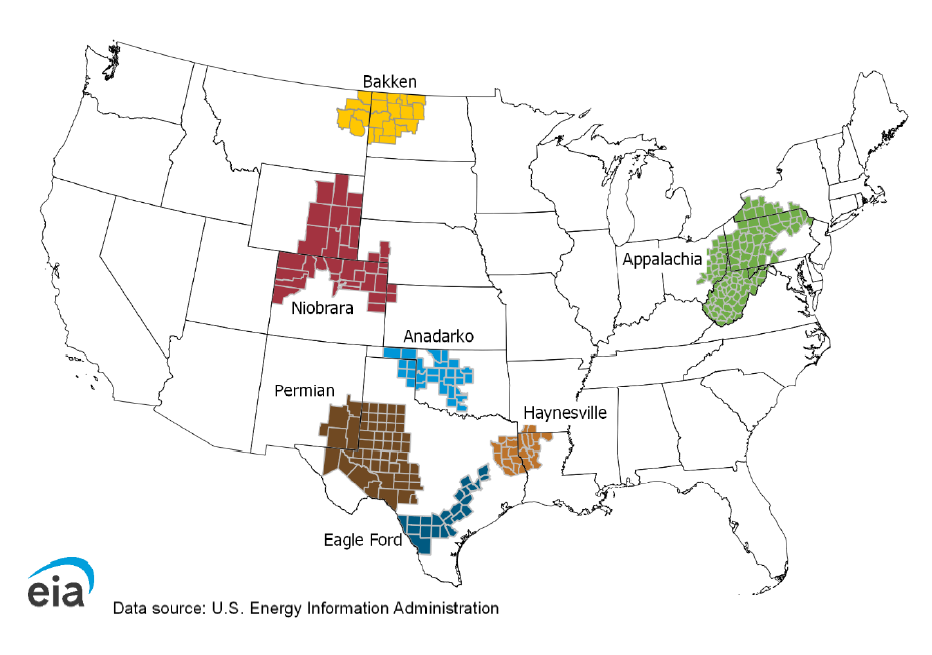

Weather will likely enhance energy ( XLE 0.00%↑ ) sector price valuations, as cold weather normally increases energy sector commodities ( USL 0.00%↑ BOIL 0.00%↑ ) demand and thereby increases prices. Given the fact that the current weather event is expected to be momentary, it is convenient to be positioned once again directionally in order to hedge the likely expected range. If you ask, how are markets positioned on energy sector commodities? The next two charts illustrate the market positioning on both natural gas ( BOIL 0.00%↑ ) and crude oil ( USL 0.00%↑ ).
Figure 9. Markets’ Positioning In Natural Gas Options:
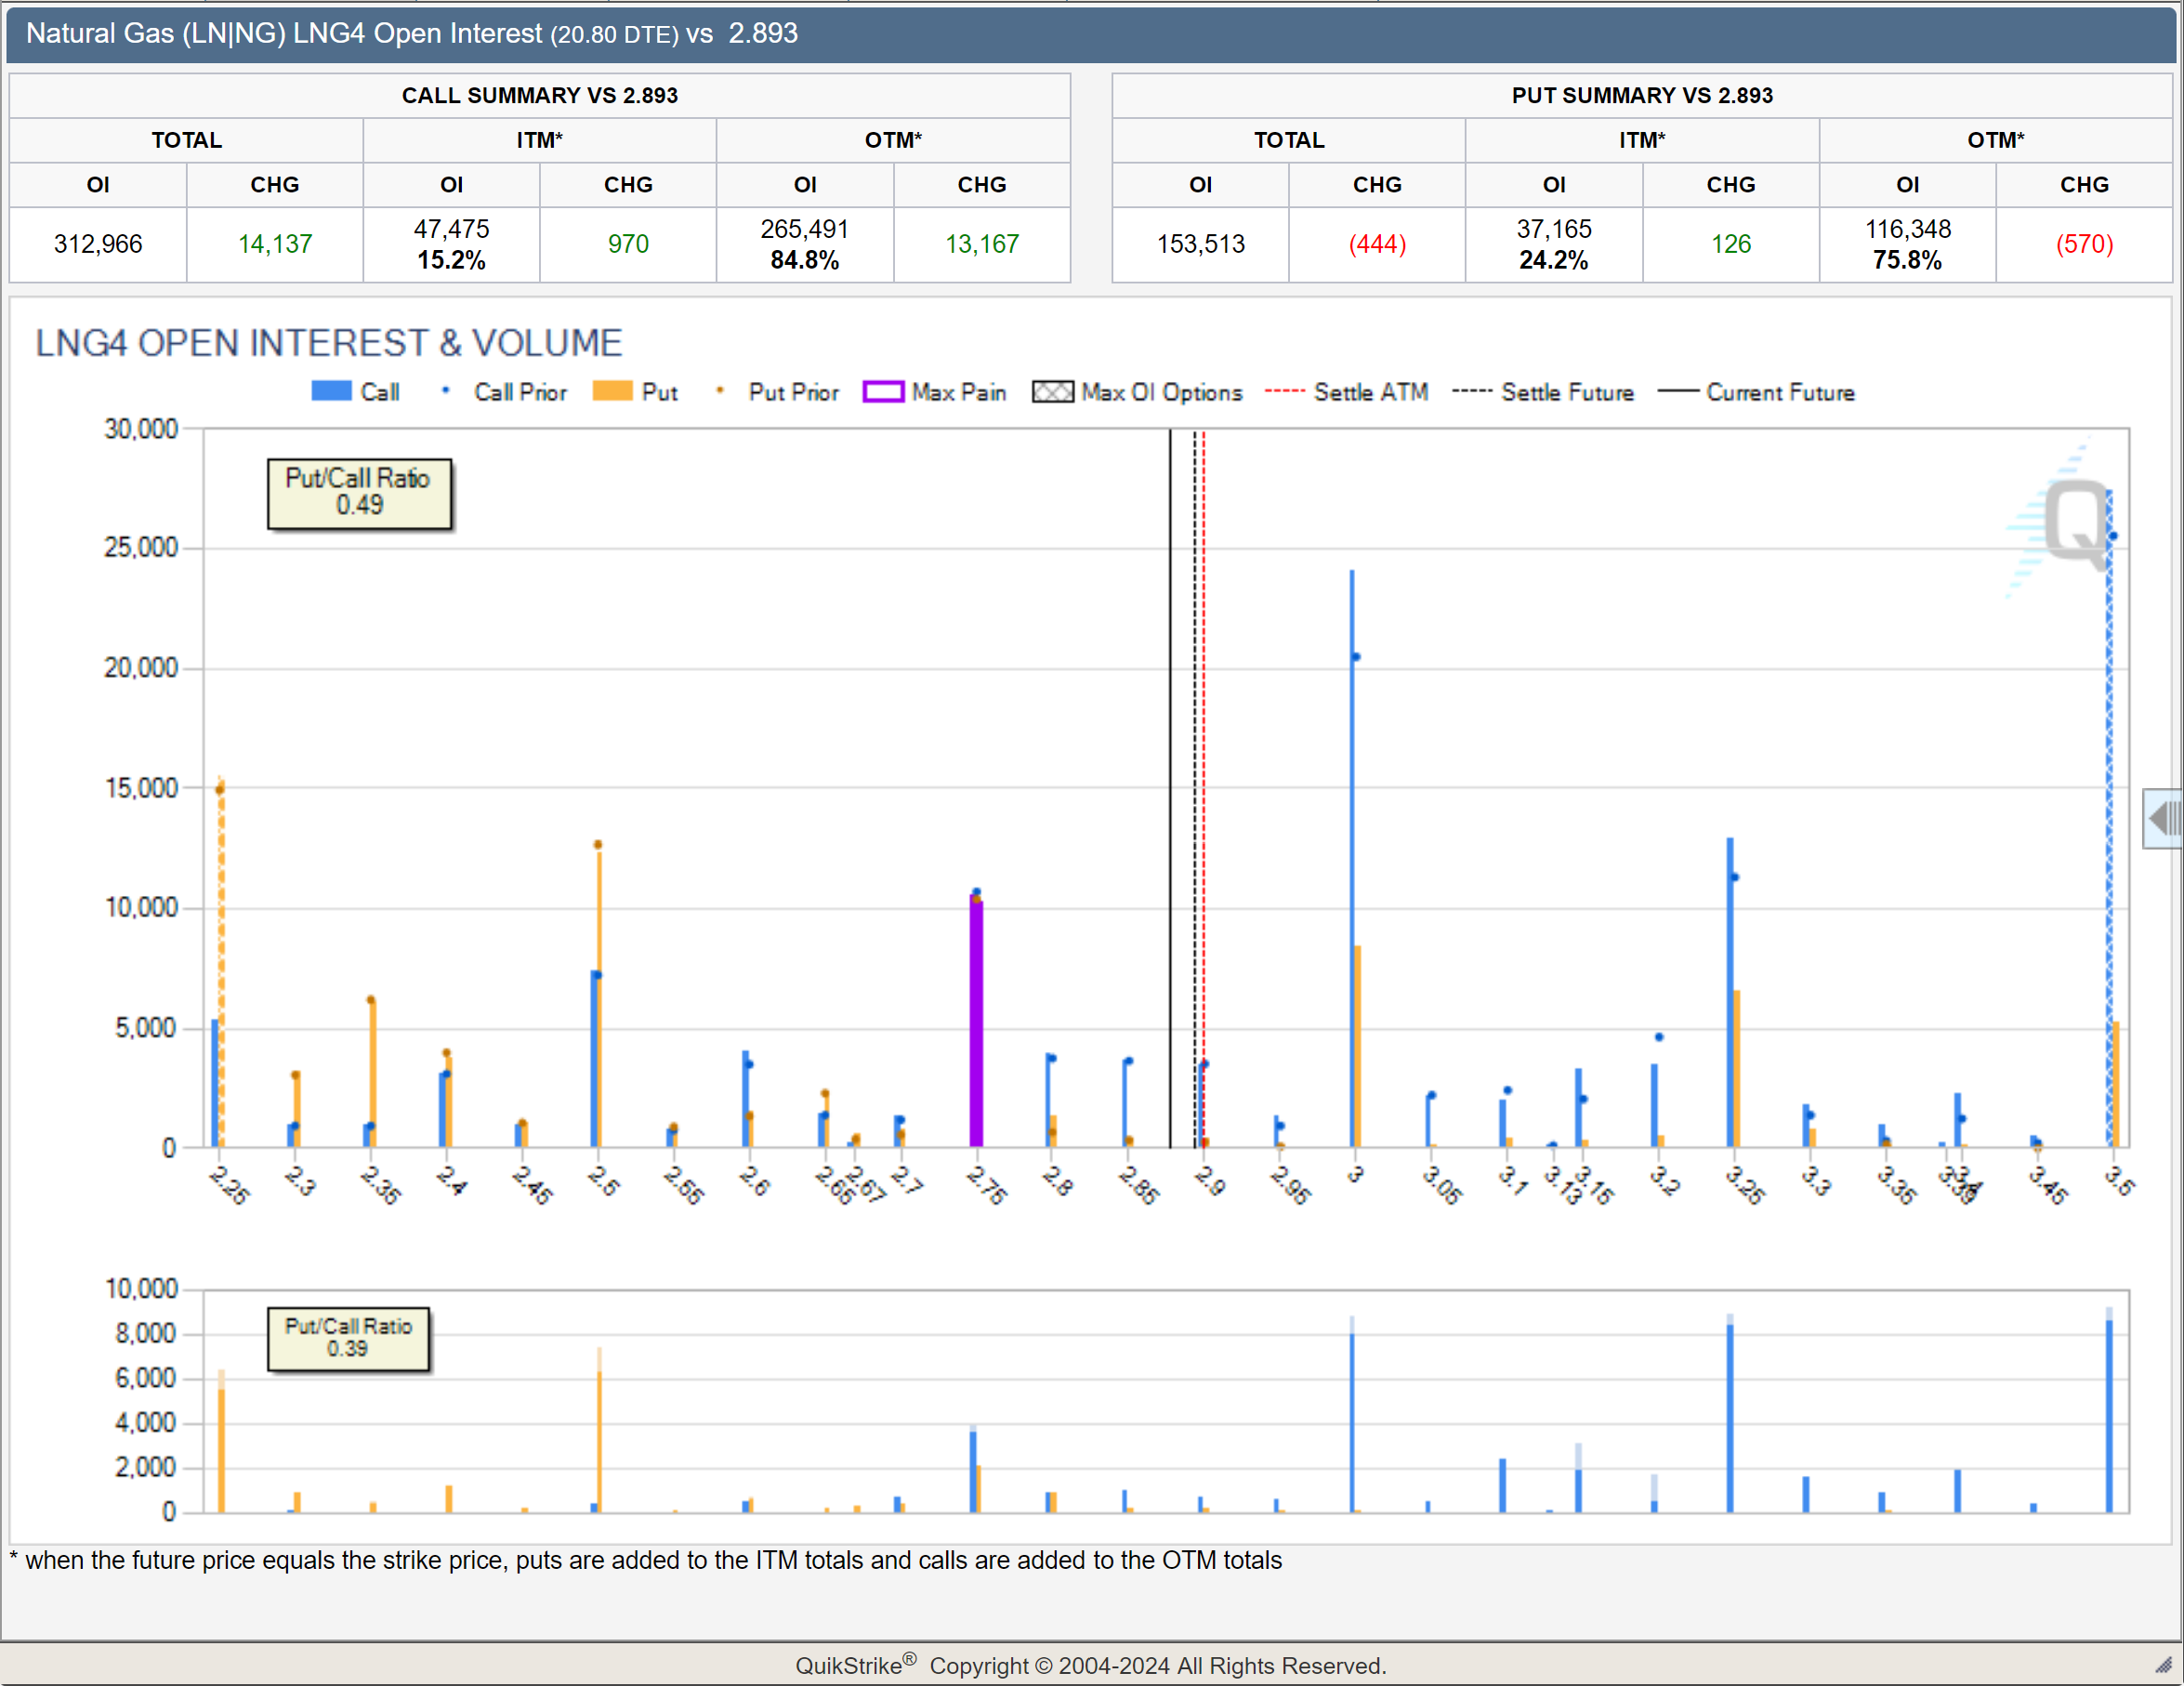
Figure 10. Markets’ Positioning In WTI Crude Oil Options:
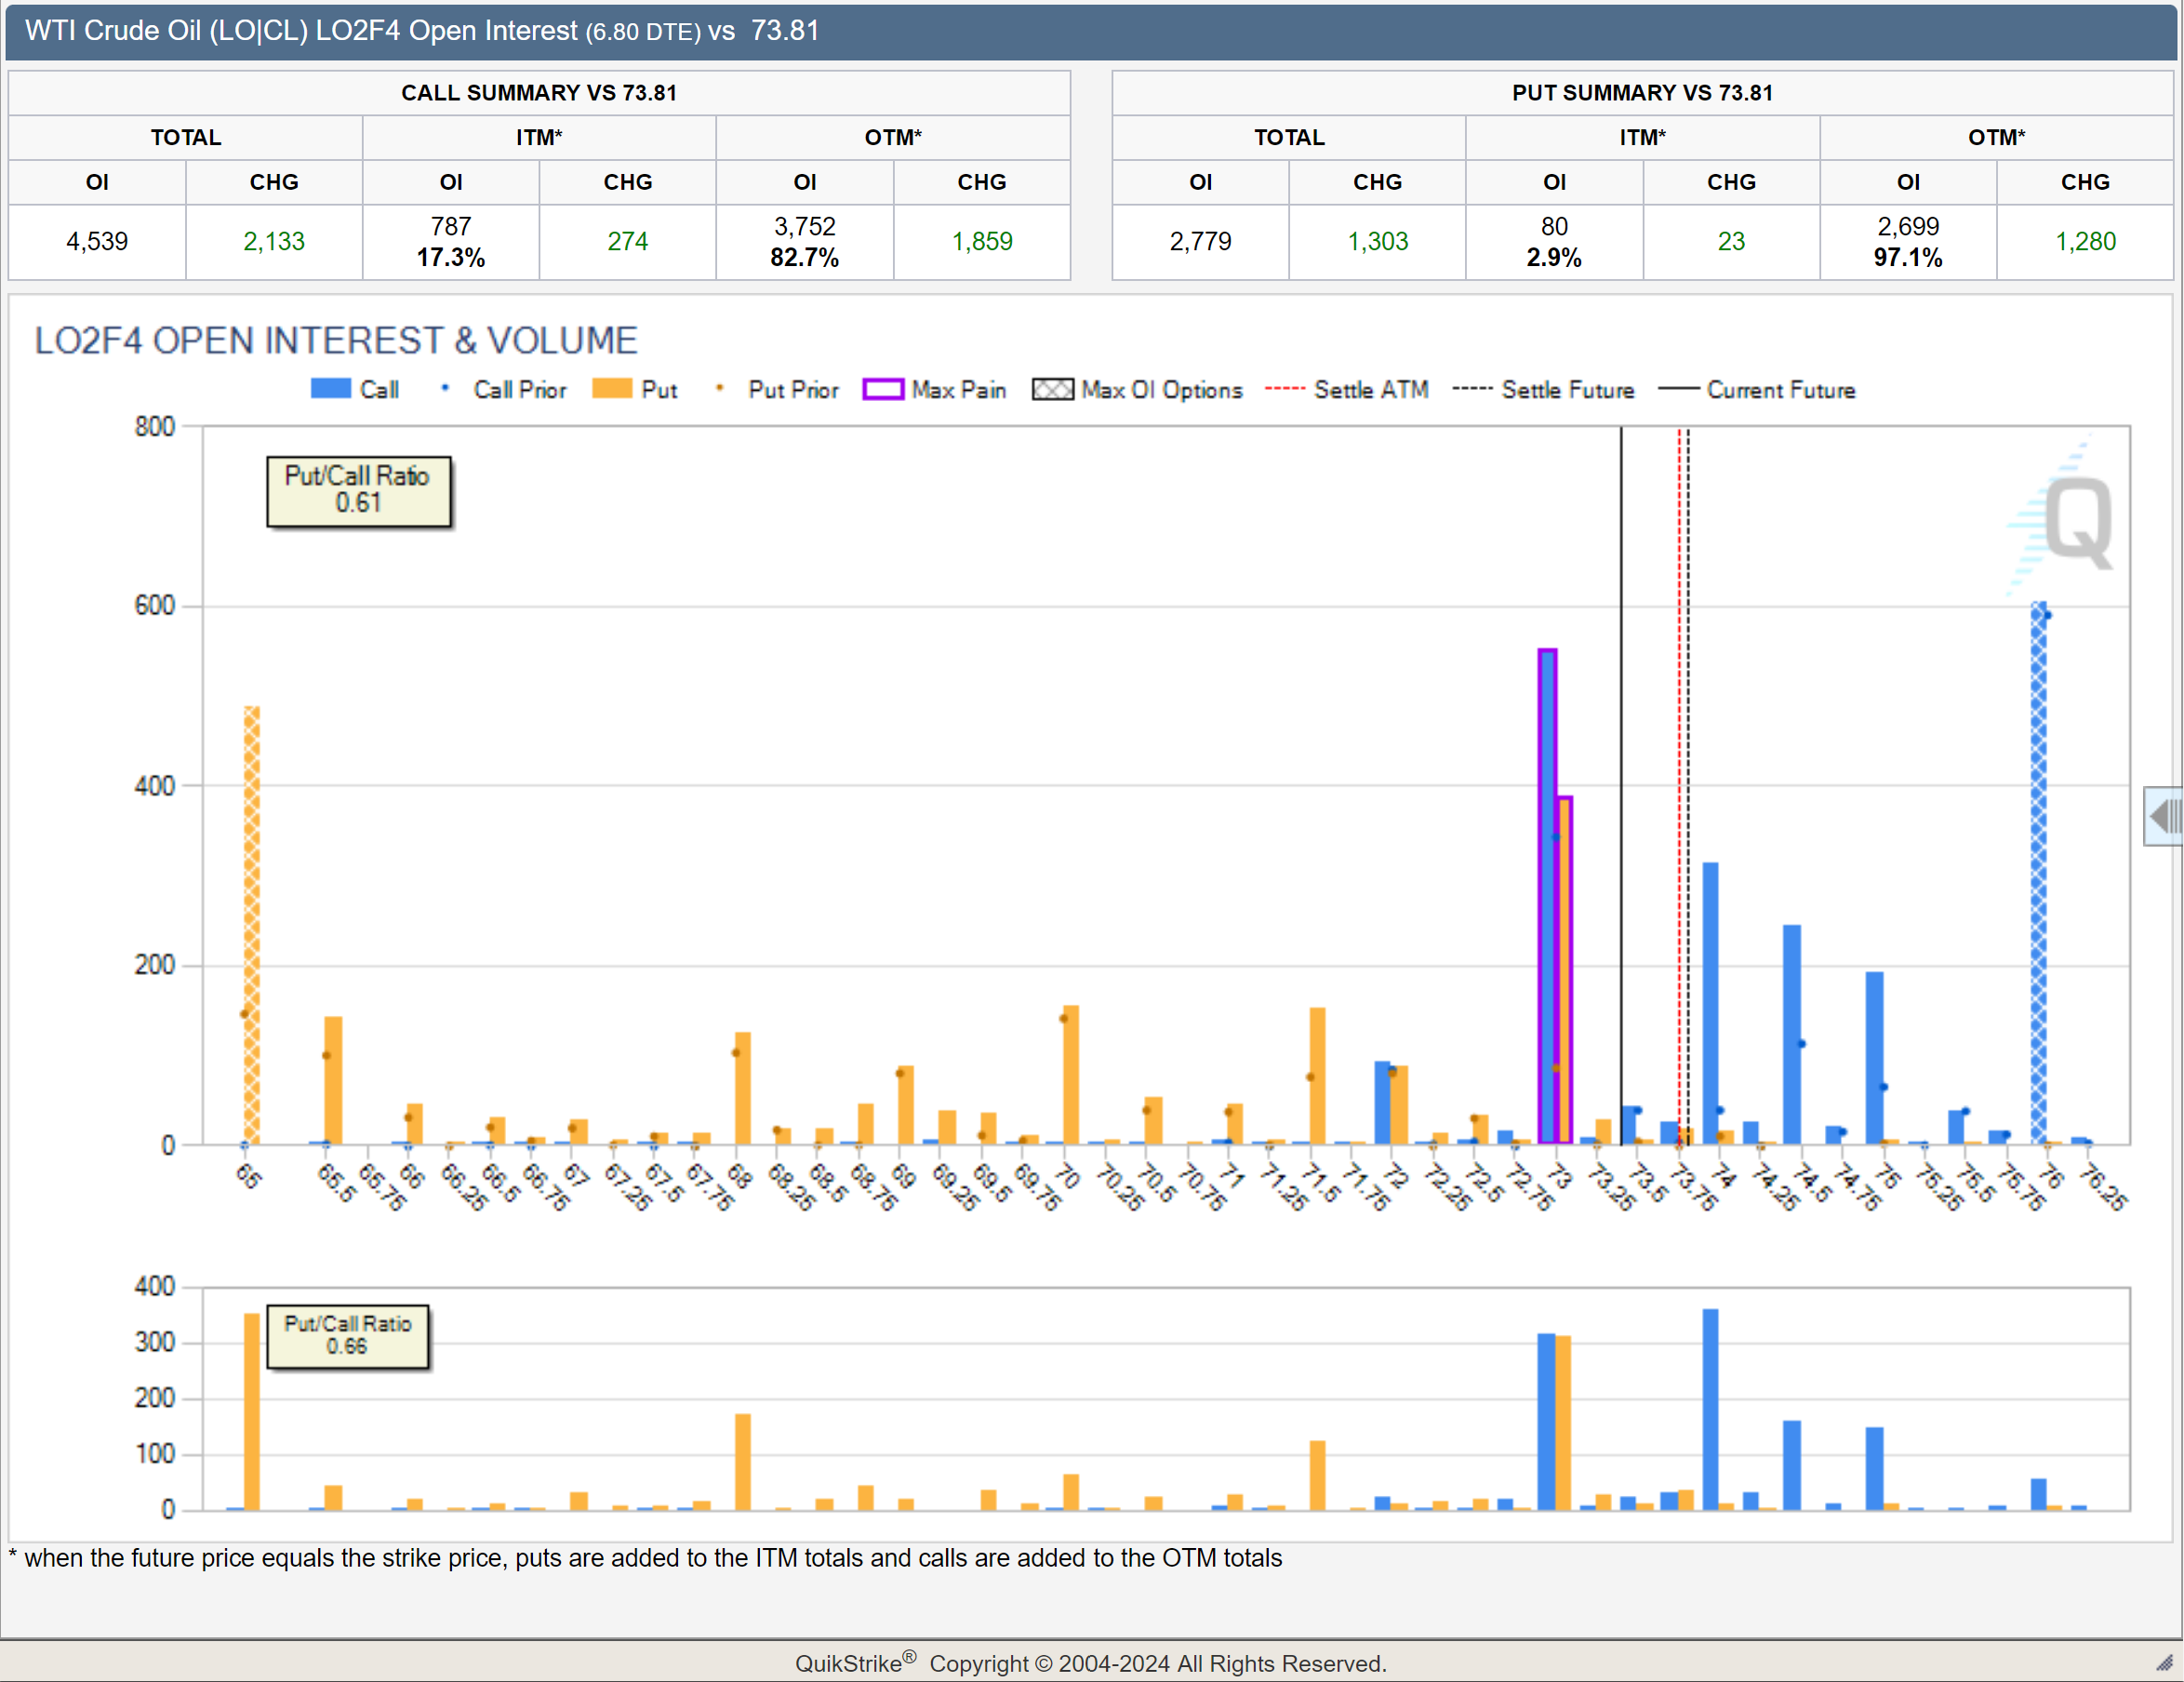
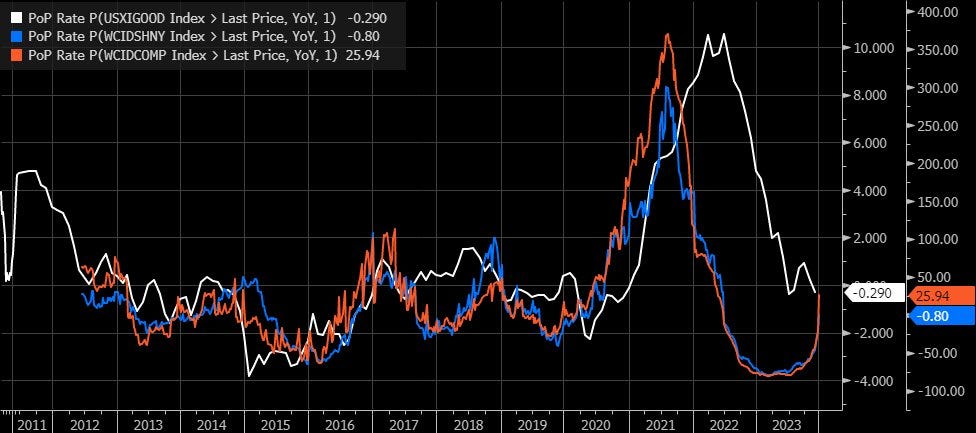
As the forward path over goods prices depends on how oil ( USL 0.00%↑ ) prices perform, the coherent way to approach plausible changes in monetary policy to volatile spikes in goods prices is through the tsy ( TLT 0.00%↑ ) market; if oil ( USL 0.00%↑ ) stays lower than 80 from now to the next quarter, it would be reasonable to increase bullish positioning in the tsy ( TLT 0.00%↑ ) market; if oil ( USL 0.00%↑ ) raises higher than 80 from now to the next quarter, it would be reasonable to decrease bullish positioning in the tsy ( TLT 0.00%↑ ) market. Recent geopolitical events are causing supply-driven inflationary pressure indicators to increase; these statistics are a warning that inflation might echo previously seen supply-driven reflationary events that monetary policy can't control, as monetary policy can just control demand-driven inflationary pressures. The next chart shows the correlation between shipping rates and goods inflation.
Figure 11. Correlation Between Shipping Rates & Goods Inflation.
( Supply-Driven Inflation Lagged Effect )
Quite attentive to forward spikes in inflation adhered to supply-chain disruptions, also attentive to shipping stocks until after shipping rates ease the current volatile spike. Recent bearish news suggested that there might be changes to a specific company ( BA 0.00%↑ ) in the industrial ( DIA 0.00%↑ XLI 0.00%↑ ) sector, which will more than probably drag down the markets as it ( BA 0.00%↑ ) is one of the market's top components. If you ask, What should I expect? The answer is that there will likely be stocks on discount while markets get dragged down by a specific event that will more than likely cause a butterfly effect.
Europe:
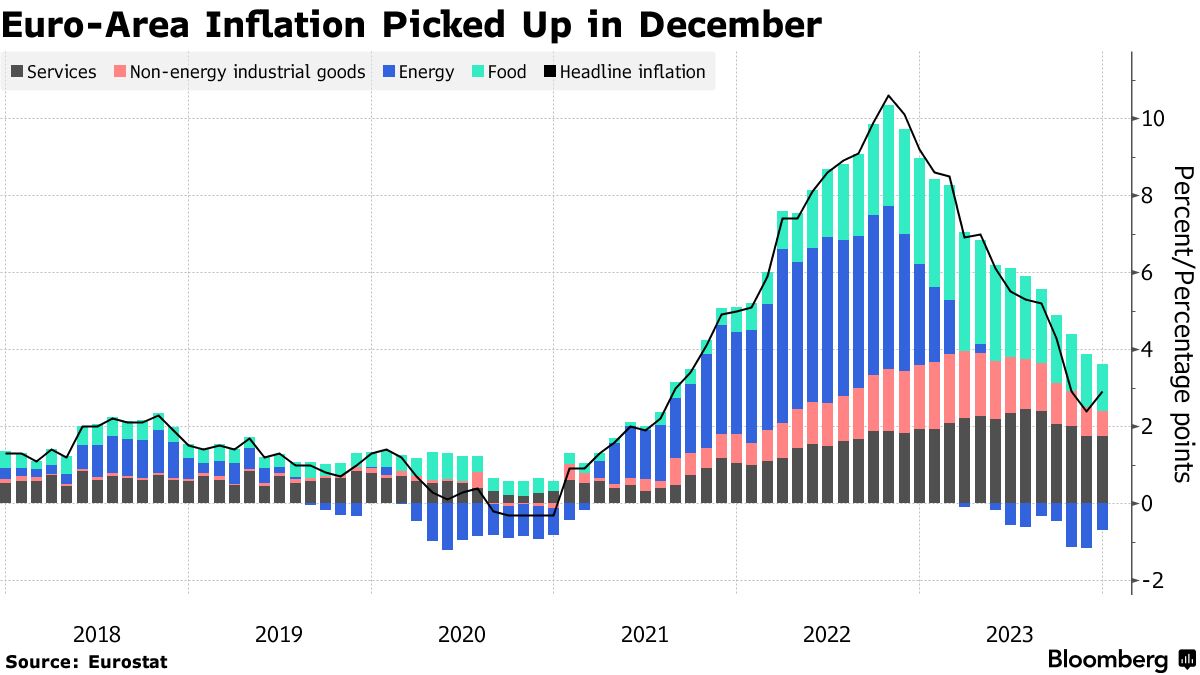
The Euro-Area economy remains strong, and the European job market remains resilient; although recent inflation statistics showed an uptick in inflation, which made market participants reduce dovishness, the European Central Bank members remain hawkish; although, as mentioned before, there are more European Central Bank members shifting dovish. Although, the contrast between what markets are and have priced-in and what the European Central Bank signals is quite remarkable.
Figure 12. Higher Euro-Area Inflation:
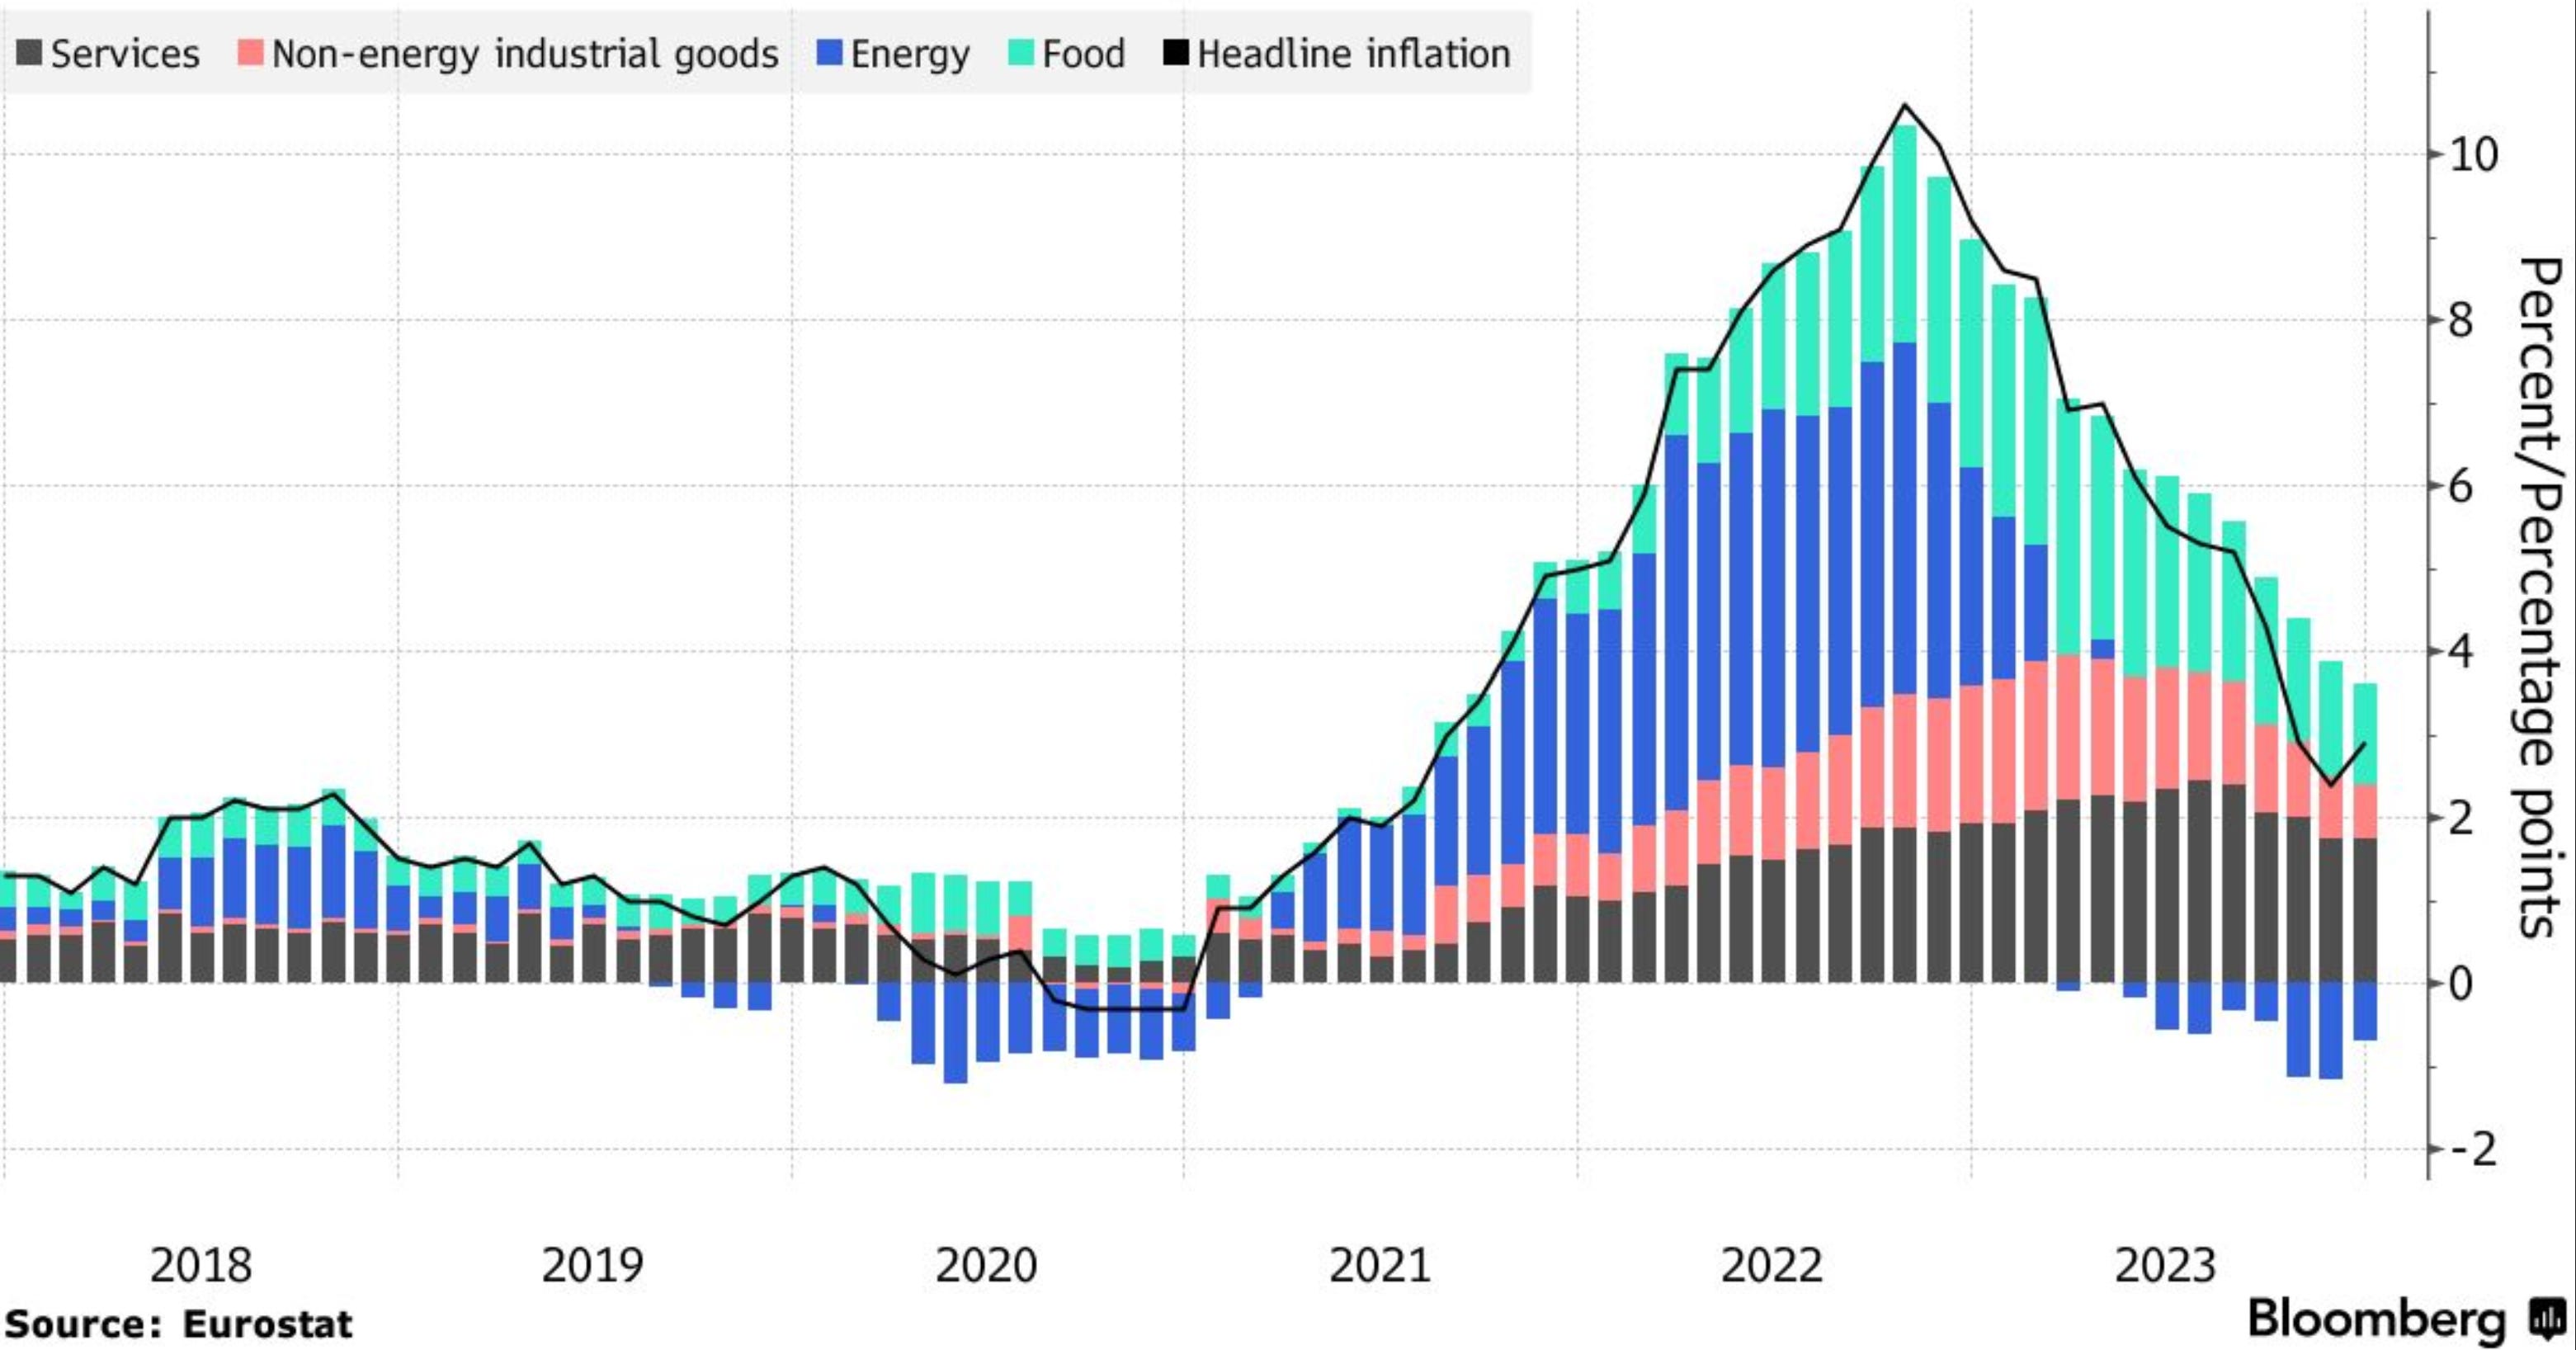
Figure 13. Euro-Area Inflation Is Still Diverging.
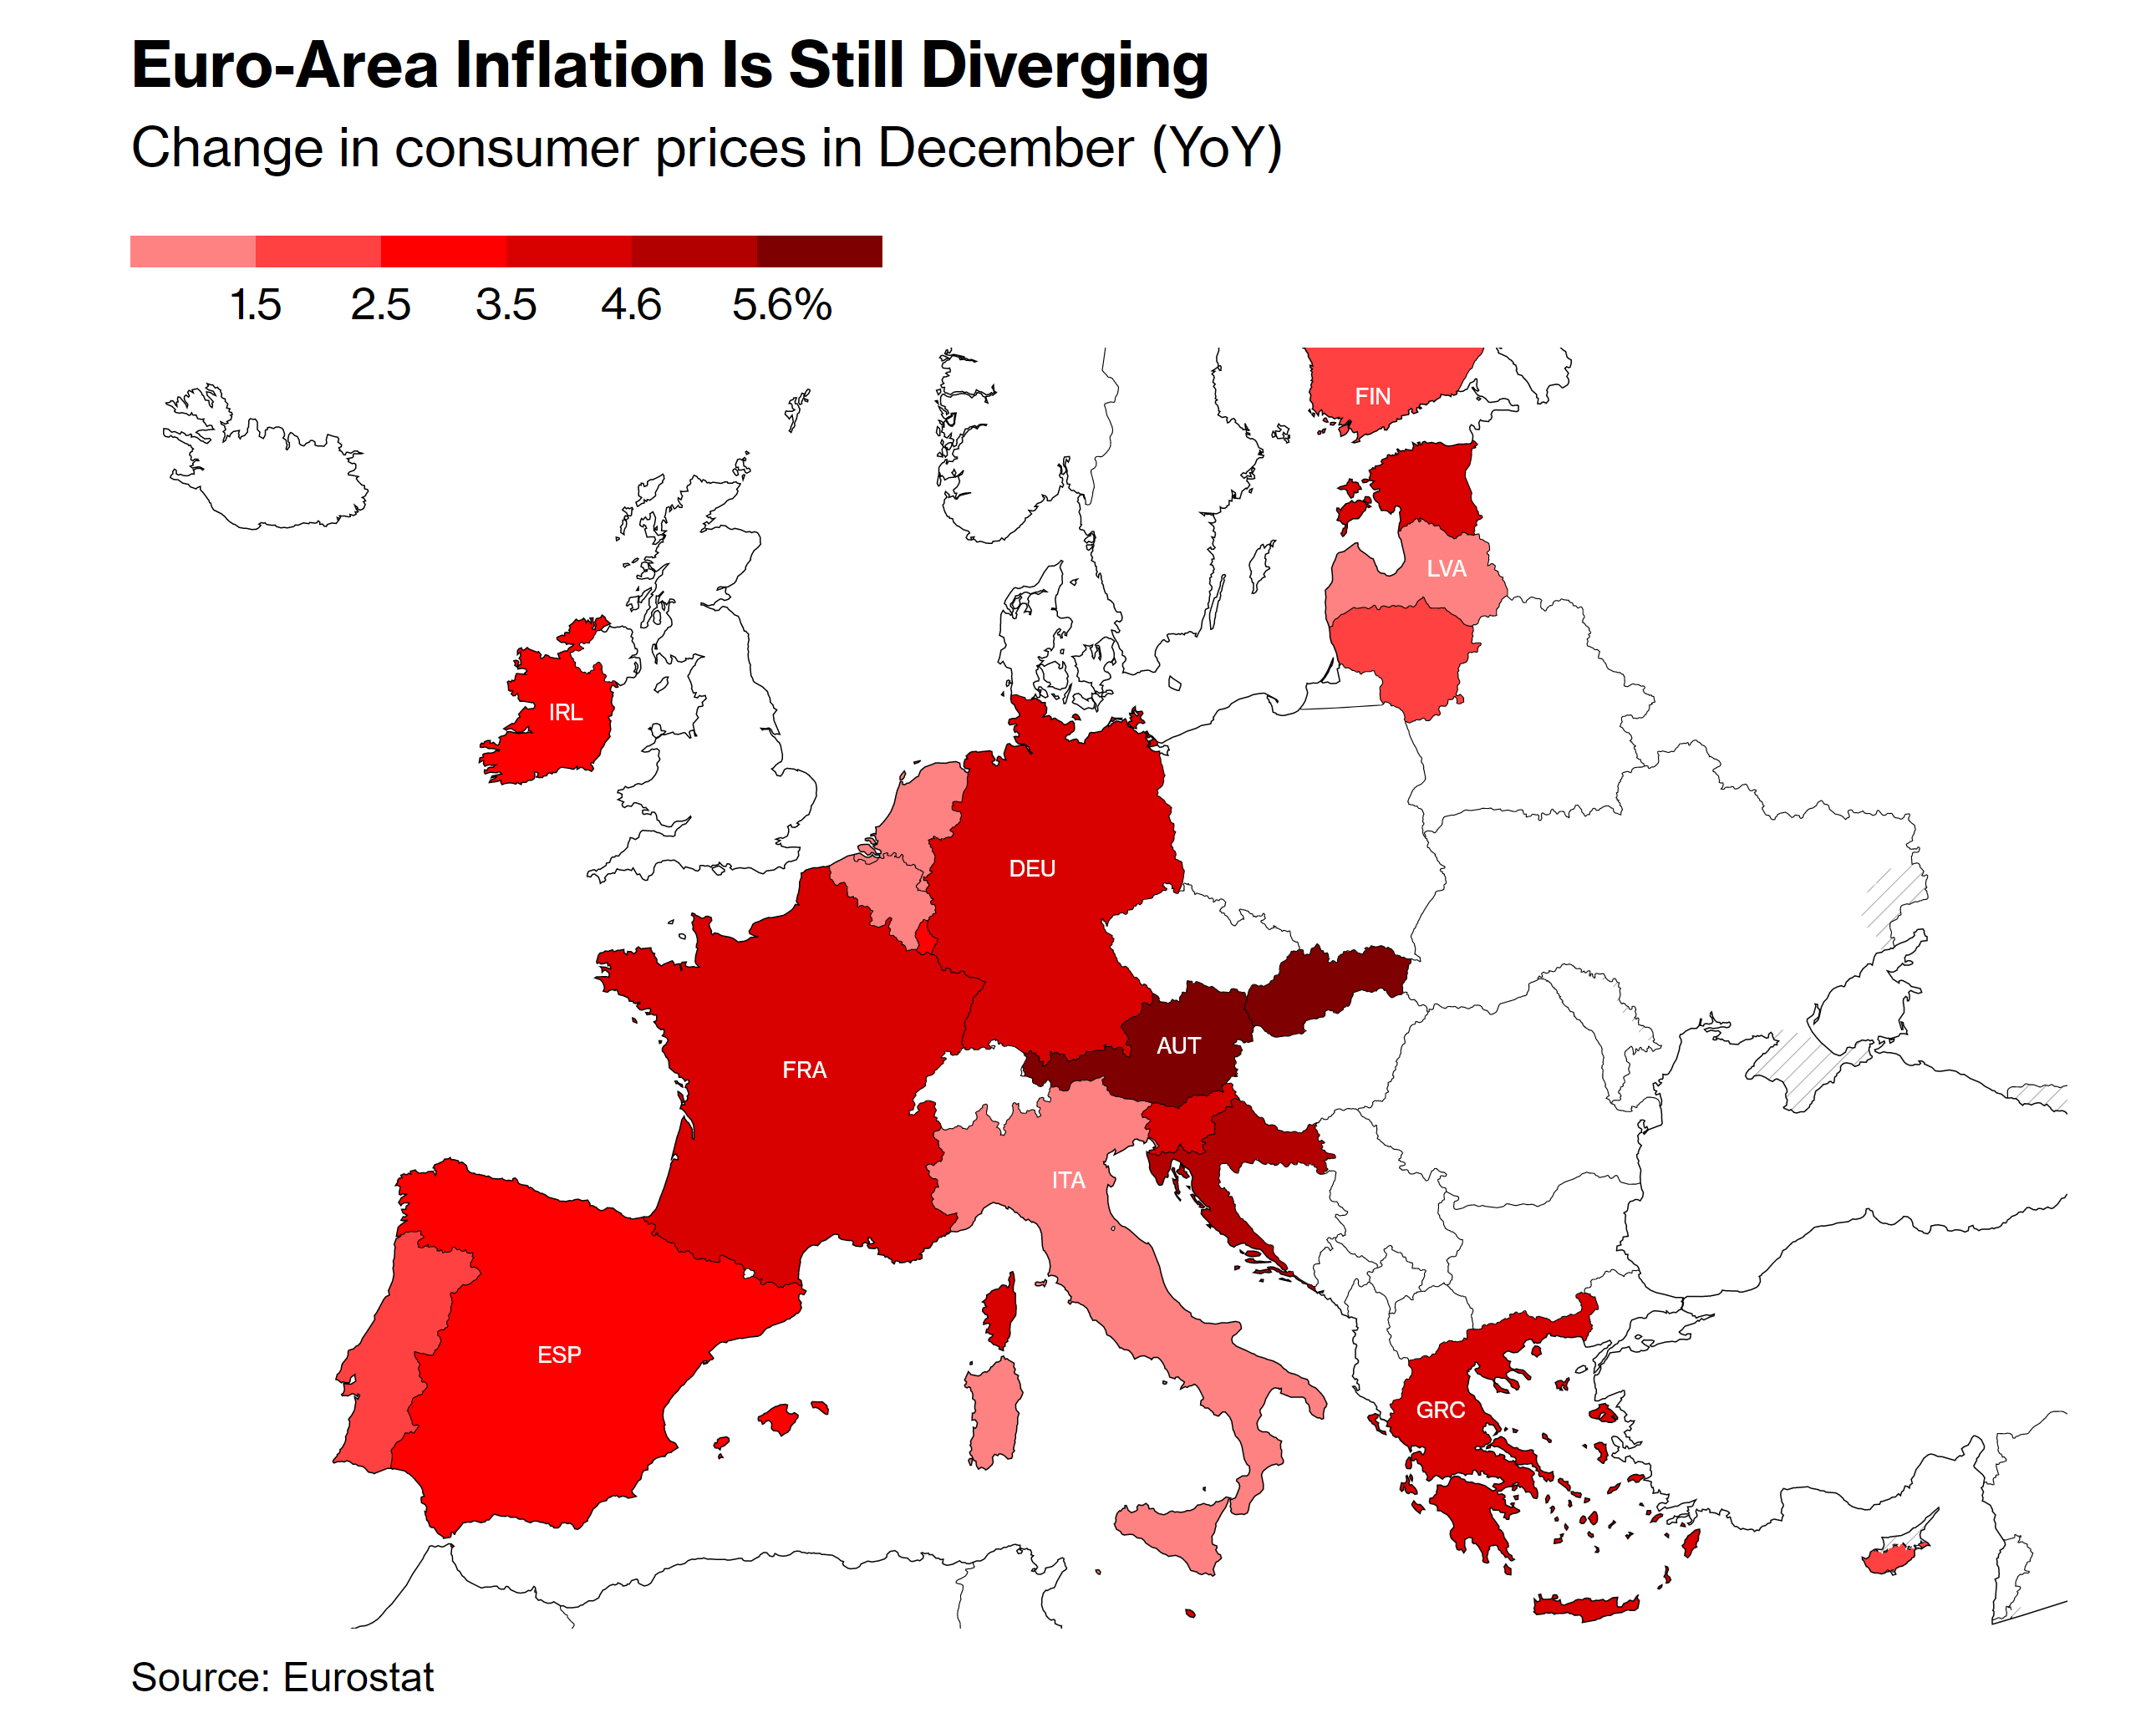
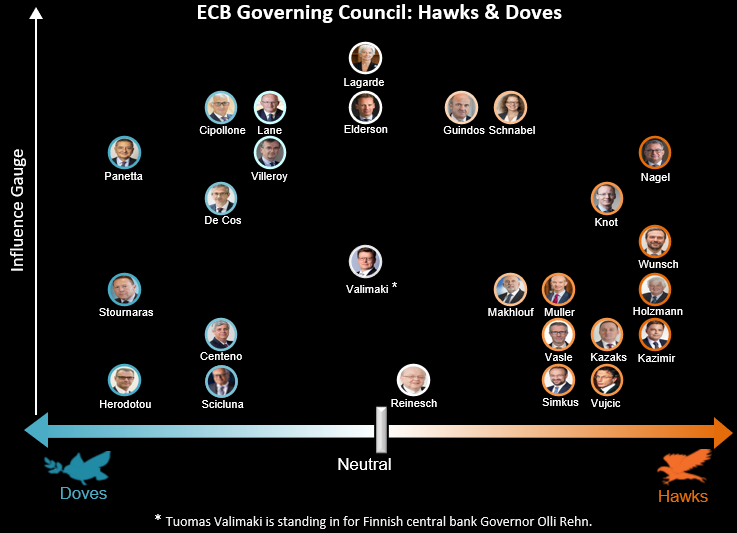
Figure 14. European Central Bank’s Governing Council Monetary Policy Hawks & Doves:
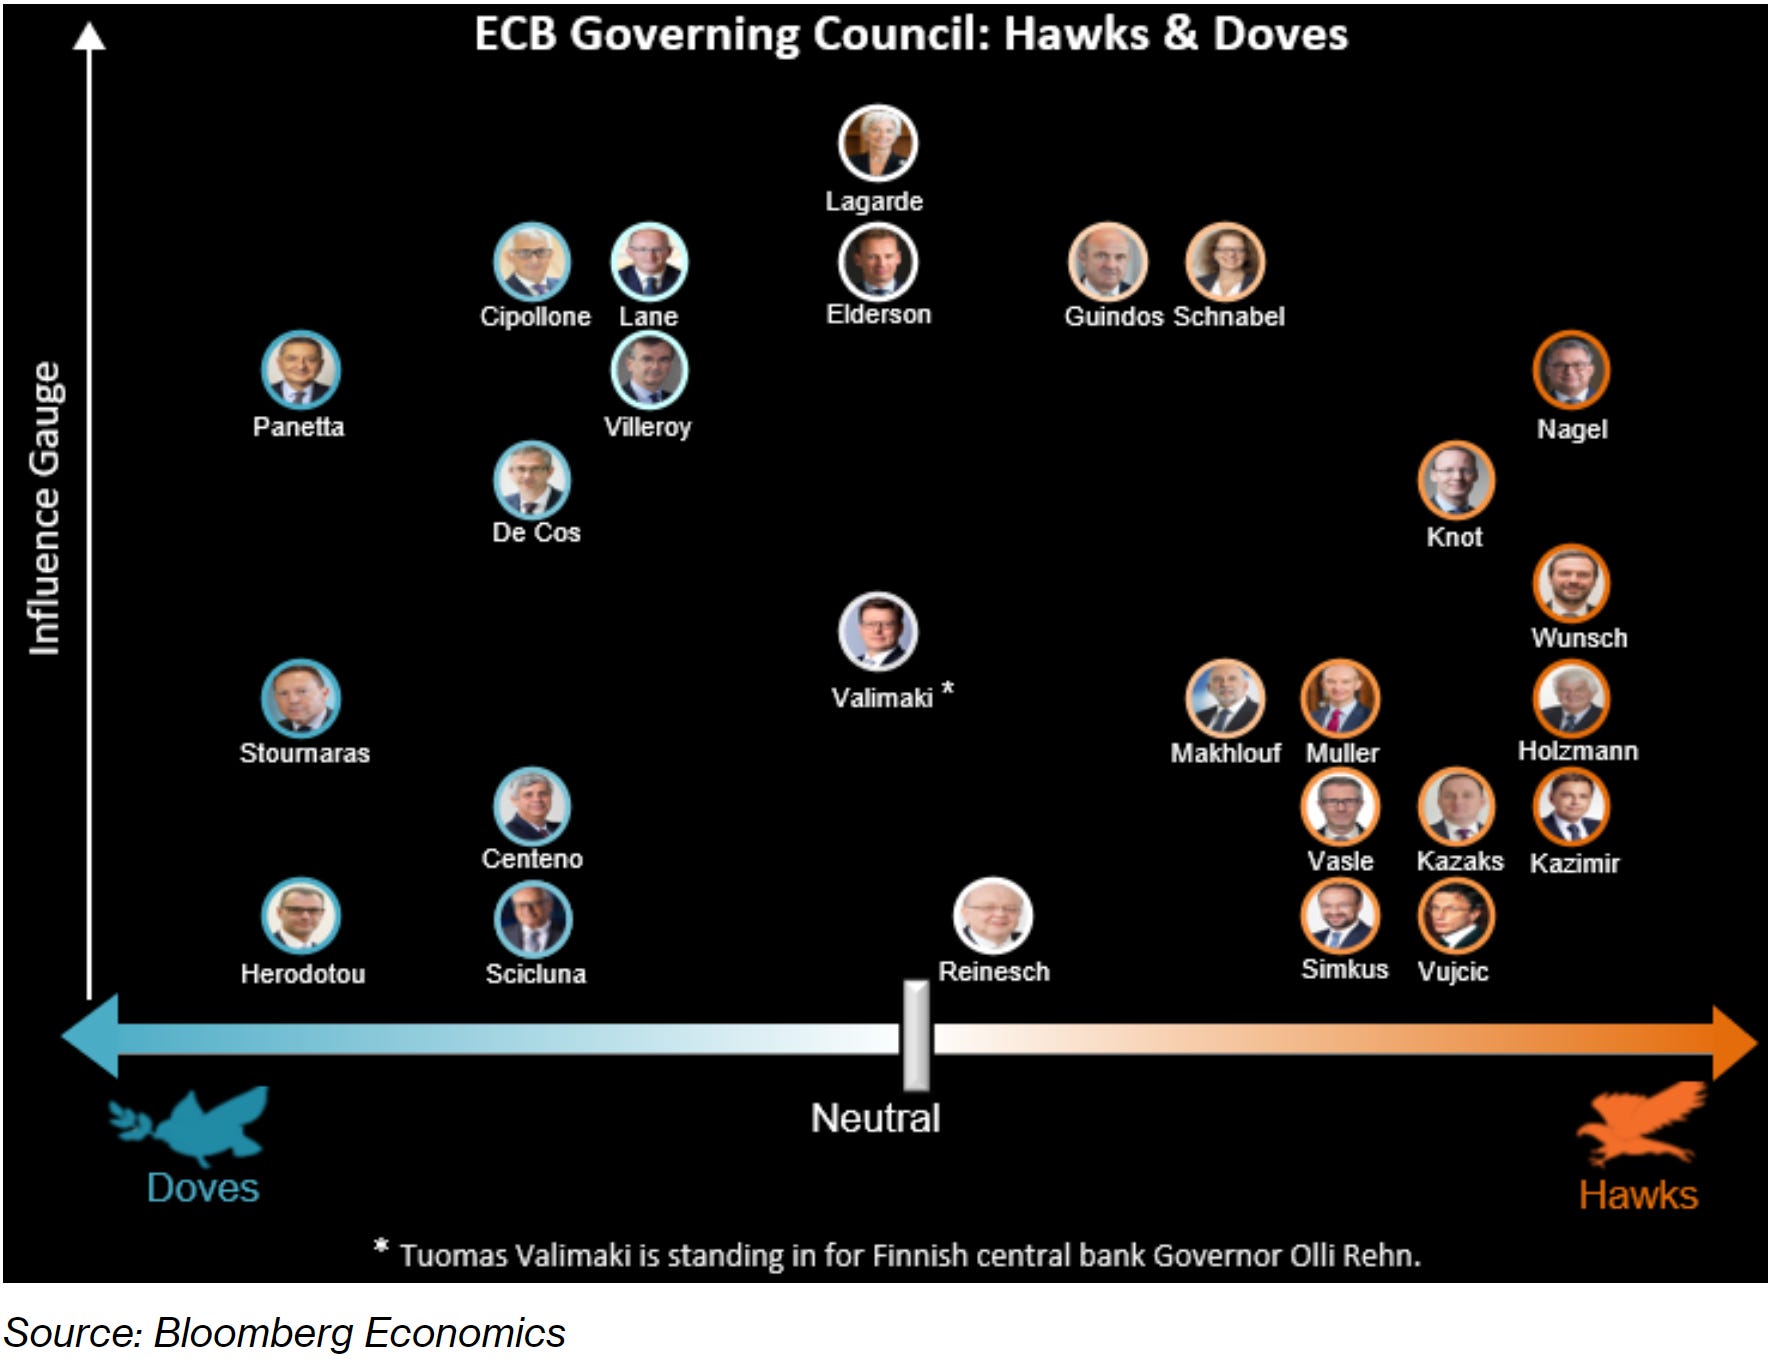
Figure 15. Market Expectations Over The European Central Bank’s Monetary Policy Rate:
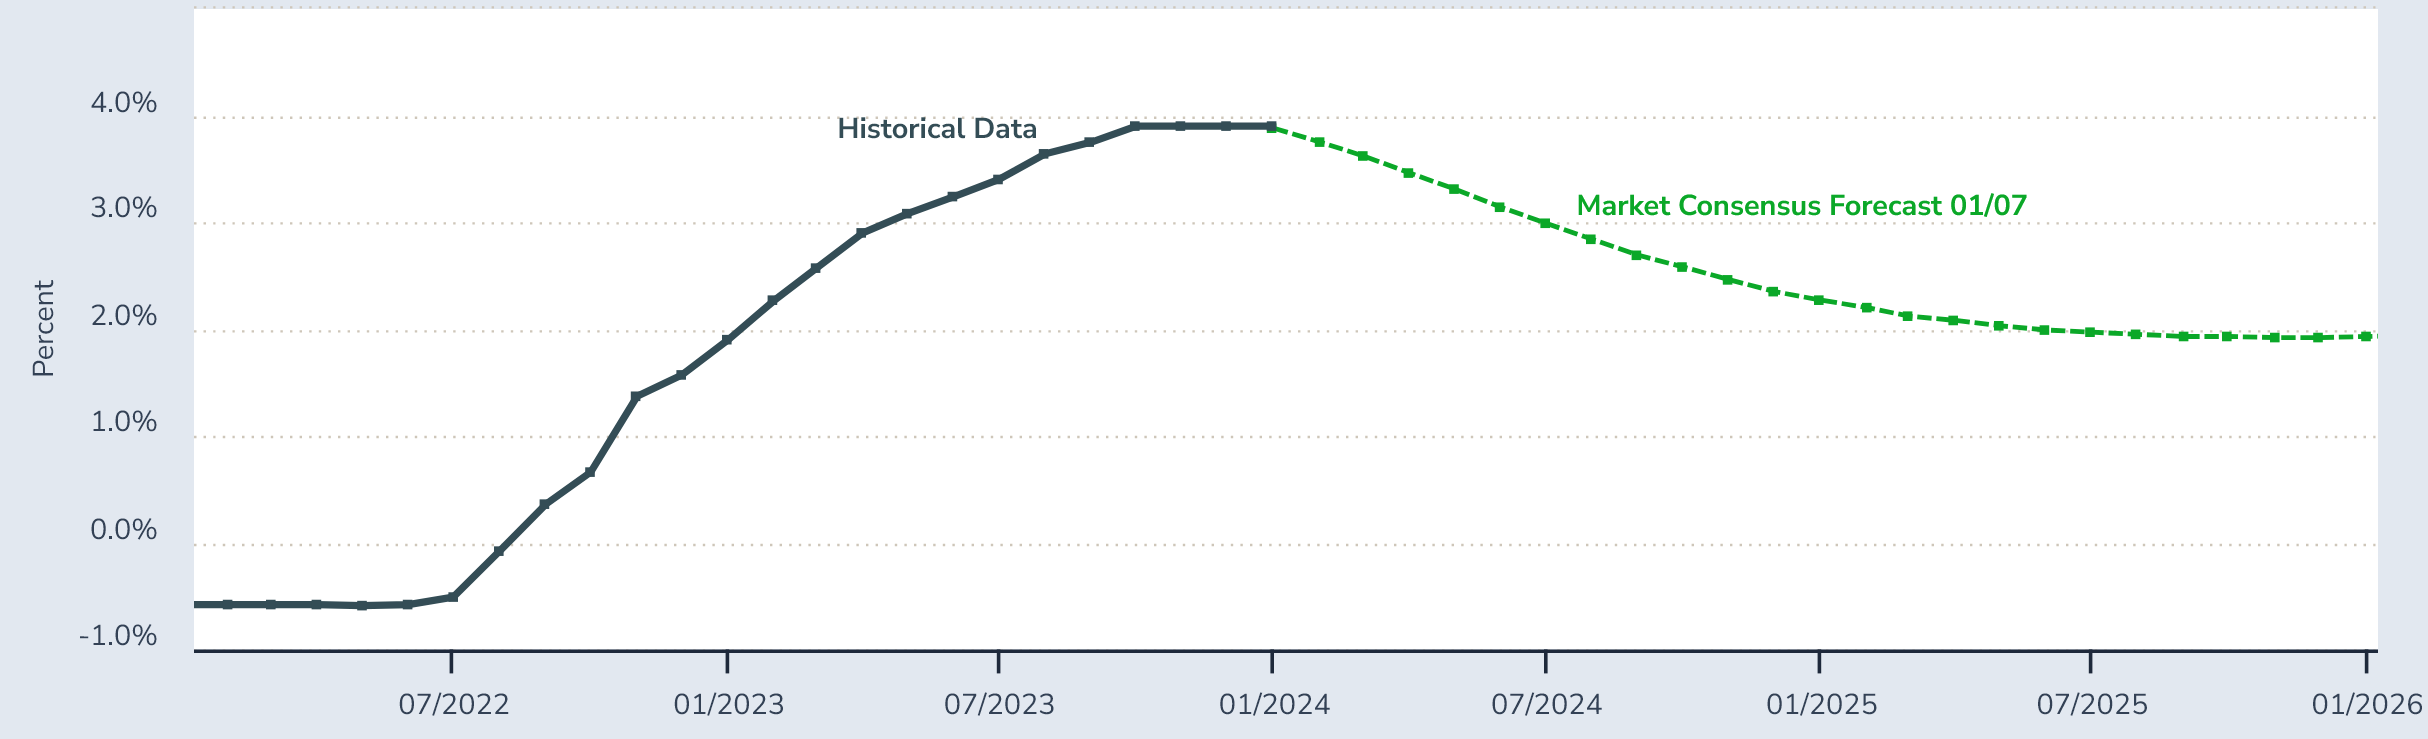
Given the fact that the European Central Bank's Ms. Lagarde has not signaled a monetary policy pivot, and the Euro-Area inflation remains higher than the European Central Bank's price stability goal, it is convenient to stay positioned ( i.e., hawkish positioning on the Euribor swaps while going long the currency, until the pivot is officially signaled ) accordingly in order to prevent shocks from more than likely monetary policy surprises to markets, as markets remain quite dovishly positioned while the European Central Bank governing council members remain reluctant to pivot monetary policy. Expectations are for rate cuts starting in the middle of the year, in line with some Governing Council members' expectations.
United Kingdom:
The United Kingdom remains within the range of expectations, optimism over statistics remains as markets expect the United Kingdom to achieve the Bank of England's price stability target within months. Markets remain far more dovish than what the Bank of England has signaled; alike to other global monetary policy peers of the Bank of England, the Bank of England's Monetary Policy Committee members remain hawkish.
Figure 16. Market Expectations Over The Bank of England’s Monetary Policy Rate:
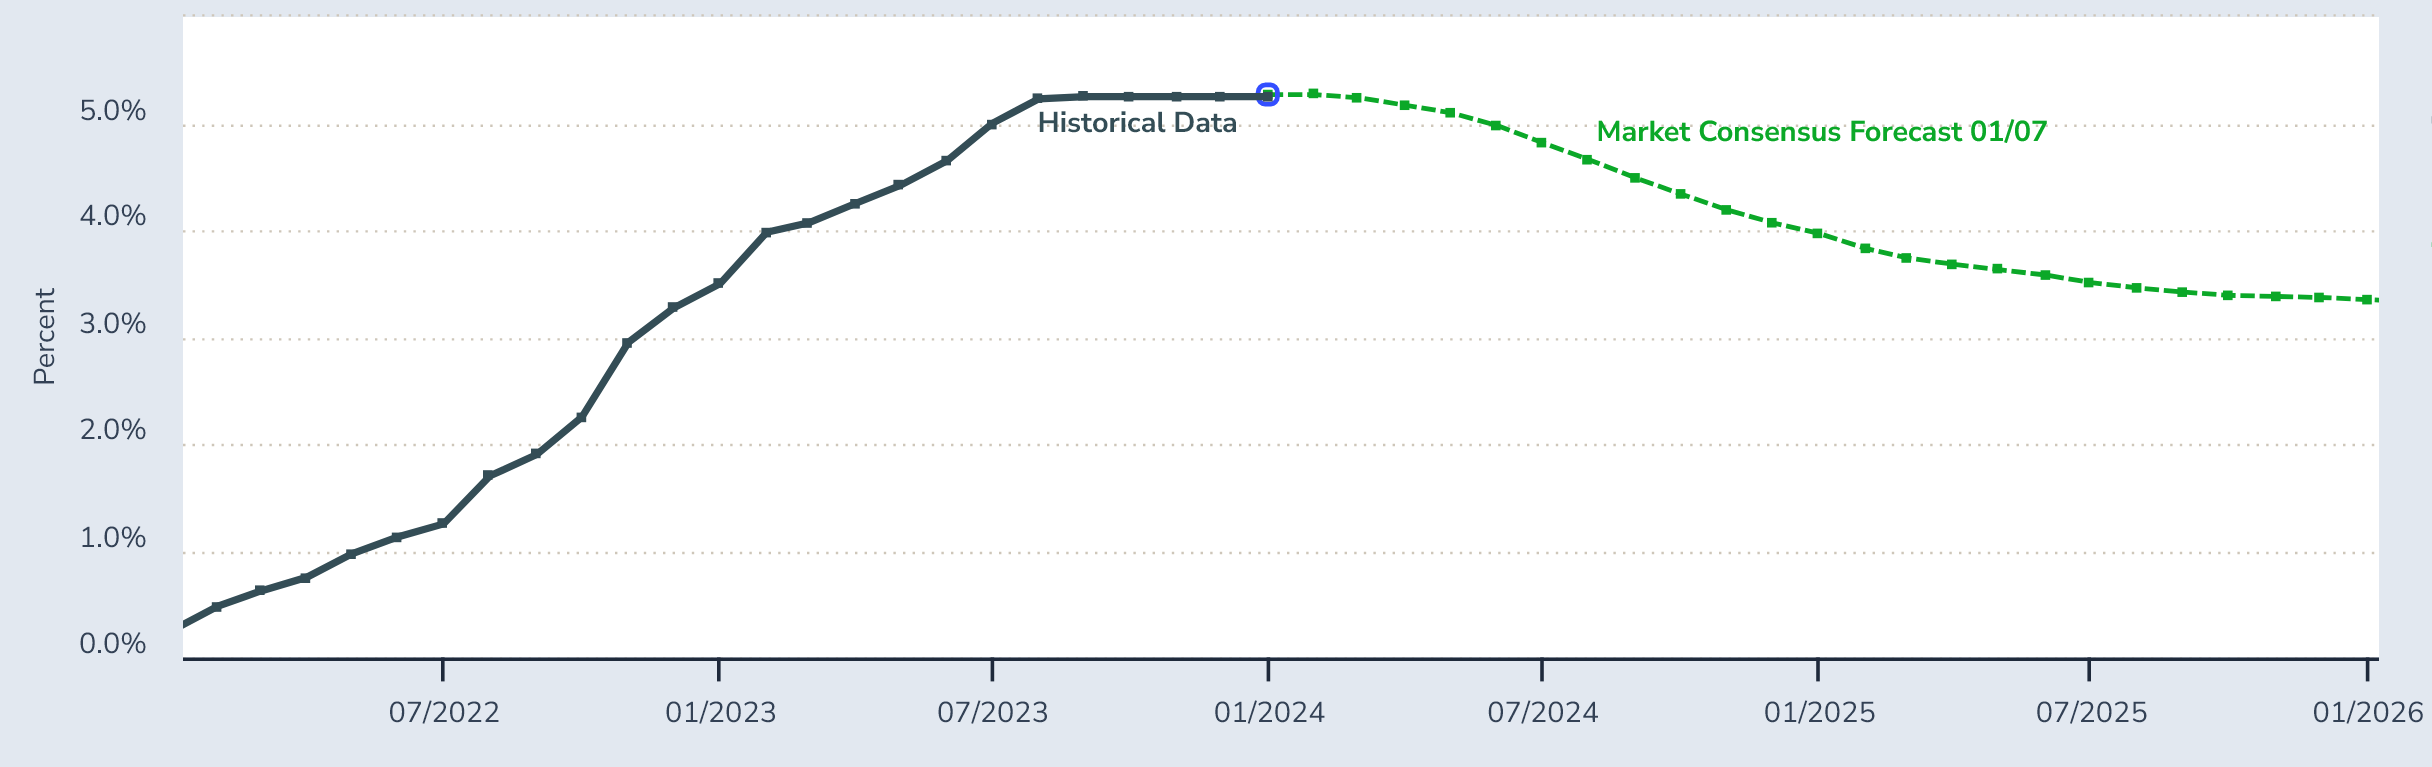
Next week's United Kingdom Gross Domestic Product ( GDP ) data release on Friday is expected to show expansion from the previous government report of -0.3% month-over-month contraction in the United Kingdom's economy.
Figure 17. Expectations Over Next Week’s United Kingdom Gross Domestic Product ( GDP ) Data Release:
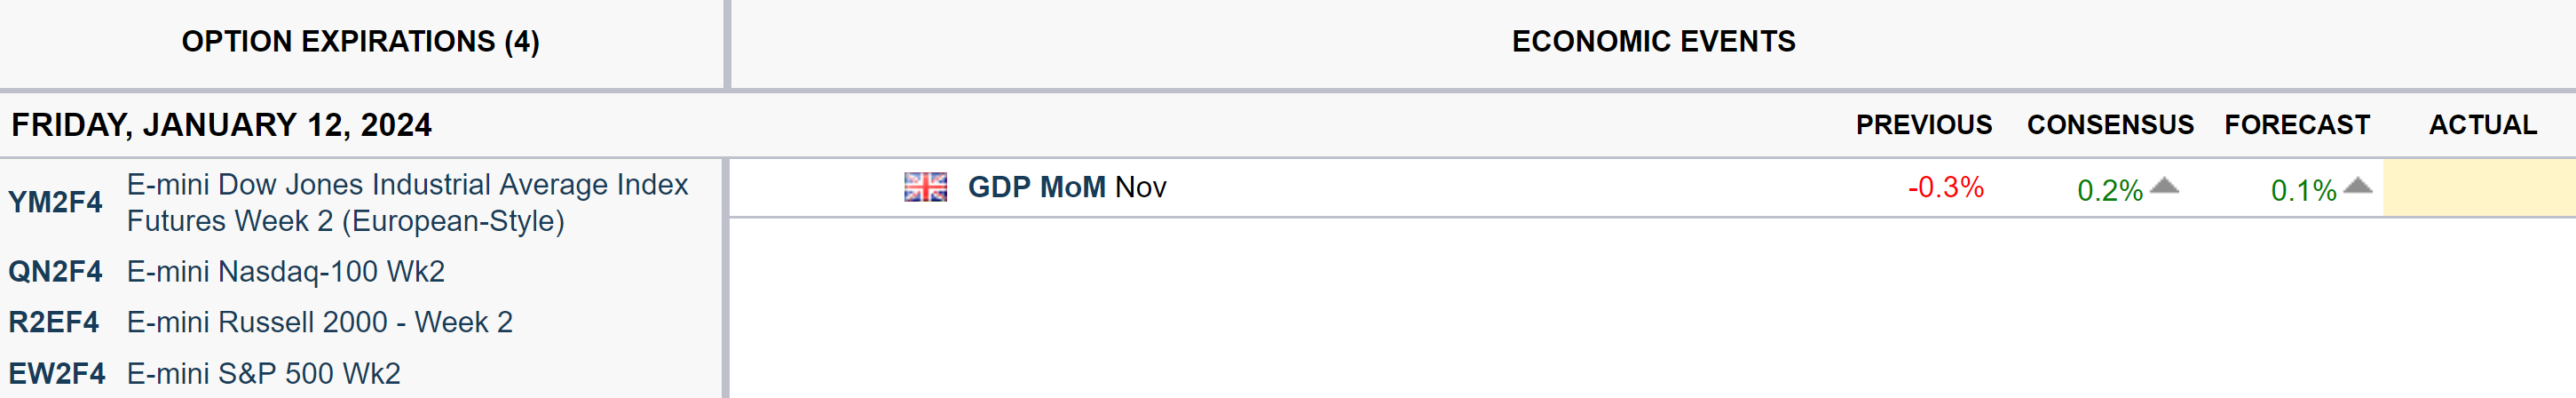
Figure 17.5 The United Kingdom At Risk Of Recession In The Previous Report.
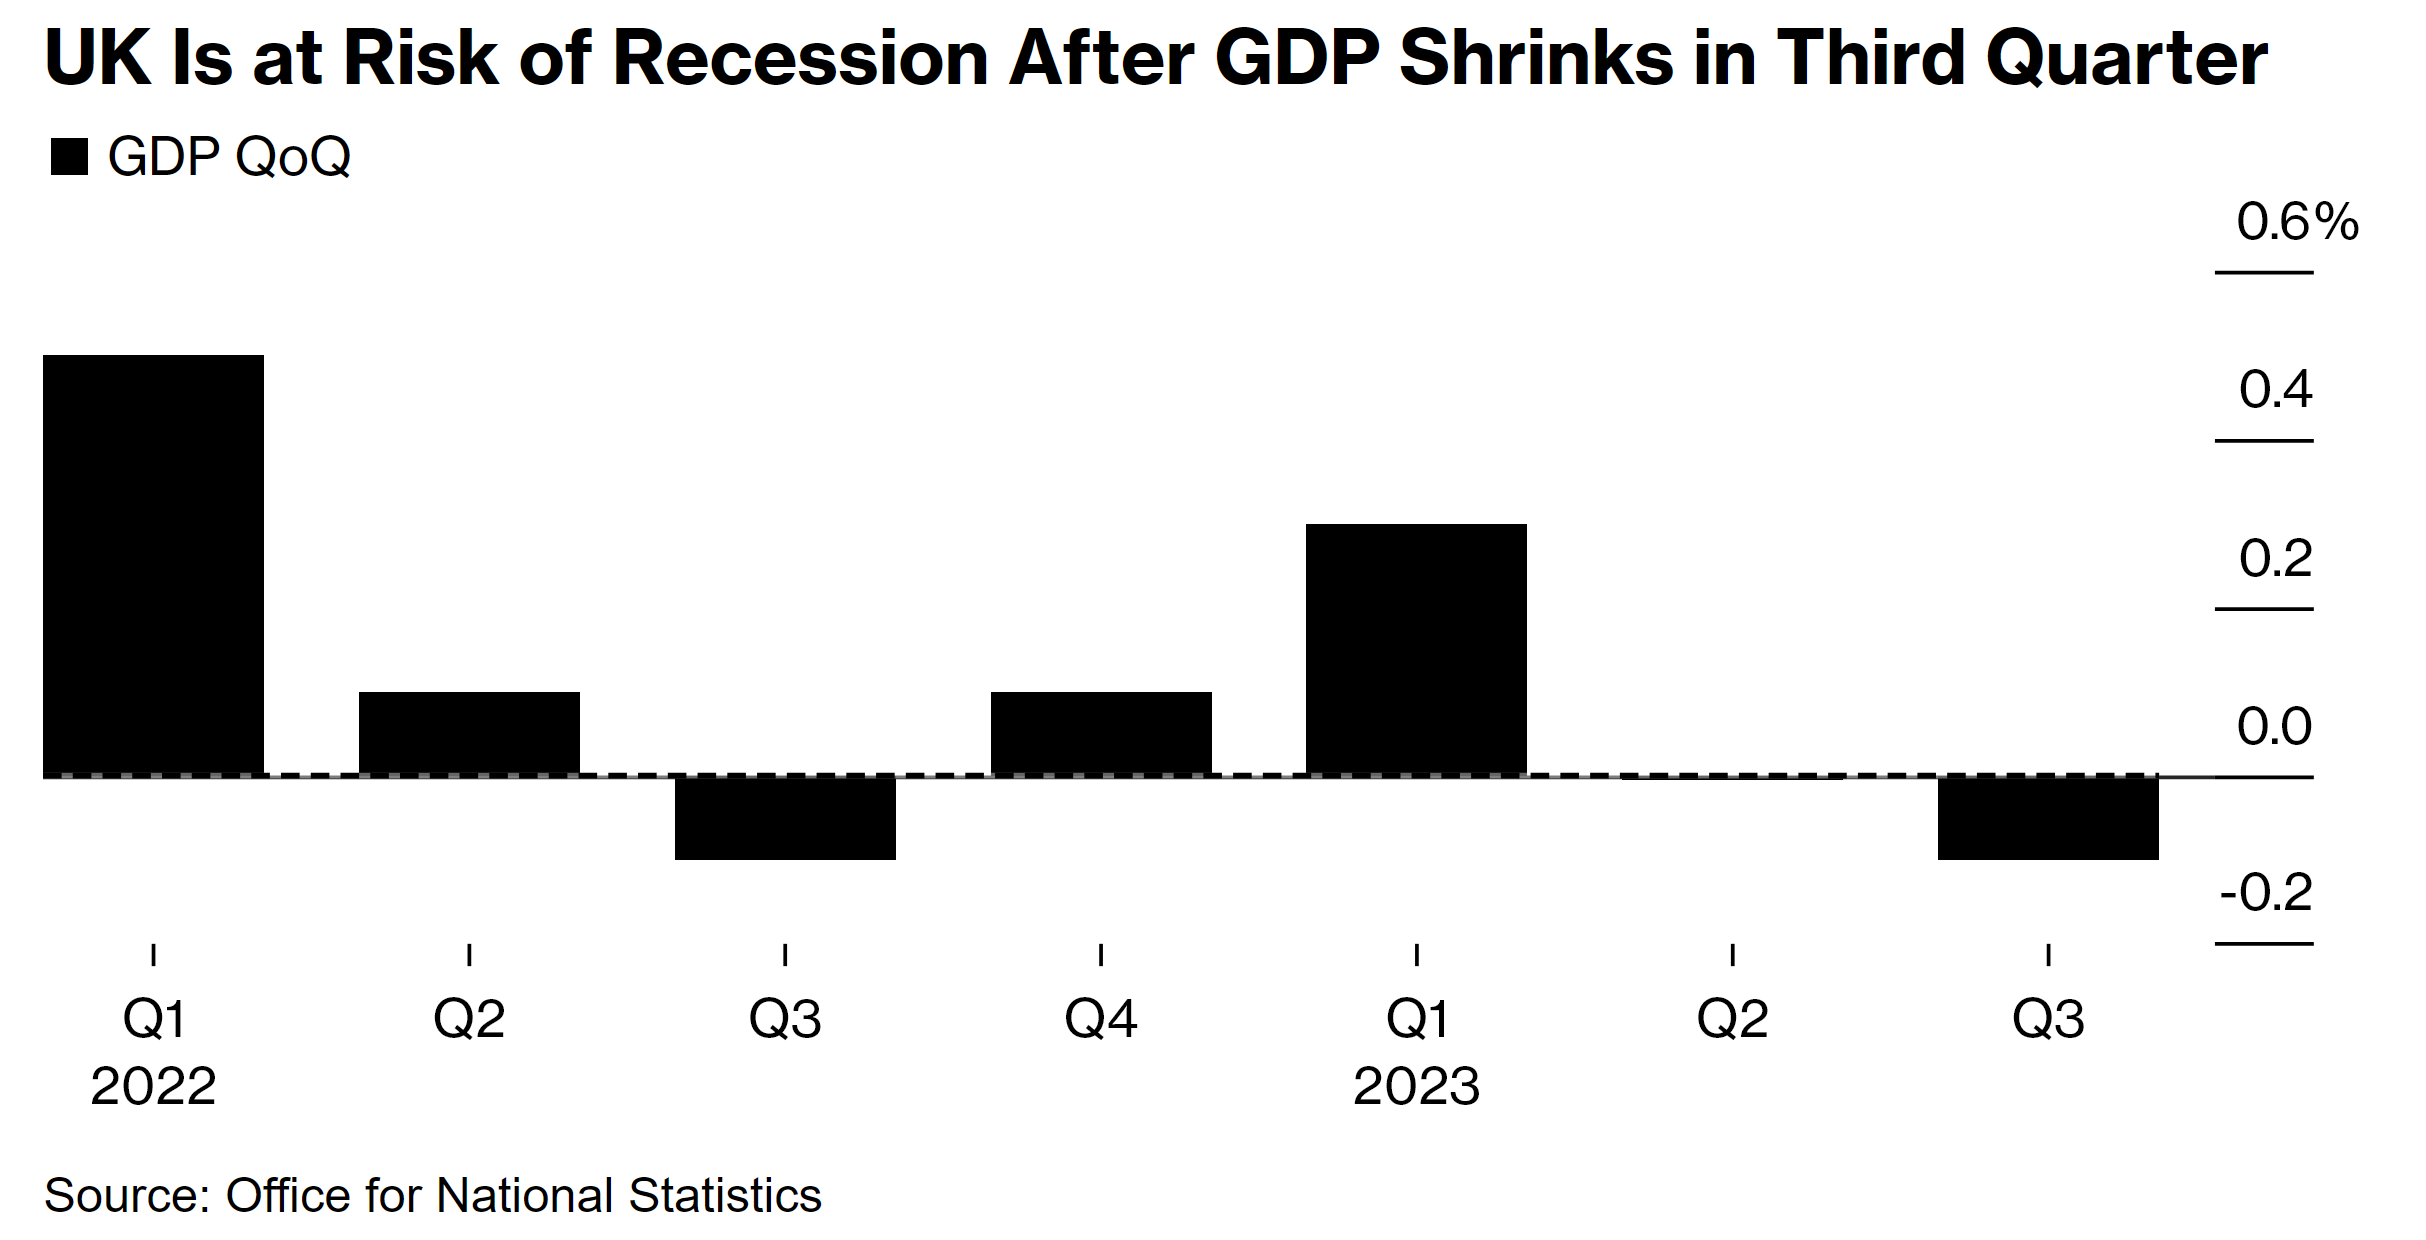
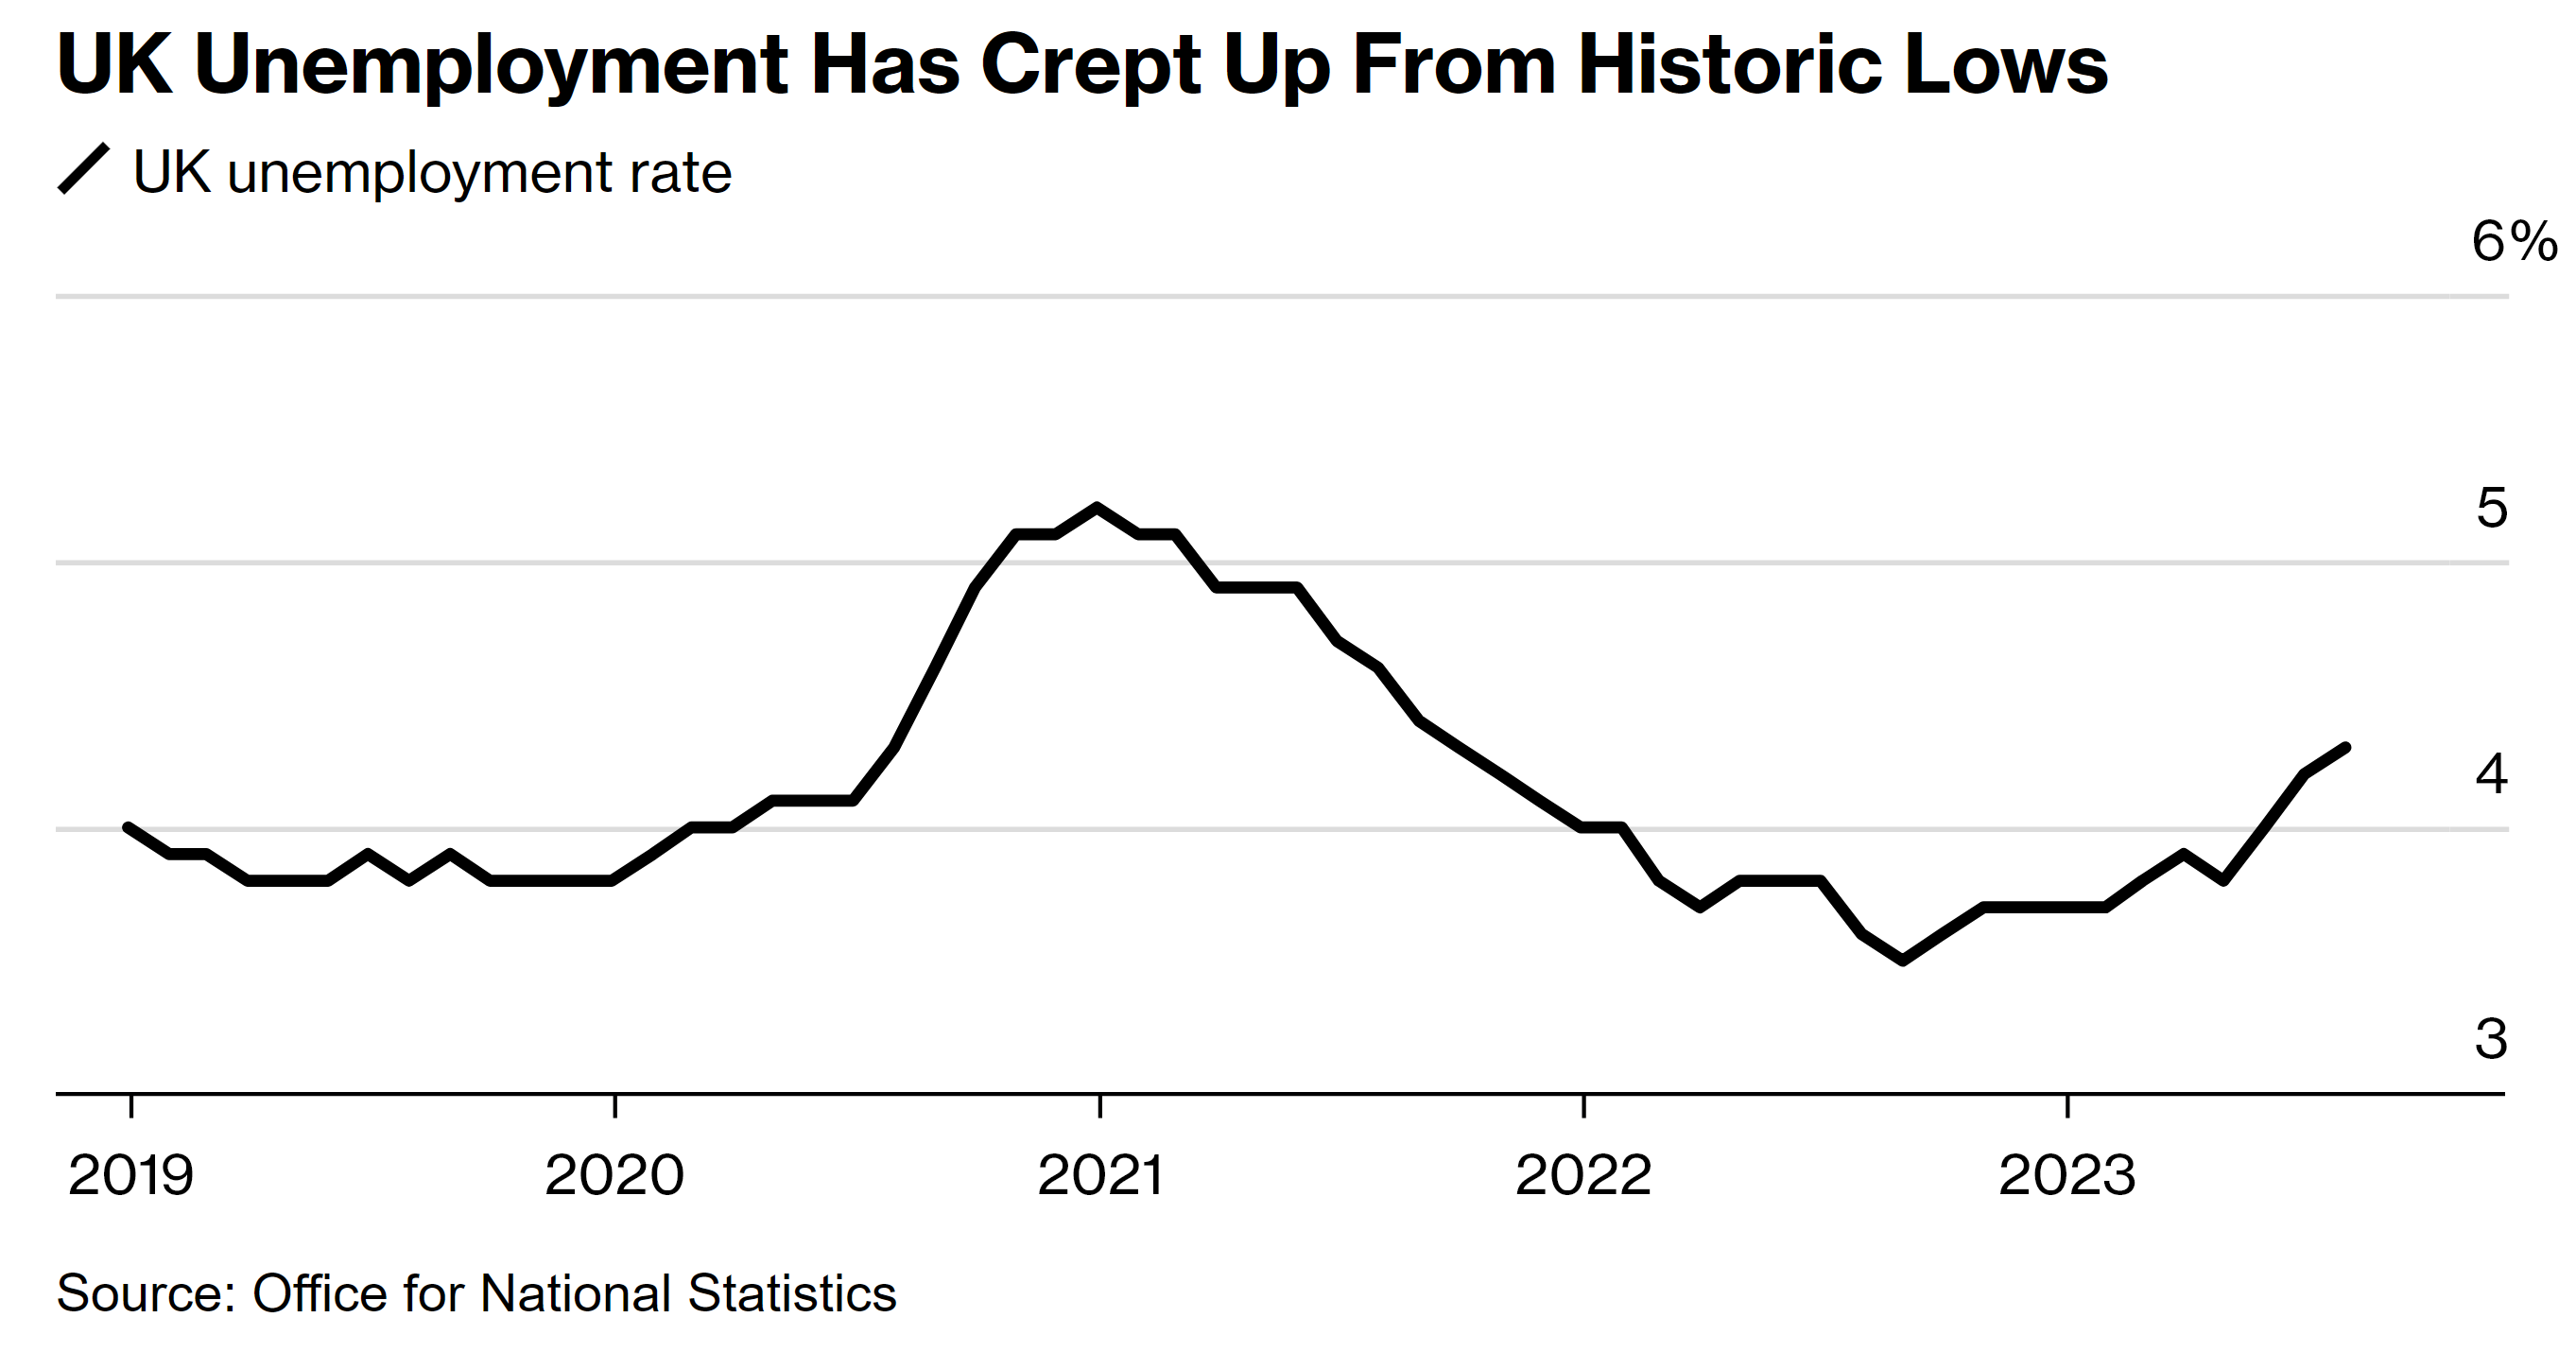
Positioning in the United Kingdom's markets remains bullish ( i.e., going long United Kingdom gilts while also going long the currency ) given the fact that inflation is slowly but steadily approaching the Bank of England's price stability target and given the fact that government measures are making sure that the United Kingdom's economy doesn't enter into a recession. Recession risk is something that has been emerging given increased concerns about employment statistics that show the United Kingdom's unemployment rising from historical lows, although expectations are for soft-landing achievement by the Bank of England.
Figure 18. Recession Concerns Increase As United Kingdom’s Unemployment Rises From Historic Lows.
Given the previously shown statistics, the forward expectations for the United Kingdom depend on next week's Gross Domestic Product data release, which consequently changes the Bank of England's Monetary Policy Committee's forward monetary policy stance depending on the statistics' strength or weakness; it is quite literally the first most important statistical data release of the year for the United Kingdom.
Asia:
China:
The New Year speech by 习近平 indicated that China will surely be reunified, which doesn't come as a surprise; markets ( MCHI 0.00%↑ ) aggressively reacted to 习近平's hawkish stance. The Taiwan ( FLTW 0.00%↑ EWT 0.00%↑ ) elections are near, and the statistics show the Democratic Progressive Party candidate leading the polls, something that will more than likely increase geopolitical tensions if elected.
Figure 19. The Taiwan Election's Statistics:

Given the more than likely increase in geopolitical tensions, not only because of the reunification message but also due to the previously mentioned new members added to the BRICS Alliance this year who are either indirect or direct enemies of the United States’ Alliance. As mentioned before, LMT 0.00%↑ call ratio backspreads to hedge it. When it comes to the Chinese monetary policy stance, it is quite dovish; the People's Bank of China led by governor 潘功胜 is ensuring stability in the Chinese economy and markets through monetary policy measures; expectations remain the same.
Japan:
The Japanese economy has improved since the previous post, natural disasters such as earthquakes and tsunamis have been a source of concern for markets; the Japanese Yen remains somewhat strong, although it recently had the most volatile day since 2020. Recession risk is something that remains; although government measures keep the Japanese economy afloat, it is highly likely that inflation will rise in the near-term and long-run in Japan given government measures.
The Bank of Japan's monetary policy stance is slightly hawkish, although it remains dovish. Positioning in the jgb market remains dovish in the short-term and hawkish in the long-run, given forward expectations over inflation. Japanese markets remain cheap in dollar terms, there are some Japanese stocks that are worth looking at, especially in the pharmaceutical sector; that sector seems to be lagging compared to its major global peers. Expectations remain the same.
Do feel free, as it’s free, to share, leave a comment, and subscribe to Quantuan Research Substack if you want, by using the next buttons.
It's not about the money (the research is free); it's about sending a message (delivering alpha to the reader).
Note: If the text in the post is grey (example) it is because the source of data is linked; everything is linked in the text, so it’s not messy to add everything at the end like in some tweets.