


The Christmas Rally
Analysis of microeconomic data, macroeconomic data, political data, geopolitical data, and monetary policy with commentary on it.

H/T to Nico for the NYSE trading floor Christmas tree picture sent that is on the thumbnail of this post/thesis.

United States:
The United States economy is performing within the range of expectations, and statistics continue to show a resilient economy with a resilient consumer. Consumer inflation and rate expectations have shifted dovishly; consumer rate expectations have shifted the most dovishly since October 2020. The previously mentioned statistics can be seen in the next chart.
Figure 1. Consumer Rate Expectations At The Most Dovish Levels Since October 2020.

Markets continue to bet on the soft-landing path, geopolitical risks remain the same, and market conditions have improved the most in a while. The government shutdown risk remains something to be concerned about next year, as there really hasn't been any change in the current path, a path where there are government shutdown events every couple months when it used to be years; increased and increasing geopolitically-driven spending has been the main driver of those events. But government officials have signaled on various occasions that this may change; this was the main catalyst for further upside in the government bond market ( TLT 0.00%↑ ), which already had a bullish catalyst given the monetary policy pivot. As shown in a note post, market expectations are far more dovish than what FOMC officials' have signaled both in public statements and official projections.
As explained before, the 4% neutral rate in the long-run has been unwinded by markets in the SOFR market; this has been the main driver for markets ( DIA 0.00%↑ SPY 0.00%↑ QQQ 0.00%↑ IWM 0.00%↑ ) pushing to new all-time highs as the spread between the long-run expected rate path and the current priced rate path widened, giving space for arbitrage. The contrast between what markets are pricing over the rate path and what FOMC officials project can be appreciated in the next two charts.
Figure 2. Market-Priced Rate Path Updated From The Previous Post.
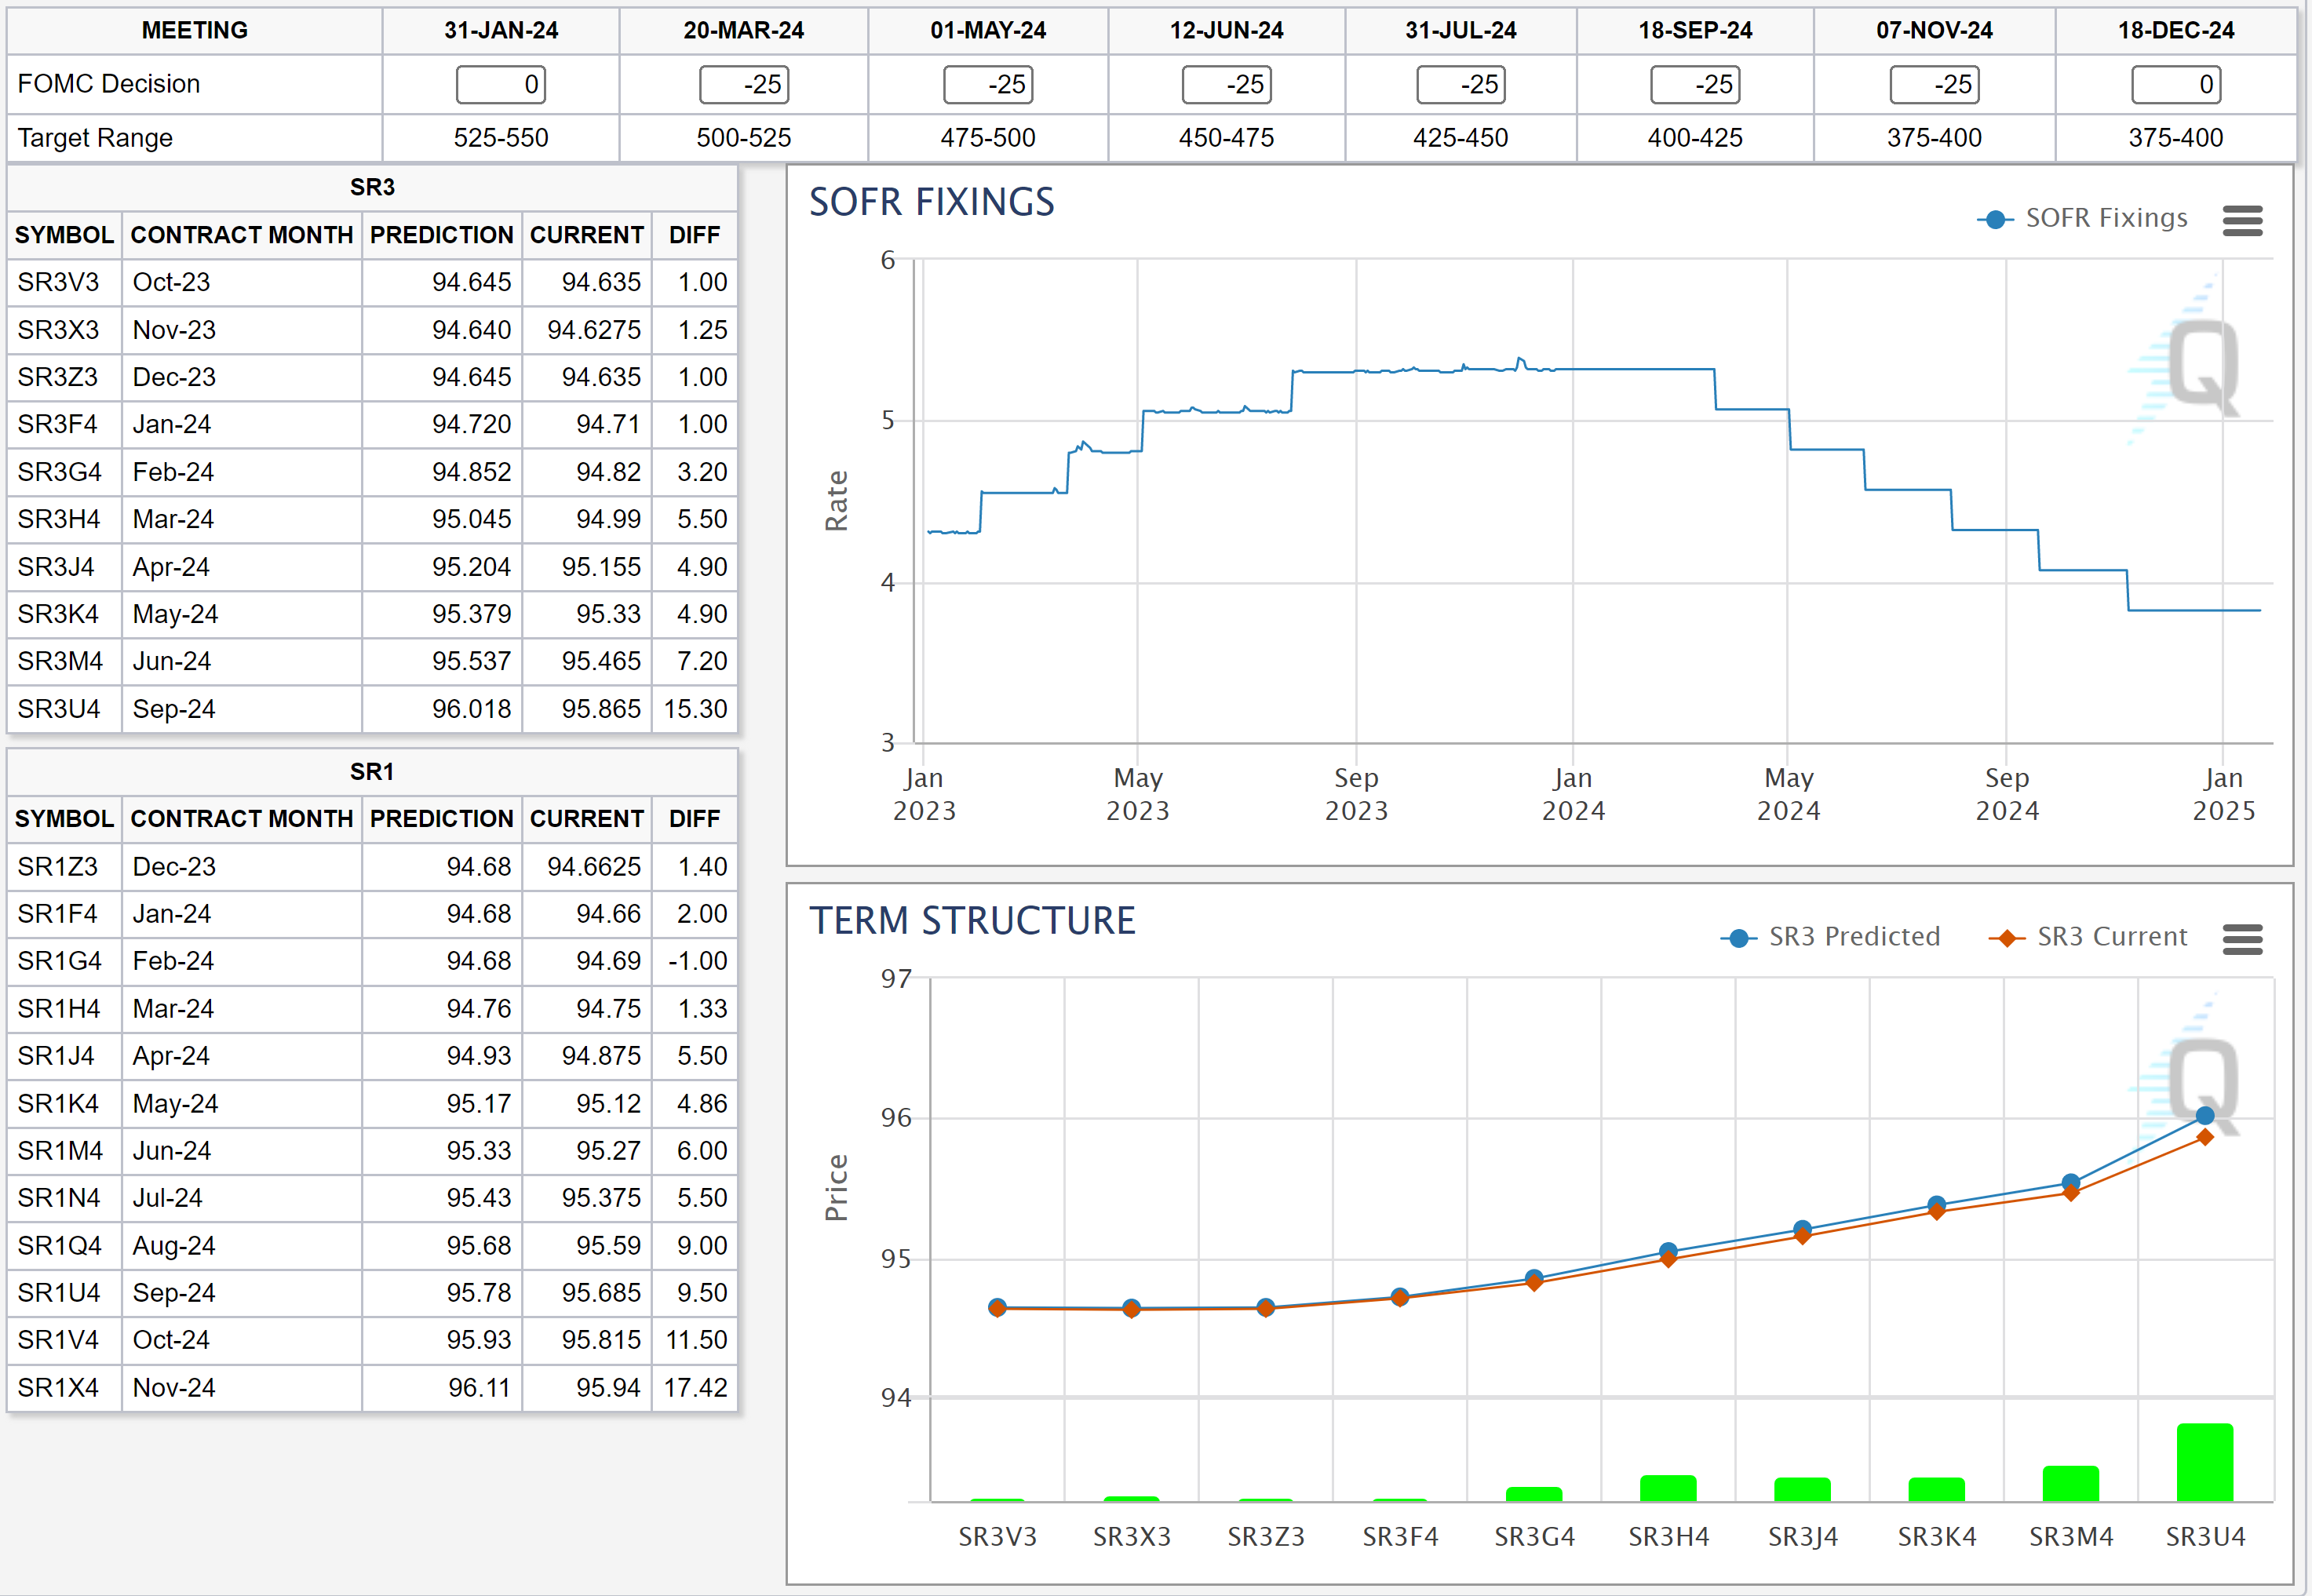
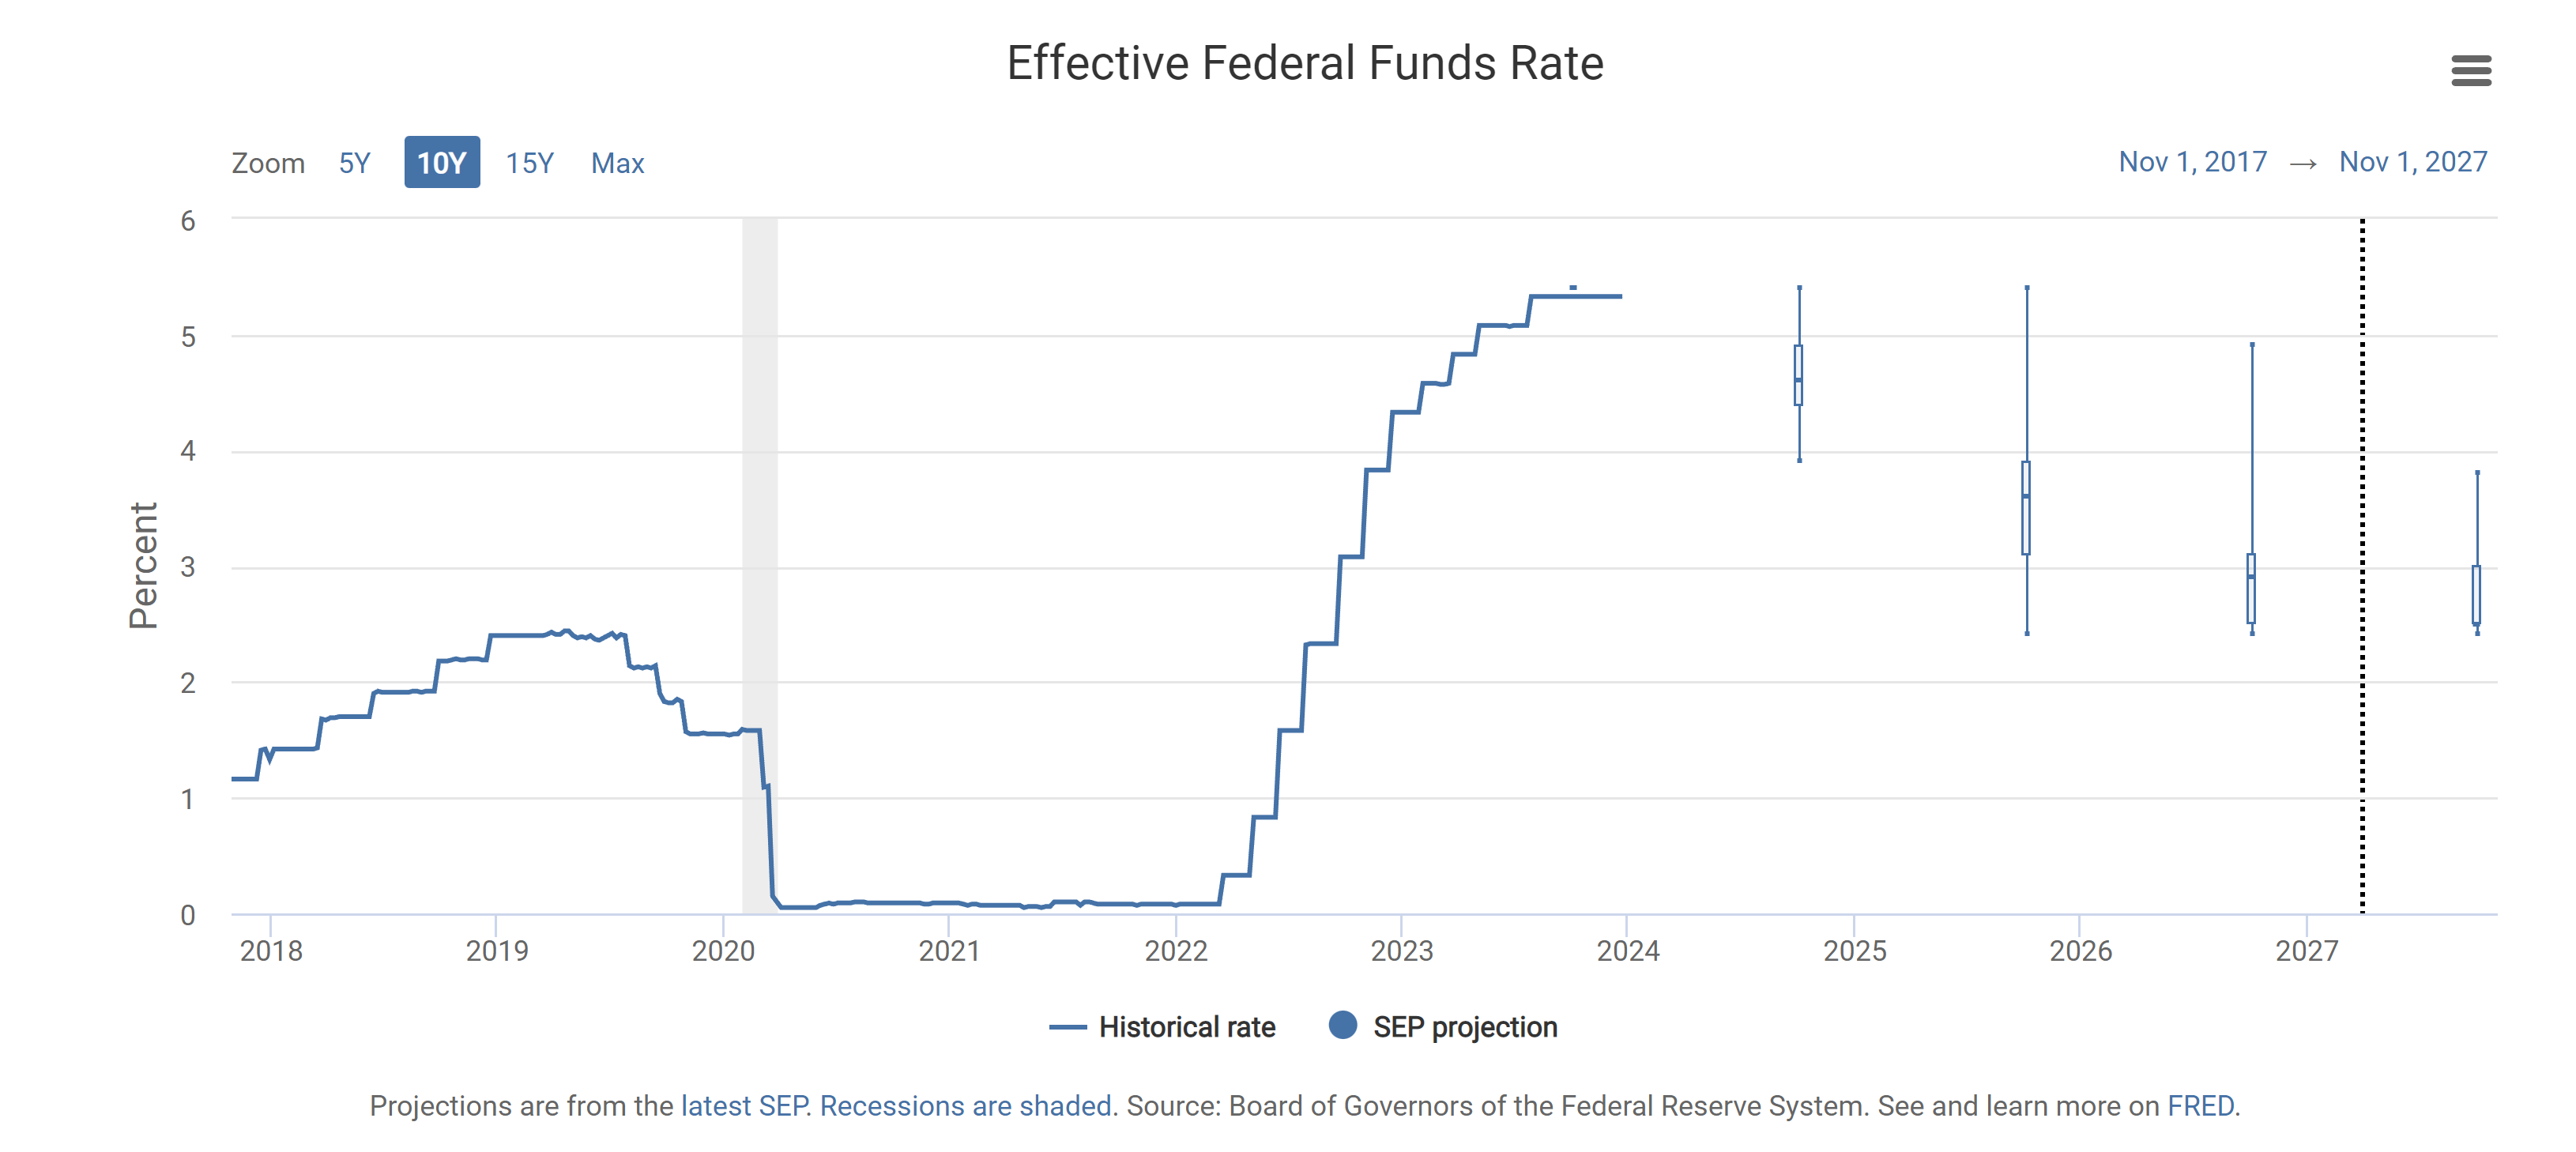
Figure 3. FOMC officials’ Rate Projections.
Positioning remains risk-off mode ( PWR 0.00%↑ FERG 0.00%↑ BLDR 0.00%↑ COST 0.00%↑ DB 0.00%↑ WTS 0.00%↑ ITW 0.00%↑ ETN 0.00%↑ ROAD 0.00%↑ KAI 0.00%↑ GFF 0.00%↑ DBC 0.00%↑ WOR 0.00%↑ CCJ 0.00%↑ MUSA 0.00%↑ FCN 0.00%↑ GM 0.00%↑ NDSN 0.00%↑ LECO 0.00%↑ BIL 0.00%↑ INTC 0.00%↑ FLT 0.00%↑ XOM 0.00%↑ CAT 0.00%↑ ADP 0.00%↑ TDG 0.00%↑ GWW 0.00%↑ URI 0.00%↑ ) until next year; market performance reflects the confidence of markets in the economy, justified by statistics and reinforced by the previously shown dovishness.
Figure 4. Deutsche Bank CROCI US Plus Index Total Return.
( Left X-axis: Index data. | Right X-axis: Volatility of the index. )
")
Figure 5. Deutsche Bank CROCI US 5% Vol. Control Index.
( Left X-axis: Index data. | Right X-axis: Volatility of the index. )
")
The current question remains: How will markets react to a more than plausible world war? Current government expenditures are barely held by markets; World War spending could send the United States into a recession and consequential hyperinflation; the worst-case scenario is the United States alliance losing the war before it even starts just because of hyperinflationary government spending. The only market that seems to be pricing it is the foreign exchange market ( $DXY ). The dollar ( $DXY ) has lost value driven by two factors: speculation and the monetary policy pivot, previously explained in October.
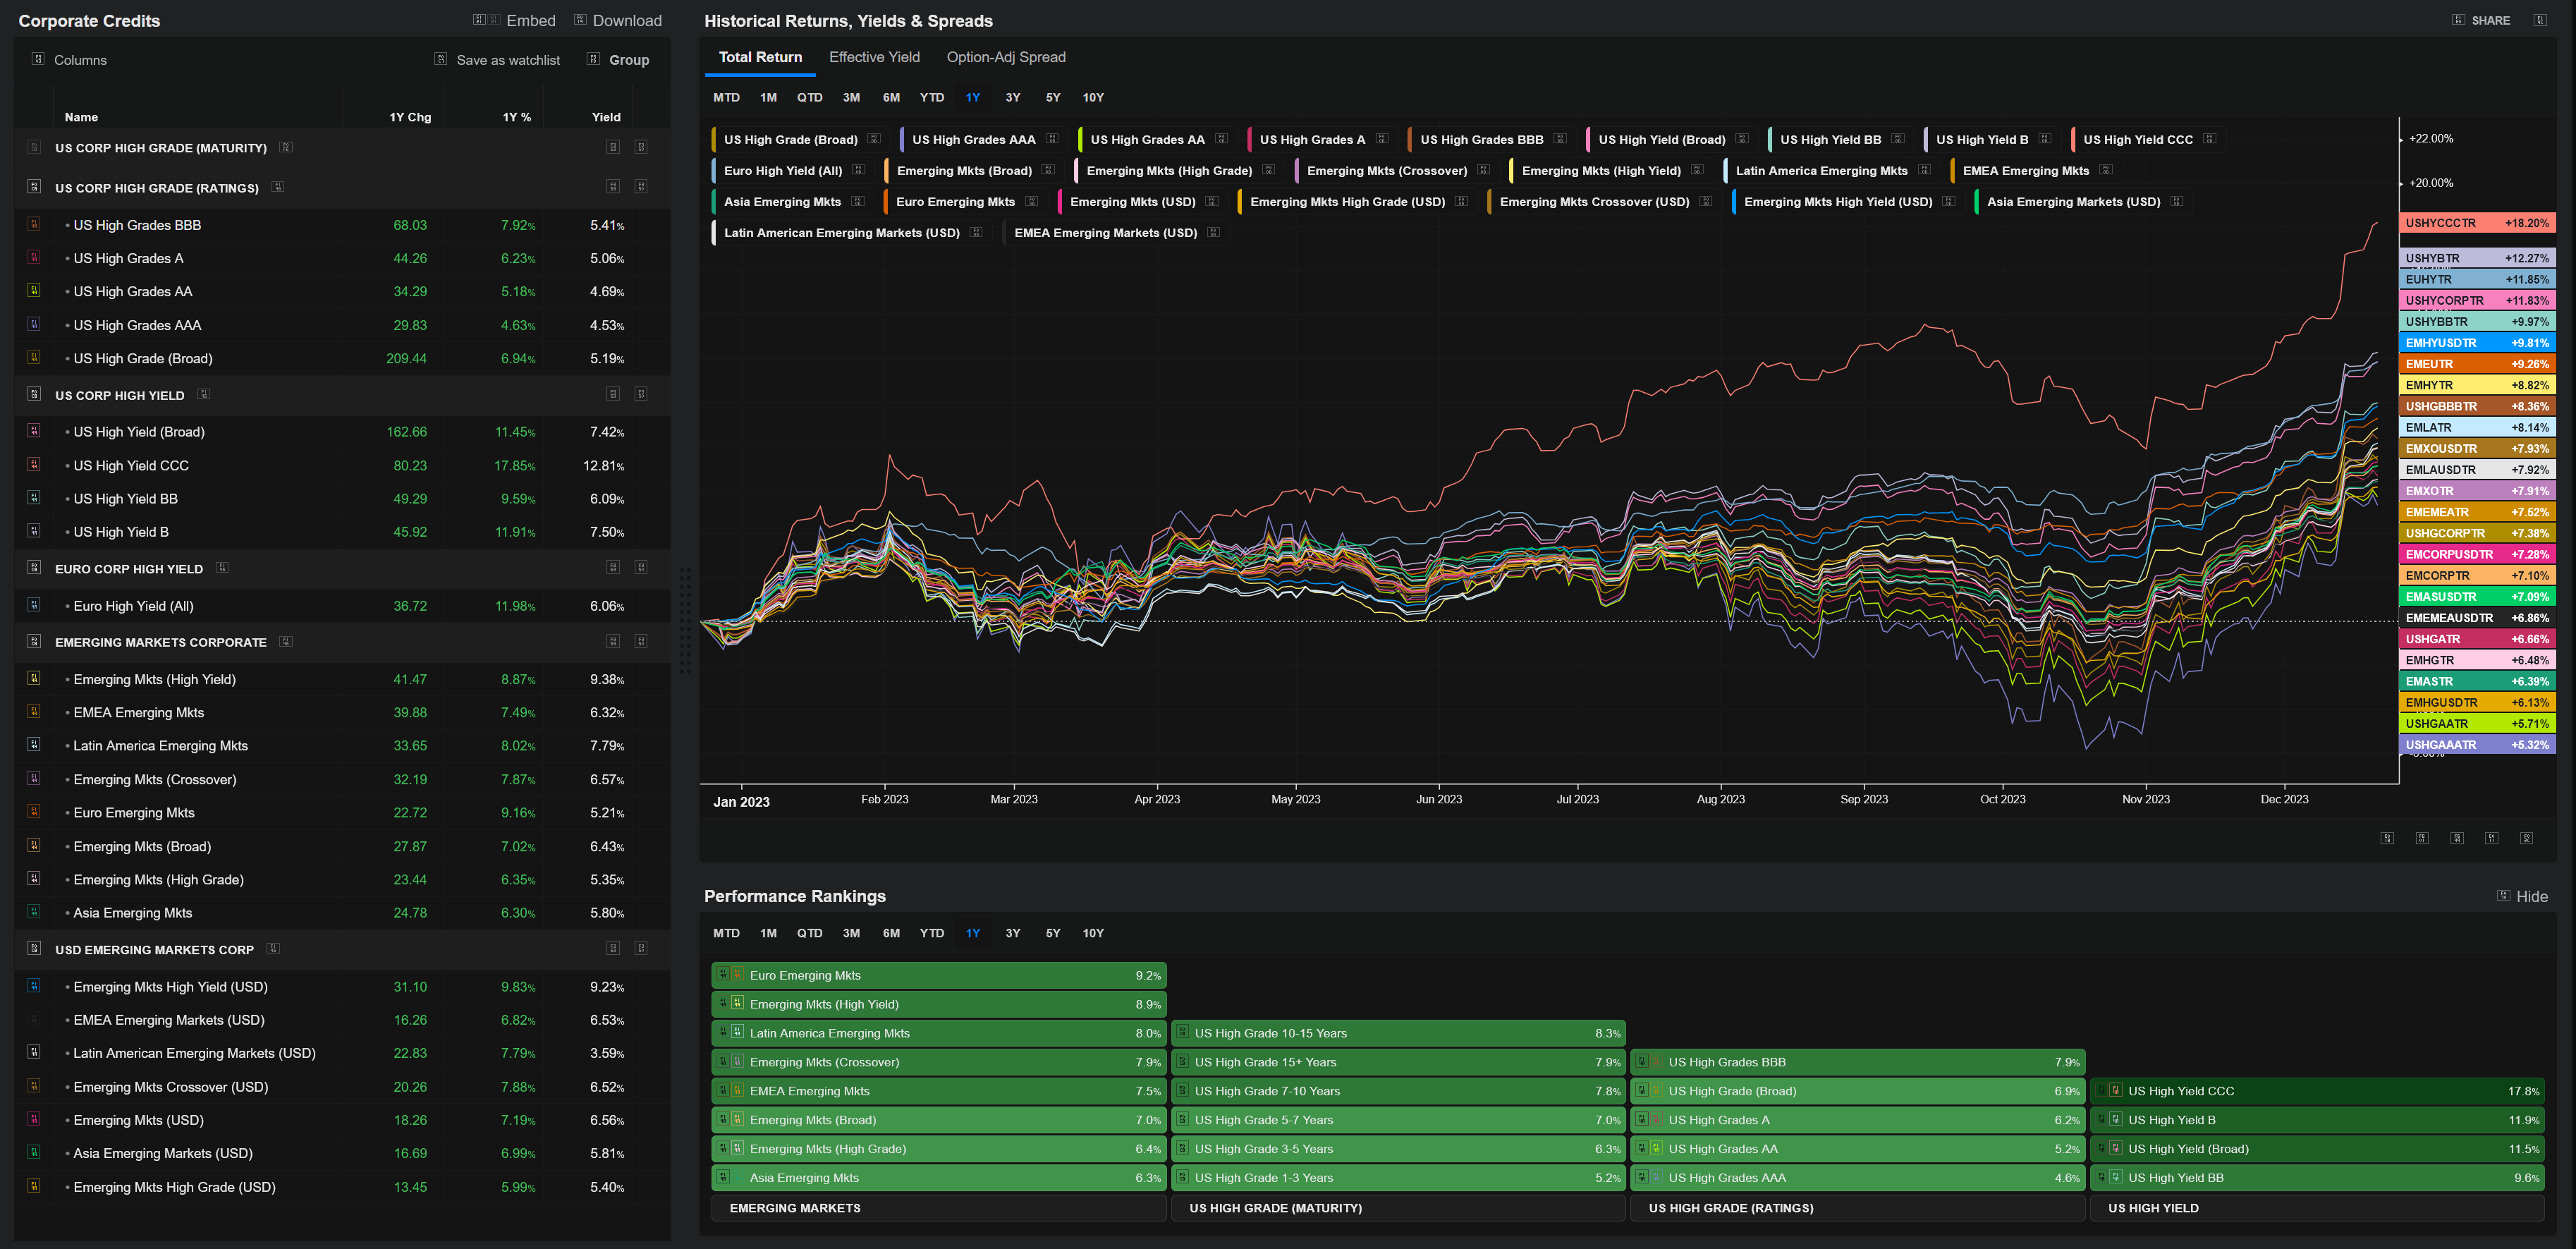
The credit market has rallied the most in years, with market conditions improving; emerging market bonds remain something to be looking at in 2024 as they are lagging in the rally. This can be seen in the next chart.
Figure 6. The Credit Market Has Rallied Since The November Monetary Policy Pivot.
It's been notable that high-yield ( SPHY 0.00%↑ ) moves in compass with new fintech ( FINX 0.00%↑ ) companies; for example, Affirm ( AFRM 0.00%↑ ) which is a commonly used company by Gen Z, moves in compass with CCC ( XCCC 0.00%↑ ) spreads. Something similar happened after the 2018 taper tantrum concluded, high-yield spreads were moving in compass with high-beta sectors ( SPHB 0.00%↑ ). Those who have risk appetite should be looking into it; for those who don't have risk appetite, high-grade corporate bonds remain a bull niche.
For those who ask, Is this like the 2013 or 2018 taper tantrum? The answer is no; this time is different. Quantitative Tightening (QT) still continues while markets have and use a Quantitative Easing (QE)-like program called the BTFP, which is similar to the credit window Ben Bernanke applied when he was chairman; therefore, this time is different.
When it comes to politics, expectations remain the same, seasonality supports further upside for markets, and the market-priced dovish rate path may also enhance upside to markets, but markets should be cautious because reflation is the likely outcome in Q4-2024 / Q1-2025. It also depends on how oil ( USL 0.00%↑ ) performs, as oil drives most goods and services prices, and so inflation variation is mostly adhered to it.
Figure 7. S&P 500 Performance in Odd, Even, Mid-Term, and Presidential Elections.
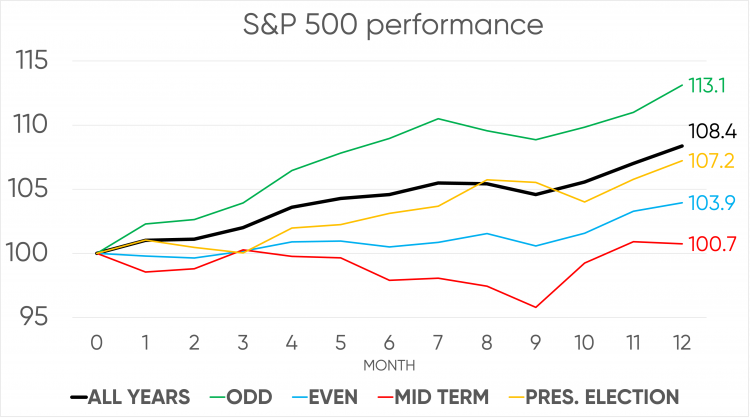
Figure 8. Will the 2023 Fed pivot trigger another run-up in inflation?
 compared to the 1974 - 1982 inflation cycle.")
Markets are now theorizing the plausible reflationary scenario previously explained in July, a reflationary scenario that mostly depends on oil performance to materialize. If the oil price is or gets pressurized, deflation should remain; if not, reflation should be expected.
Here is the link to it if you want to read the thesis over the plausible reflationary scenario that markets are now theorizing:

An arbitrary hedge to hedge that thesis through oil at current levels is oil 75 strike straddles; given the overheated stochastics in oil, oil may cool down to normal/cool stochastic levels. If oil cools down to normal/cool stochastic levels, there may also be an arbitrage hedge to the upside. For those who like technical analysis, in the next chart it is highlighted the correlation between stochastics and forward price action.
Figure 9. Overheated Stochastics On Oil May Likely Lead To Cooldown In Oil Price.
 (Tokyo time)")
Given the fact that recently oil volatility has gone up along with oil price, it may indicate that oil bears are positioning bearishly through volatility while short covering, although market statistics show bullish positioning by markets on oil. For those who don't want to arbitrarily hedge but want to hedge it, there are some papers and indexes that were recommended before.
Europe:
The Euro-Zone is performing within the range of expectations, recent comments by European Central Bank members suggested that monetary policy may remain at current levels, but, like in US markets, EU markets are pricing a far more dovish rate stance than what the Governing Council Members of the European Central Bank have indicated.
Ms. Lagarde comments remain quite hawkish but nimble, according to her there was no discussion of rate cuts by Governing Council Members of the European Central Bank during the December 2023 meeting. Although every week that passes, there are more European Central Bank members that indicate plausible rate cuts next year. Markets keep betting on the soft-landing outcome as inflation approaches the European Central Bank's price stability goal.
When it comes to geopolitics and politics, expectations remain the same. Escalation expectations if Ukraine's admission to the European Union or NATO is accepted remain the same; the Ukraine war situation appears to still be concentrated in the same regions, with no major gains by either side, although the Israel-Hamas war appears to have more movements than the Russo-Ukrainian war.
Figure 10. Russo-Ukrainian War Situation Map.
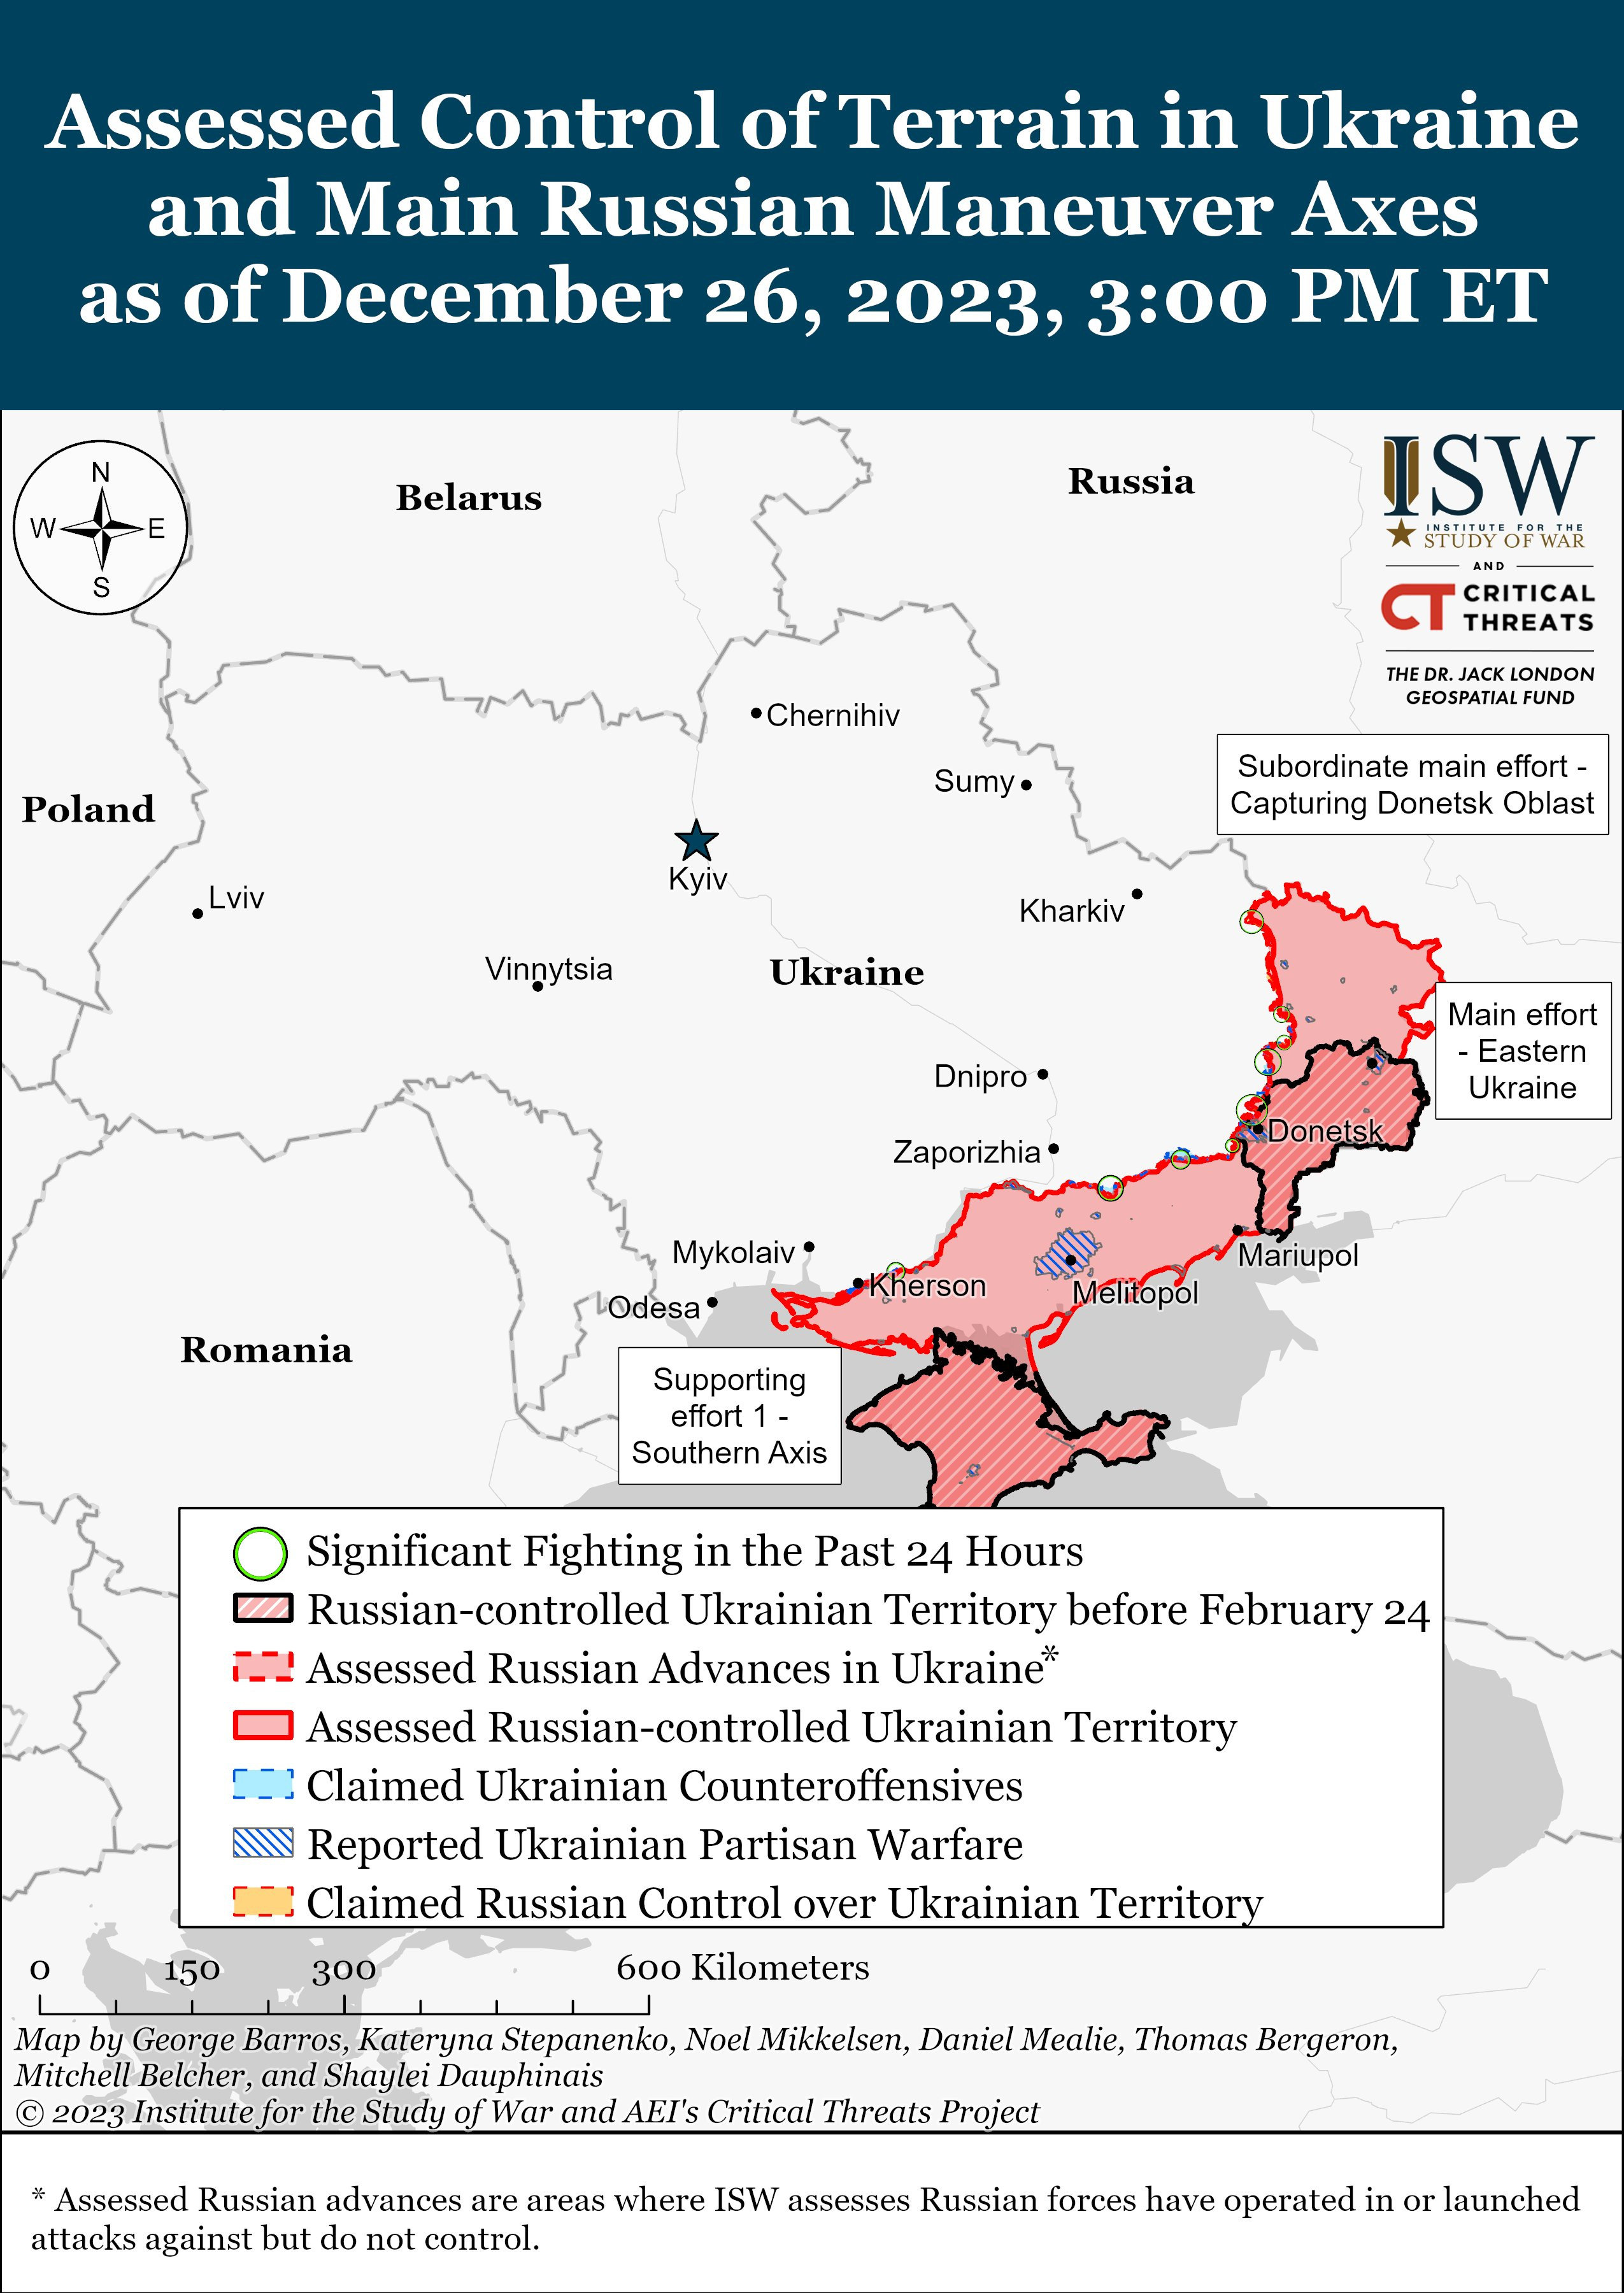
Figure 11. Israel-Hamas War Situation Map.

To conclude, geopolitical-driven risks are major catalysts for 2024 in the Euro-Zone, the intervention of NATO in current proxy wars may destabilize European countries government budgets, which may lead to instability in the region. Recent measures by the European Union lowered those worries, but those worries are something to keep in mind.
United Kingdom:
The United Kingdom's economy is performing as expected, Prime Minister Rishi Sunak's government's fiscal and legislative policy measures keep ensuring a stable United Kingdom. The Bank of England's monetary policy measures have ensured that the United Kingdom safely returns to the Bank of England's price stability goal, although inflation is not quite there yet.
Like the European Central Bank, the Bank of England remains reluctant to rate cut discussions, although there have been some dovish comments by some Monetary Policy Committee members of the Bank of England. Andrew Bailey remains hawkish, similar to Ms. Lagarde's stance, although markets keep pricing rate cuts into next year.
To conclude, geopolitical and political expectations remain the same, recent measures by Chancellor Jeremy Hunt may increase economic activity in the United Kingdom, these measures were allowed by the market-priced forward monetary policy rate path; further measures should be expected if the Bank of England follows what markets are pricing.
Asia:
China:
The world's second-largest economy is performing better than what markets expected, and government fiscal and legislative policy measures are ensuring stability in China. The Chinese government led by 习近平 is ensuring that the Chinese economy doesn't enter into a recession, which may be the likely scenario unless the Chinese government enhances its measures.
Geopolitics remains something in focus into 2024; as explained before, new members added to the BRICS Alliance will more than likely increase geopolitical tensions. It's still surprising that China has not yet liberated Taiwan from separatists, as it is theirs.
China may be waiting either for unknown logistic projects to finish or China may be waiting for military projects to finish. The increasing volume of China's PLA vessel production has been something notable. 习近平 may be ramping up production in preparation of the plausible use of military power as the United States arms Taiwan instead of trying to peacefully reunify Taiwan with China, a unification/liberation that 习近平 warned that it will happen.
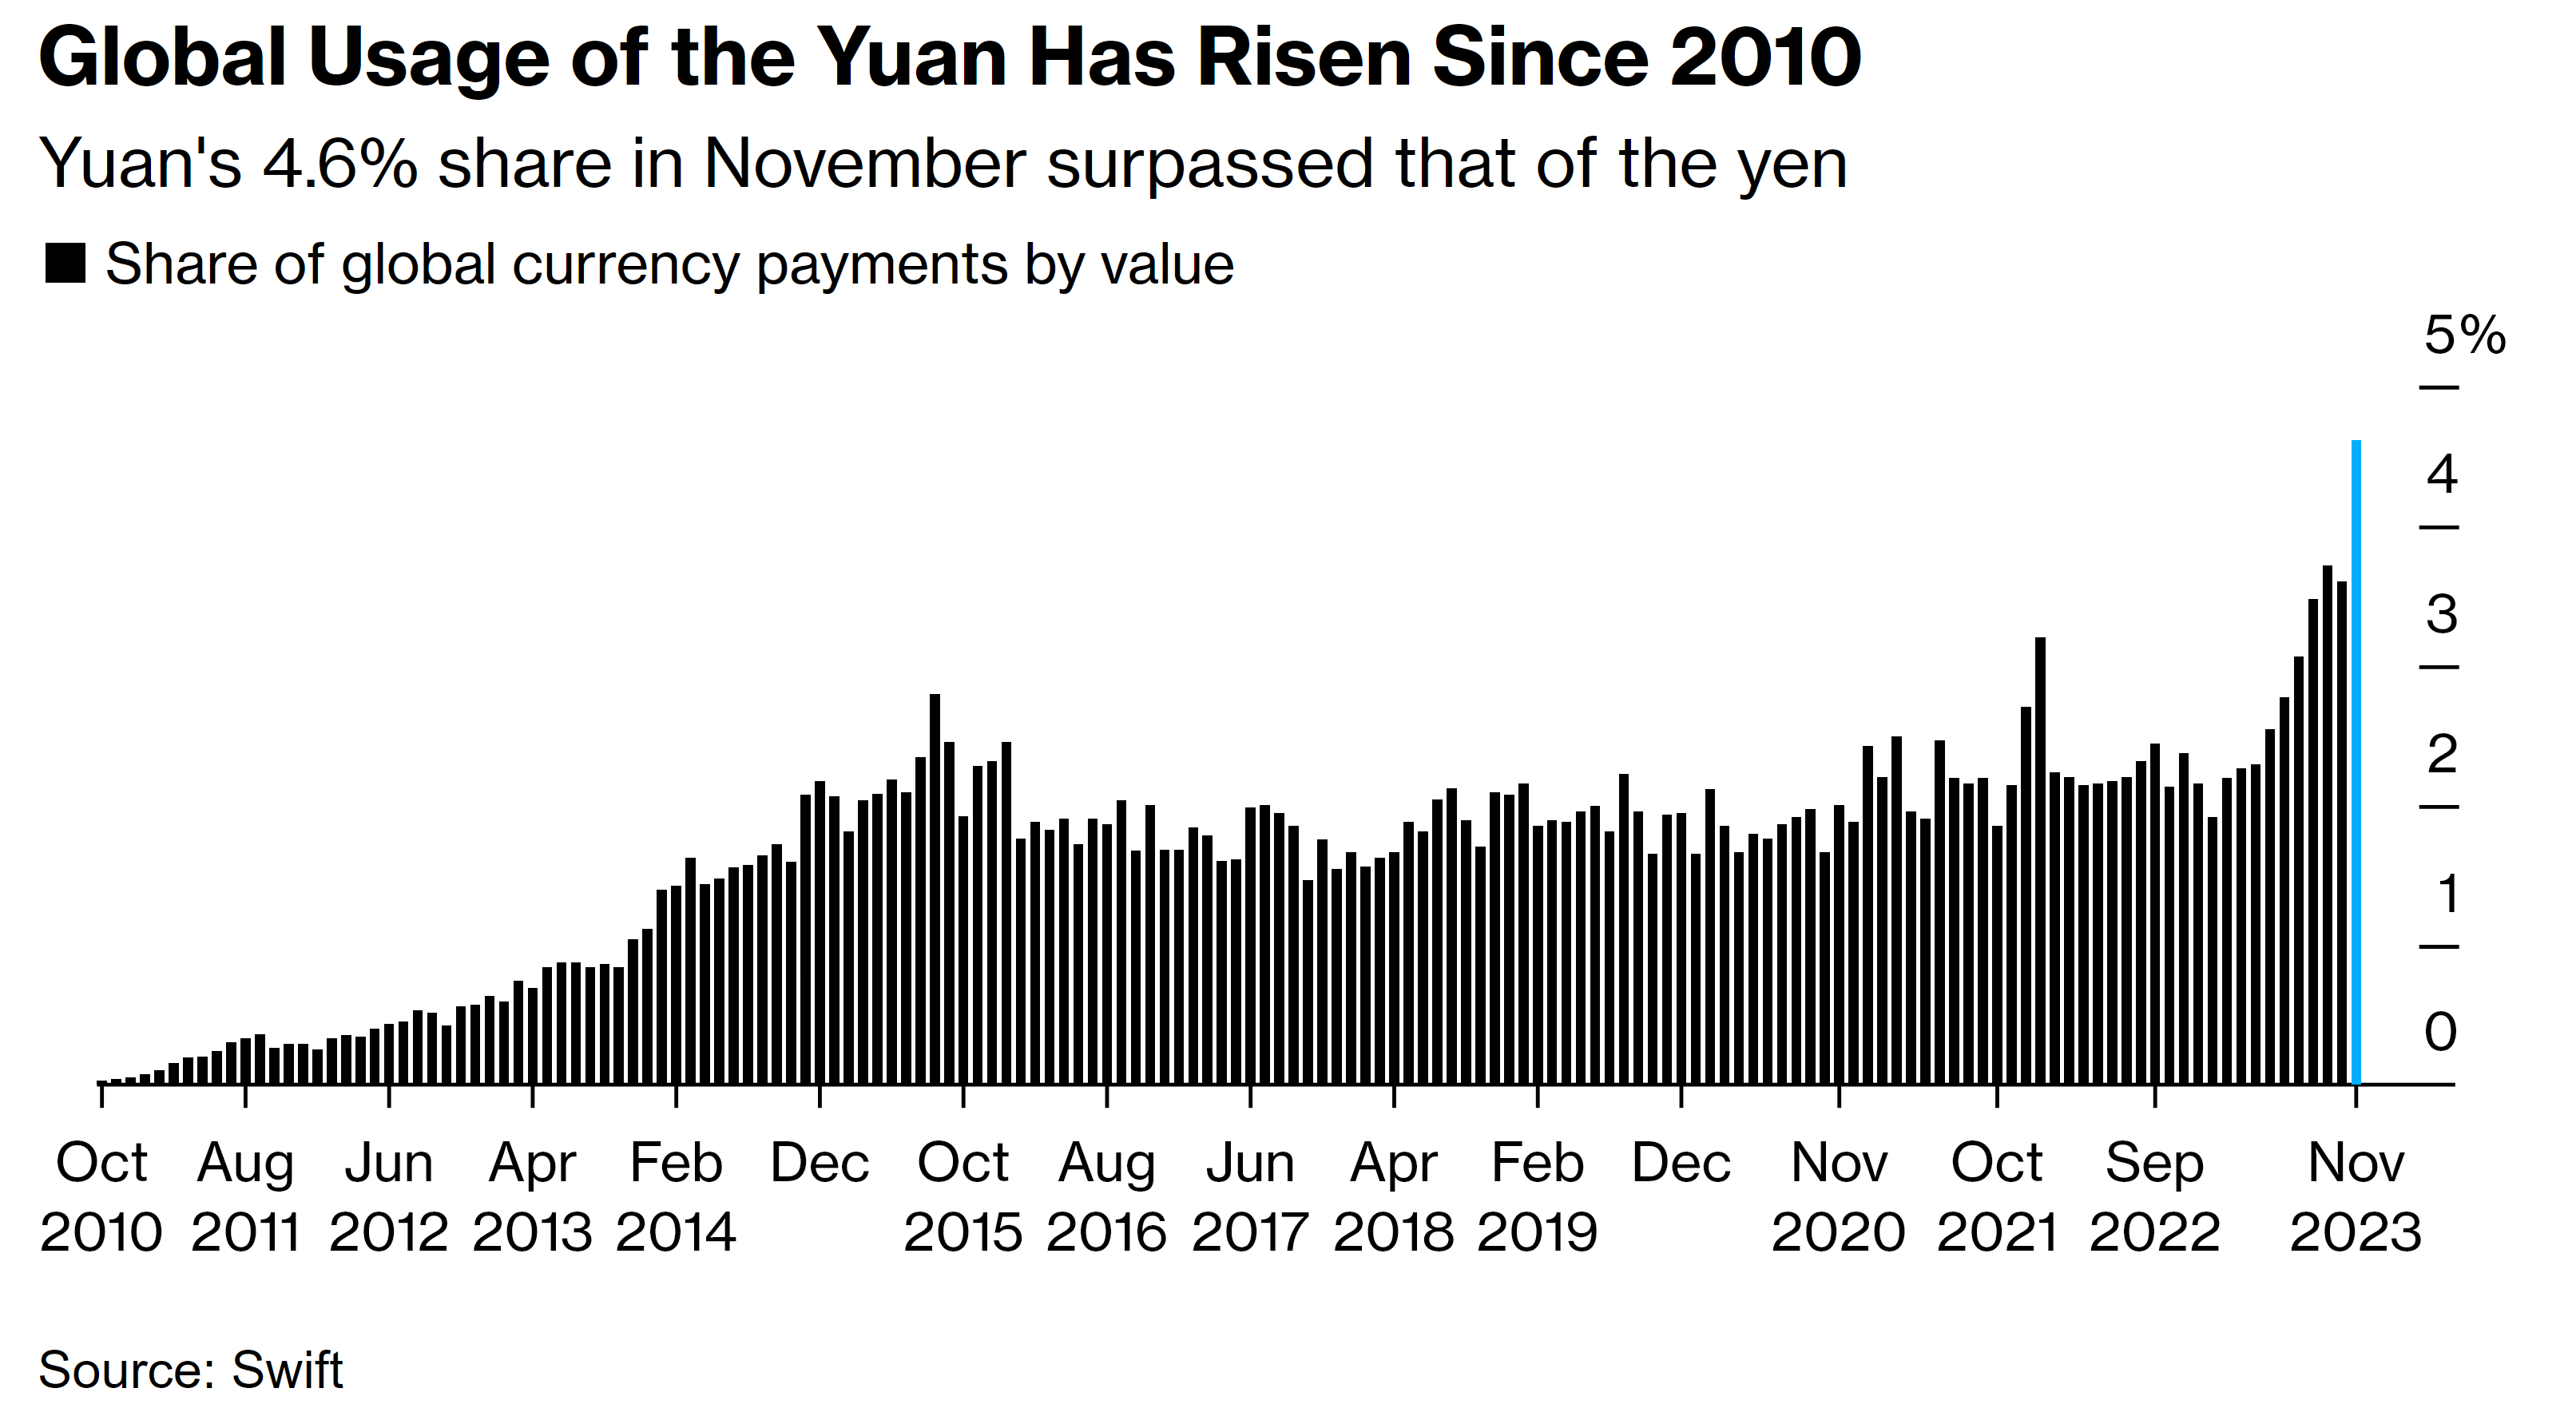
To conclude, the People's Bank of China, led by governor 潘功胜, keeps defending the Chinese currency, an interesting statistic that worth mentioning is that the Chinese Yuan has reached 4.6% global usage, surpassing the Japanese Yen.
Figure 12. The Global Usage Of The Yuan Surpasses The Yen.
The People's Bank of China's open market measures are ensuring stability in the Chinese markets and stability in the Chinese economy, but the Chinese government deficit remains a concerning statistic, although expectations are optimistic.
Japan:
Japan may be facing a recession, but the Japanese government is making sure it doesn't happen. The doom loop of government-fueled gross domestic product growth may be facing a wall with the Bank of Japan. Quite literally the same kind of scenario that Kuroda faced without high consumer prices, speculators frontloaded rate hikes that have not materialized; this was expected. And markets reacted as expected, markets are quite bullish on the Japanese Yen, the Japanese Yen valuation enhancement has been a major catalyst for the rally reflected in the next two charts.
Figure 13. Deutsche Bank Japan Gross Equity Futures Index.
( Left X-axis: Index data. | Right X-axis: Volatility of the index. )
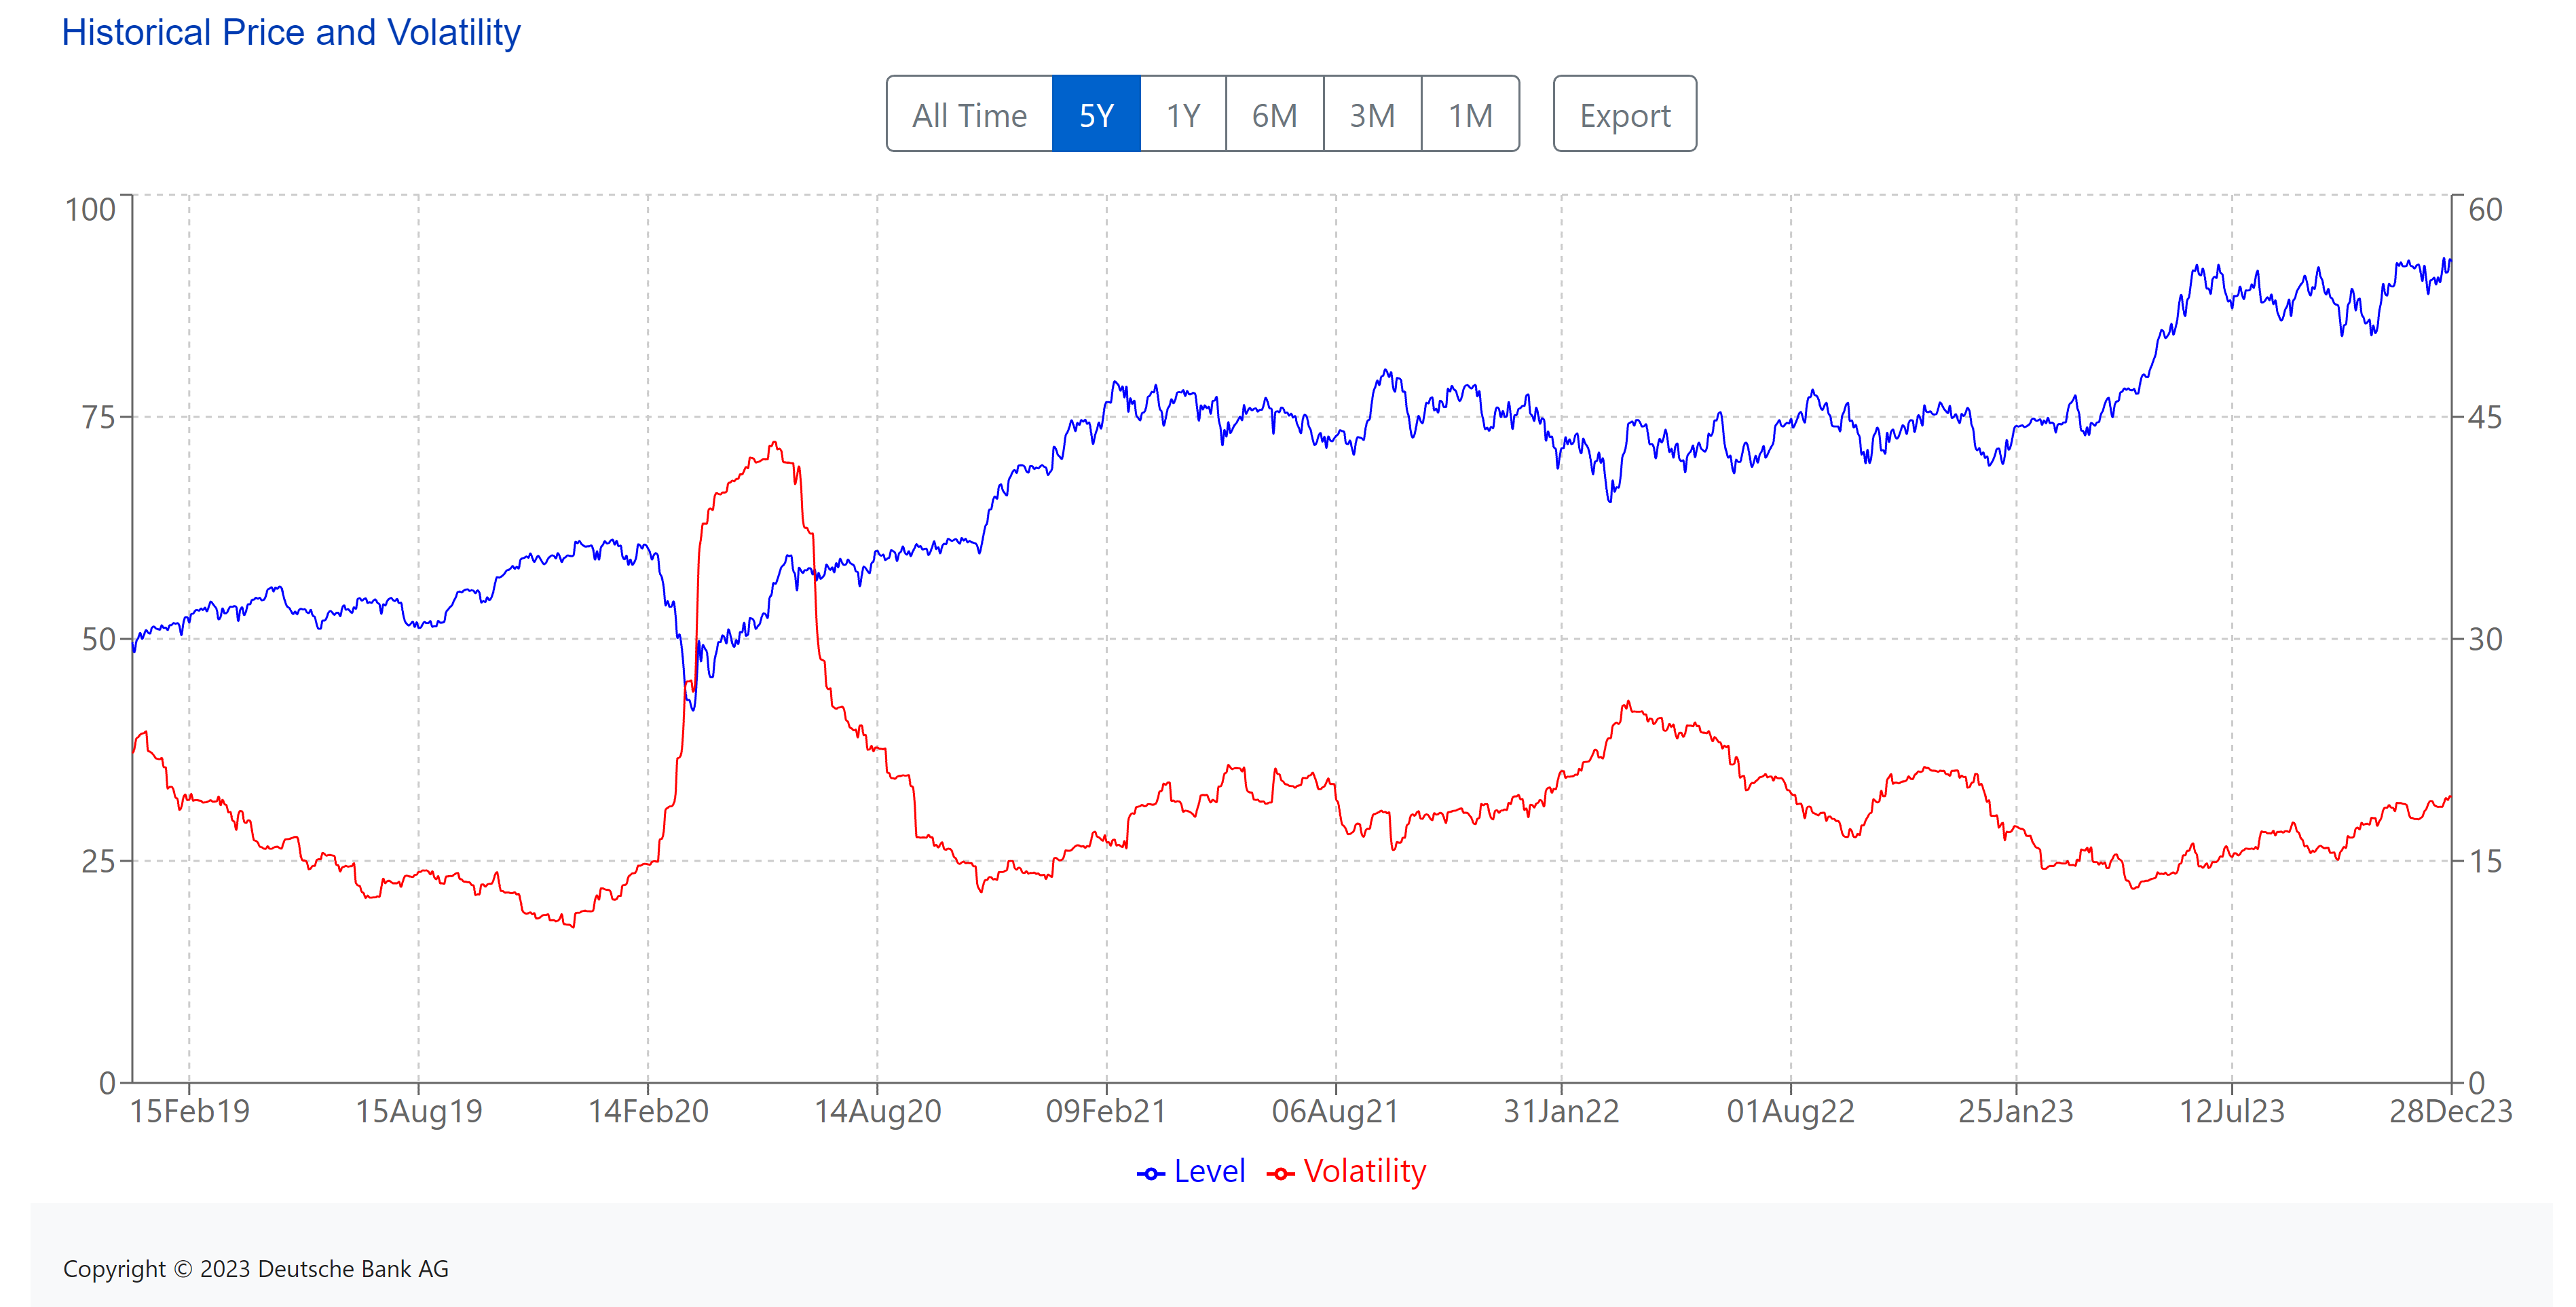
Figure 14. Deutsche Bank Japan Gross Equity Futures CTA Index.
( Left X-axis: Index data. | Right X-axis: Volatility of the index. )
Bank of Japan's Ueda may have to enhance open market measures in order to stabilize the Japanese economy and markets, although recent data showed improvements not adhered to central bank operations. Bank of Japan doves and hawks remain nearly the same, as nothing much has changed.
Figure 15. Bank of Japan Monetary Policy Doves & Hawks.
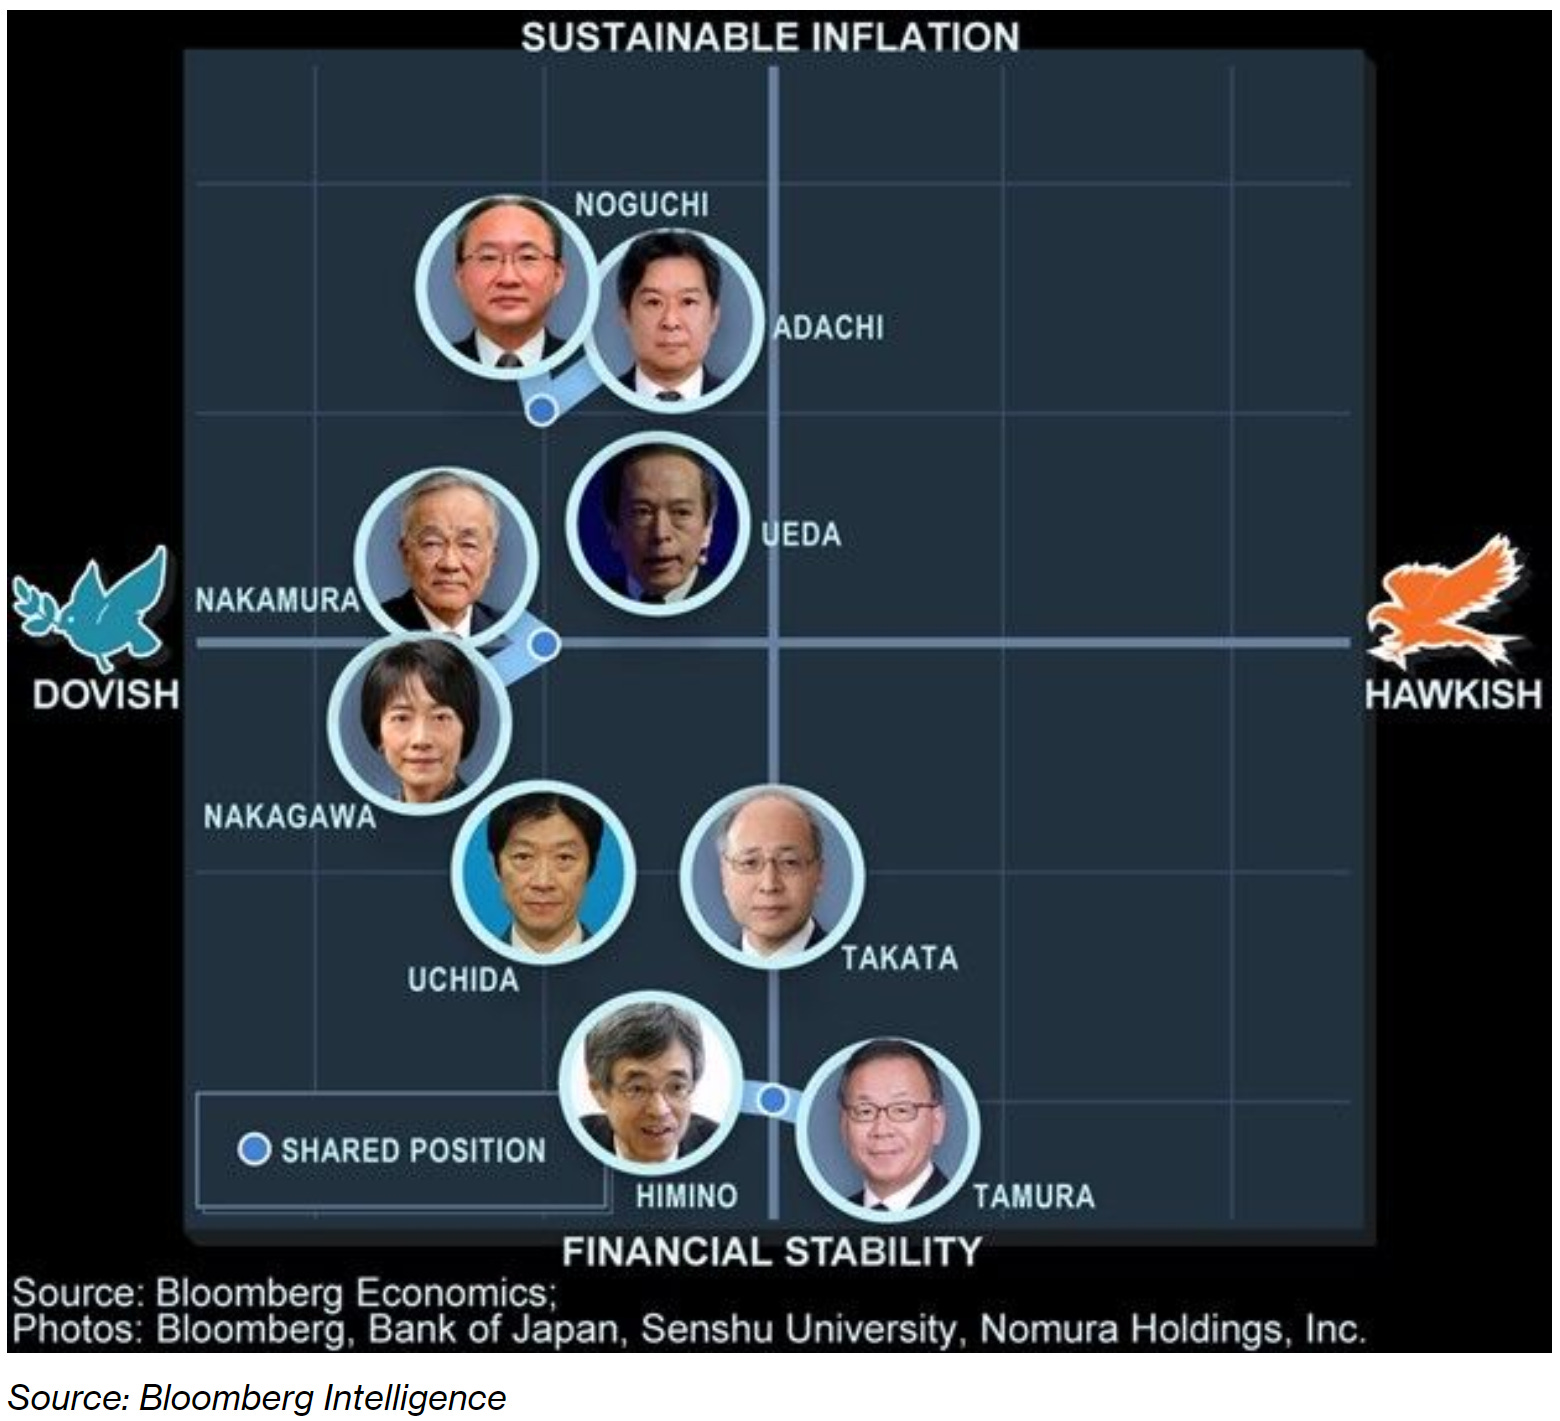
For those who ask: will the Bank of Japan hike rates? The logical answer is no, given the fact that it could cause a recession. Although prepared for either scenario, as some members of the Bank of Japan have indicated a change in the monetary policy path.
I hope you folks had a good Christmas eve and a good Christmas day. I wish you all a happy new year. 🥂
Do feel free, as it’s free, to share, leave a comment, and subscribe to Quantuan Research Substack if you want, by using the next buttons.
It's not about the money (the research is free); it's about sending a message (delivering alpha to the reader).
Note: If the text in the post is grey (example) it is because the source of data is linked; everything is linked in the text, so it’s not messy to add everything at the end like in some tweets.