The Calm Before The Storm
Analysis of macroeconomic data, political data, geopolitical data, and monetary policy with commentary on it, basically analysis of the current scenario with forward data expectations.

United States:
The United States is performing within the range of expectations; recent statistics indicate that the reflation vectored by supply chain disruptions explained in February of this year is materializing, as reflected in the latest Core PCE inflation statistics. A thing worth mentioning is that an FRB framework shows supply-driven inflation levels not seen in a while, with the Supercore Consumer Price Index showing reflation levels not seen since early 2023. Although inflation remains within the range of FOMC officials’ projections.
Figure 1. Core Inflation’s Reflation Is Vectored By Services Prices.

Figure 2. Supercore Consumer Price Index At Levels Not Seen Since Early 2023.

Figure 3. Distribution Of FOMC Officials’ Projections For PCE Inflation (2024).
.")
These statistics suggest that monetary policy should remain on the current hawkish-nimble path; the last FOMC Minutes signaled that monetary policy may shift the current Quantitative Tightening pace; FOMC officials stated that they “generally favored” slowing the pace of Quantitative Tightening, although the United States’ TSY market continued to trend hawkish, markets are hawkishly positioned in the SOFR market and have repriced the rate path with just one rate cut this year and two for next year; although the market-priced rate path remains in the range of the last-released FOMC dot plot.
Figure 4. FOMC Officials “generally favored“ Slowing The Quantitative Tightening Pace.
")
Figure 5. Markets Are Hawkish But In the Range Of FOMC Officials’ Dot Plot.
.")
Figure 6. Markets Year-End Positioning In The SOFR Market Is Hawkish.

Figure 7. The Market-Priced Rate Path Shows Just One Rate Cut For This Year & Two Rate Cuts Next Year.

Markets remain focused on the job market statistical data releases, as the employment market slowed from its strong pace early in the year, although the most recent data showed job market resilience. FOMC officials continue to state that they need more statistical data in order to shift dovish; they, in their majority remain hawkish.
Figure 8. FOMC Bowman & FOMC Logan Are The Most Hawkish, The Rest Are Centrist & Just One Dove.

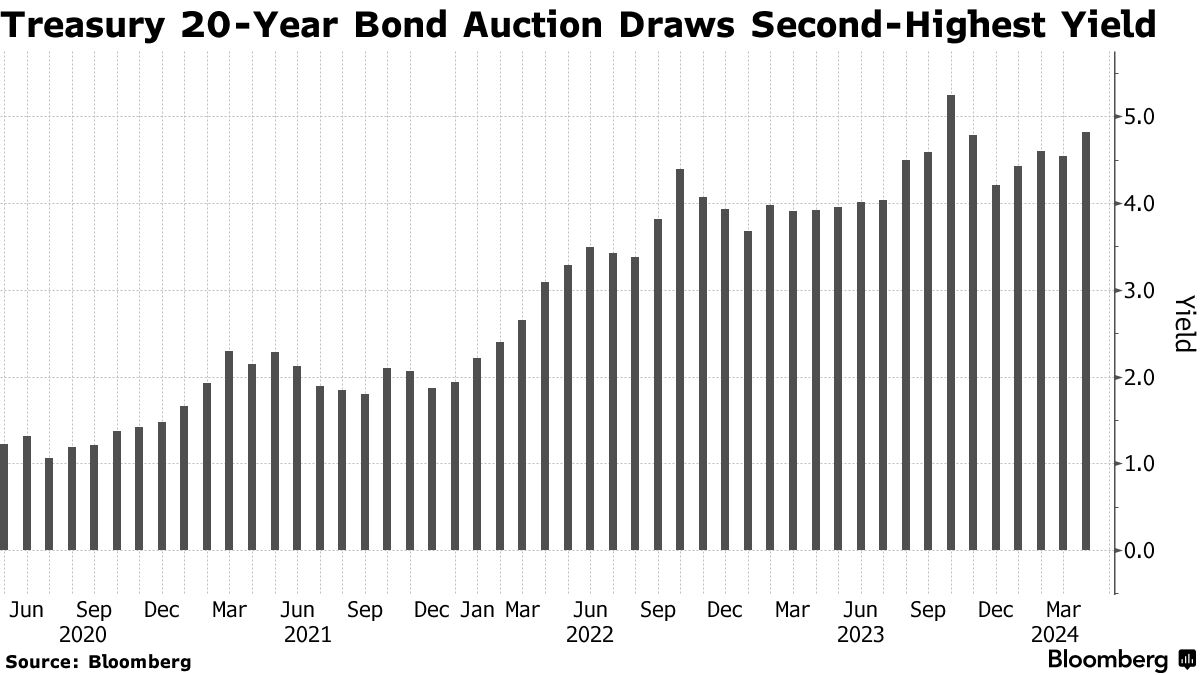
Given the fact that reflation has been and continues to be in place, the higher for longer monetary policy stance predominates; given the resilience of the job market, it is coherent; FOMC officials are focused on the price stability mandate of the dual mandate, with some indicating rate increases; government bond yields spiked to their highest level of the year, which Powell endorsed; global factors such as China selling has pushed the United States’ Government 20Y Treasury Bond auction yield to the highest level since November 2023, increased and increasing government deficit with big government bond issuance is also a vector of the government bond yields surge.
Figure 9. Government’s 20Y Treasury Bond Yield At The Highest Level Since November 2023.
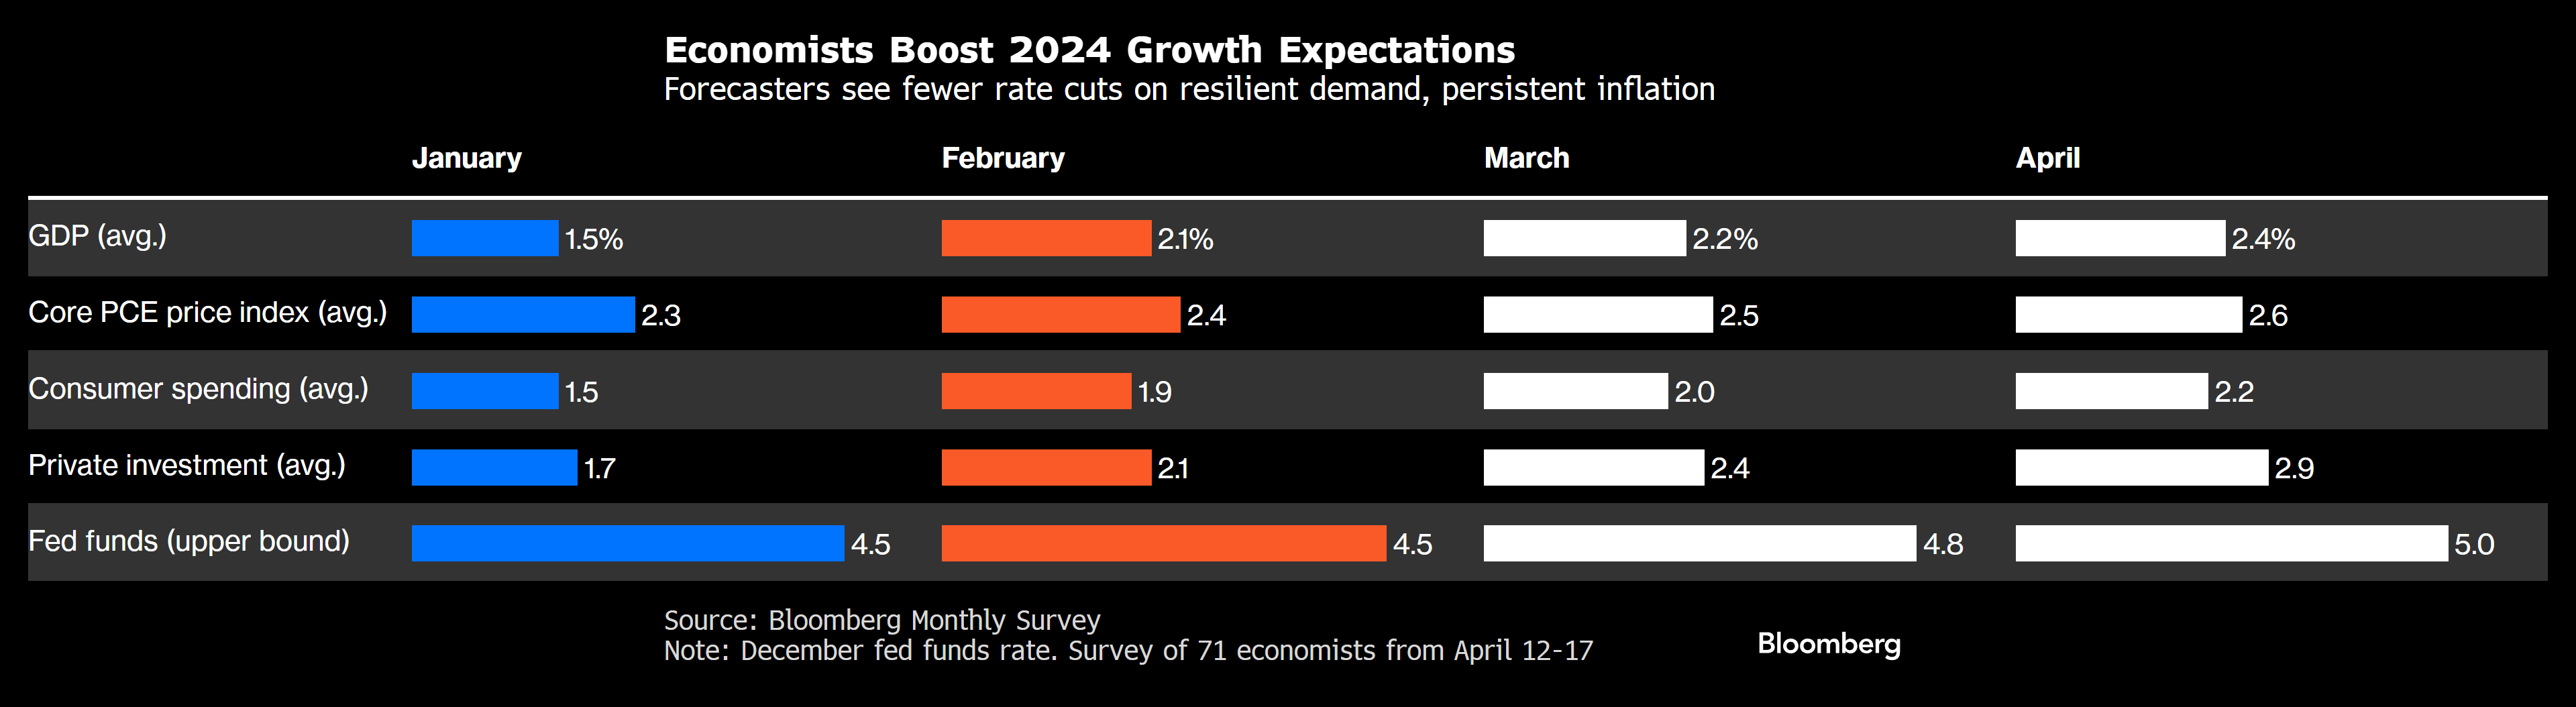
The International Monetary Fund (IMF) has recently criticized the government’s deficit, which the United States’ Government Department of the Treasury’s Secretary Janet Yellen has downplayed. Nonetheless, economists and the International Monetary Fund (IMF) have raised the Gross Domestic Product (GDP) forecasts.
Figure 10. Economists Ignore The Government Deficit & Lift The United States’ Growth Expectations.
The previous statistics suggest that markets seem to be risk-on mode when it comes to forecasts, but risk-off when it comes to market positioning. In my opinion, it’s quite incoherent given the geopolitical scenario; as stated in a tweet, world war vectored by the Middle East can be discarded.
Figure 11. The current situation in the Middle East remains a marketable war by the industrial military complex, which can be summed up as a meme:

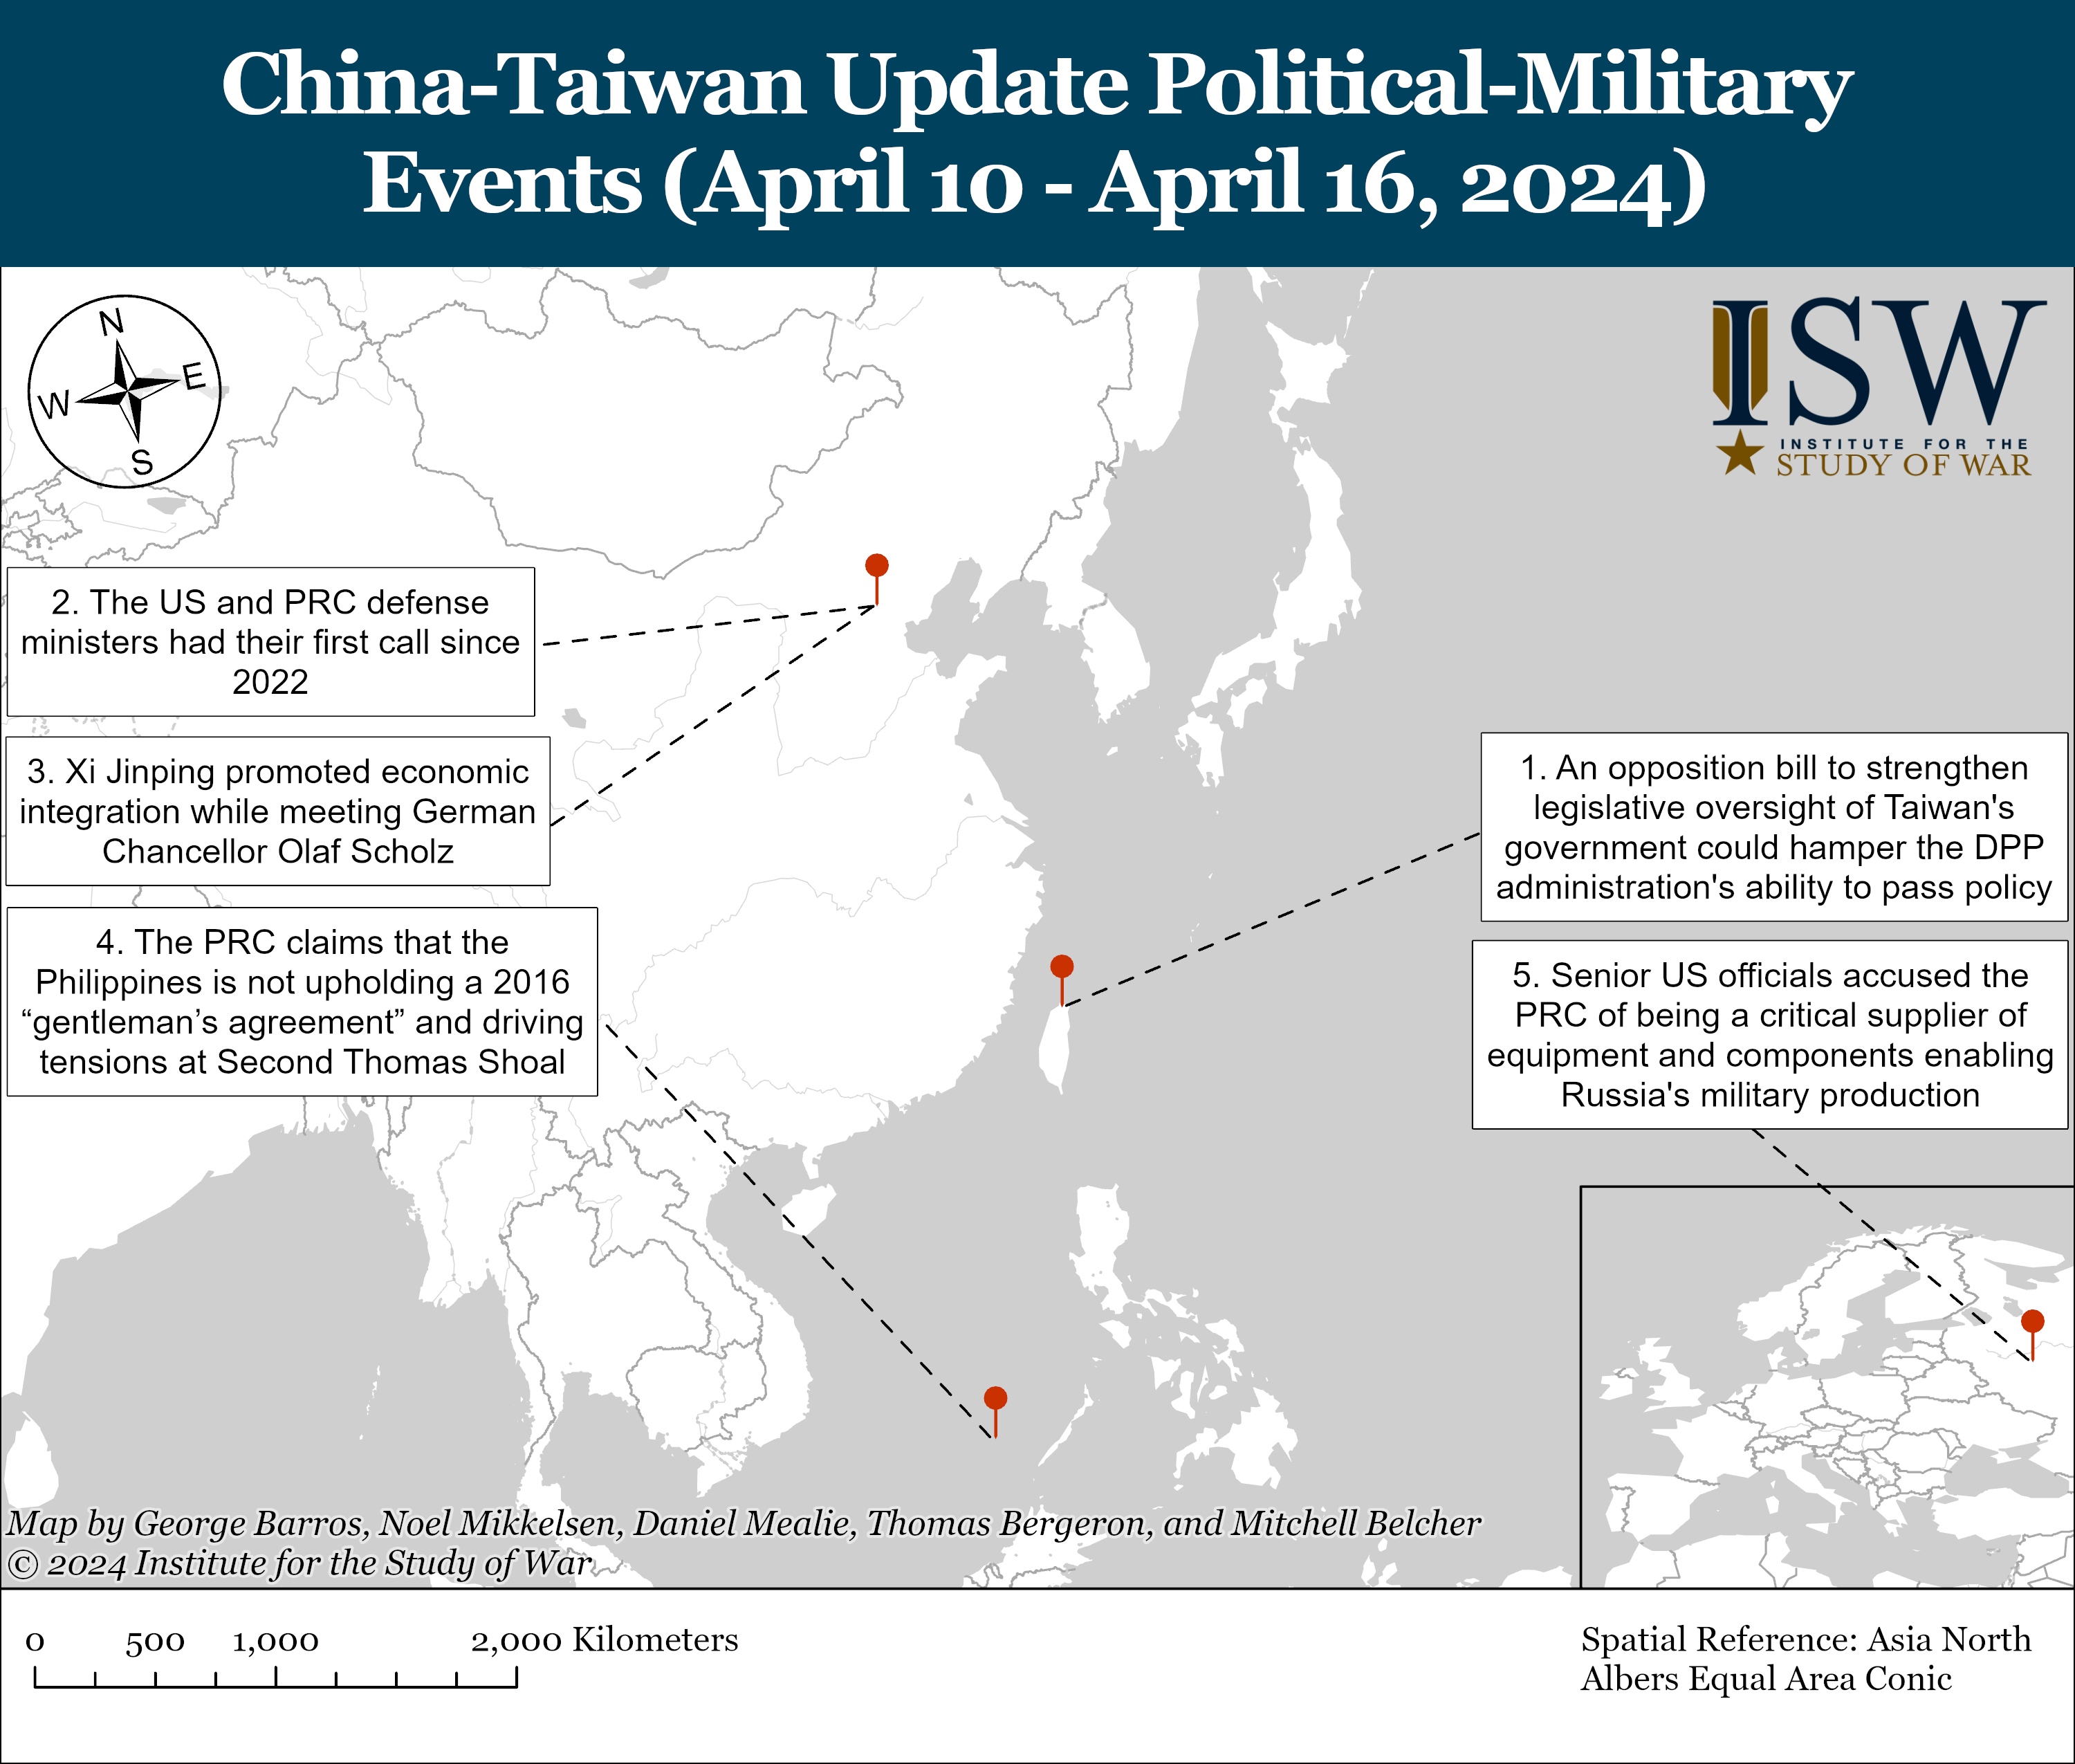
Although a world war vectored by Taiwan is inevitable, given the fact that, as mentioned before, China’s president assured that Taiwan will be unified, which the non-allies of the BRICS alliance seek to defend by supporting Taiwanese separatists. As explained in October of last year, the new members added to the BRICS alliance have already increased geopolitical tensions, as now the direct and indirect enemies of the United States are defended by major military powers such as China and Russia, which is why the United States didn’t deploy troops nor respond to recent developments in the Middle East. In my opinion, Reagan would’ve defended freedom rather than done nothing; this is the main reason why tech stocks have sold off, in particular semiconductor-related stocks, as that sector is highly sensitive to the Taiwan war; China could’ve taken advantage of the situation and moved forward over Taiwan ( which is theirs ) but didn't, which markets have been pricing-in the past few trading sessions.
Figure 12. China Didn’t Take Advantage Of The Recent Geopolitical Developments To Move Over Taiwan. China-Taiwan Political-Military Events Map:
The current question is: will the Biden Administration defend freedom in the world like the Reagan Administration did?
(…) “To be prepared for war is one of the most effectual means of preserving peace.” (…) - George Washington
The Biden Administration’s strategy to safeguarding freedom in the world is through proxy wars, such as the Ukraine proxy war; in my opinion, NATO should deploy troops in Ukraine and the Middle East rather than doing nothing and allowing innocent people to die. The Ukraine proxy war is eroding NATO countries’ capabilities; if and when the Ukraine proxy war escalates and Russia deploys into NATO territory, NATO members will have less equipment than they did years ago. NATO nations should focus on restocking military inventory in order to prepare for plausible escalation as a result of inevitable world war vectors in Asia, reminding that just 35% of NATO members meet the alliance’s spending targets, meaning that NATO is weak and weakening by and through the proxy war’s equipment supply. Even though the Russo-Ukrainian war has been going on for years, it remains concentrated in the same regions, the Israel-Hamas war is also concentrated in the same regions.
Figure 13. Russo-Ukrainian War Map:

Figure 14. Israel-Hamas War Map:

As these regions’ warfare can’t be fully compared to other wars, macroeconomic models can determine plausible scenarios based on various wars; as explained before, oil is the main asset that is sensible to geopolitics; the geopolitical risk adhered to developments in Europe is minimal, as European countries phased out Russian natural gas with Norwegian natural gas, as mentioned before. The geopolitical risk adhered to developments in the Middle East is lower than the geopolitical risk adhered to developments in Asia, given the global Gross Domestic Product (GDP) impact difference.
Figure 15. The Israel-Hamas War Escalation Can Be Discarded, But This Is Israel-Hamas War Impact:
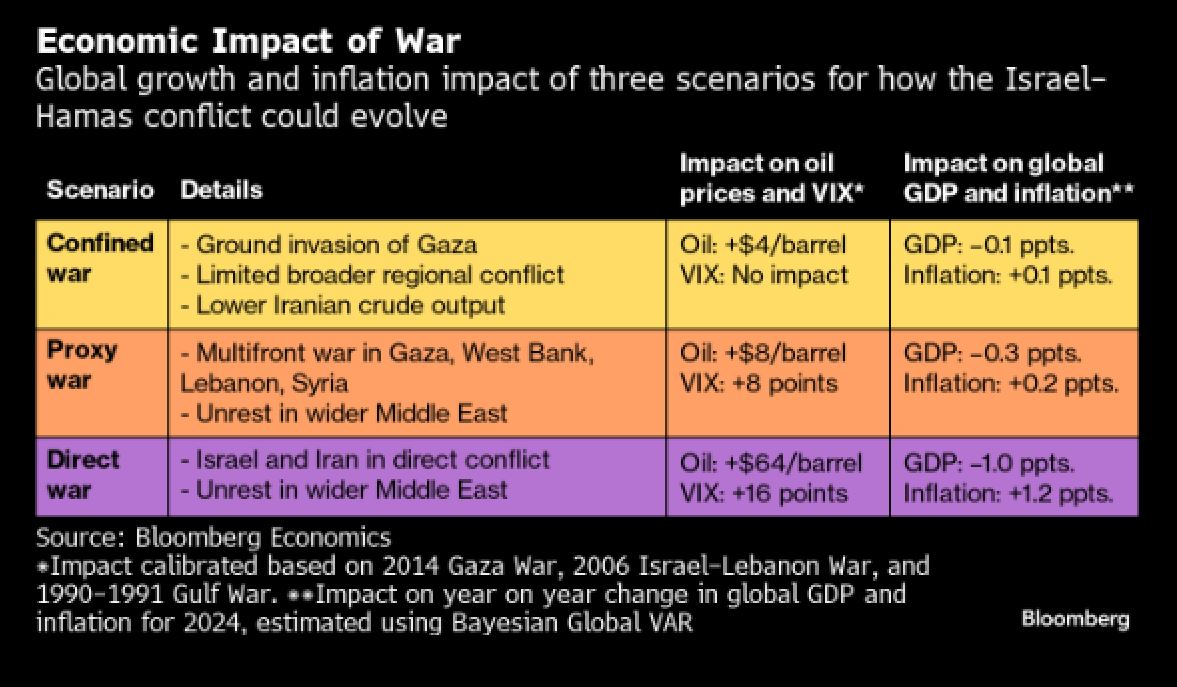
Figure 16. Taiwan War Impact:

The majority of Americans’ opinions over the warfare in the Middle East are that Israel has valid reasons for its operations in the region, and the majority of Americans’ opinion of Hamas is unfavorable, which is coherent. Despite the slightly favorable opinion of Americans over military aid to Israel, politicians have already passed a legislative policy ( §8035 ) to protect Israel from terror.
Figure 17. The Majority Of Americans Believe That Israel Has Valid Reasons For Its Operations In The Region.
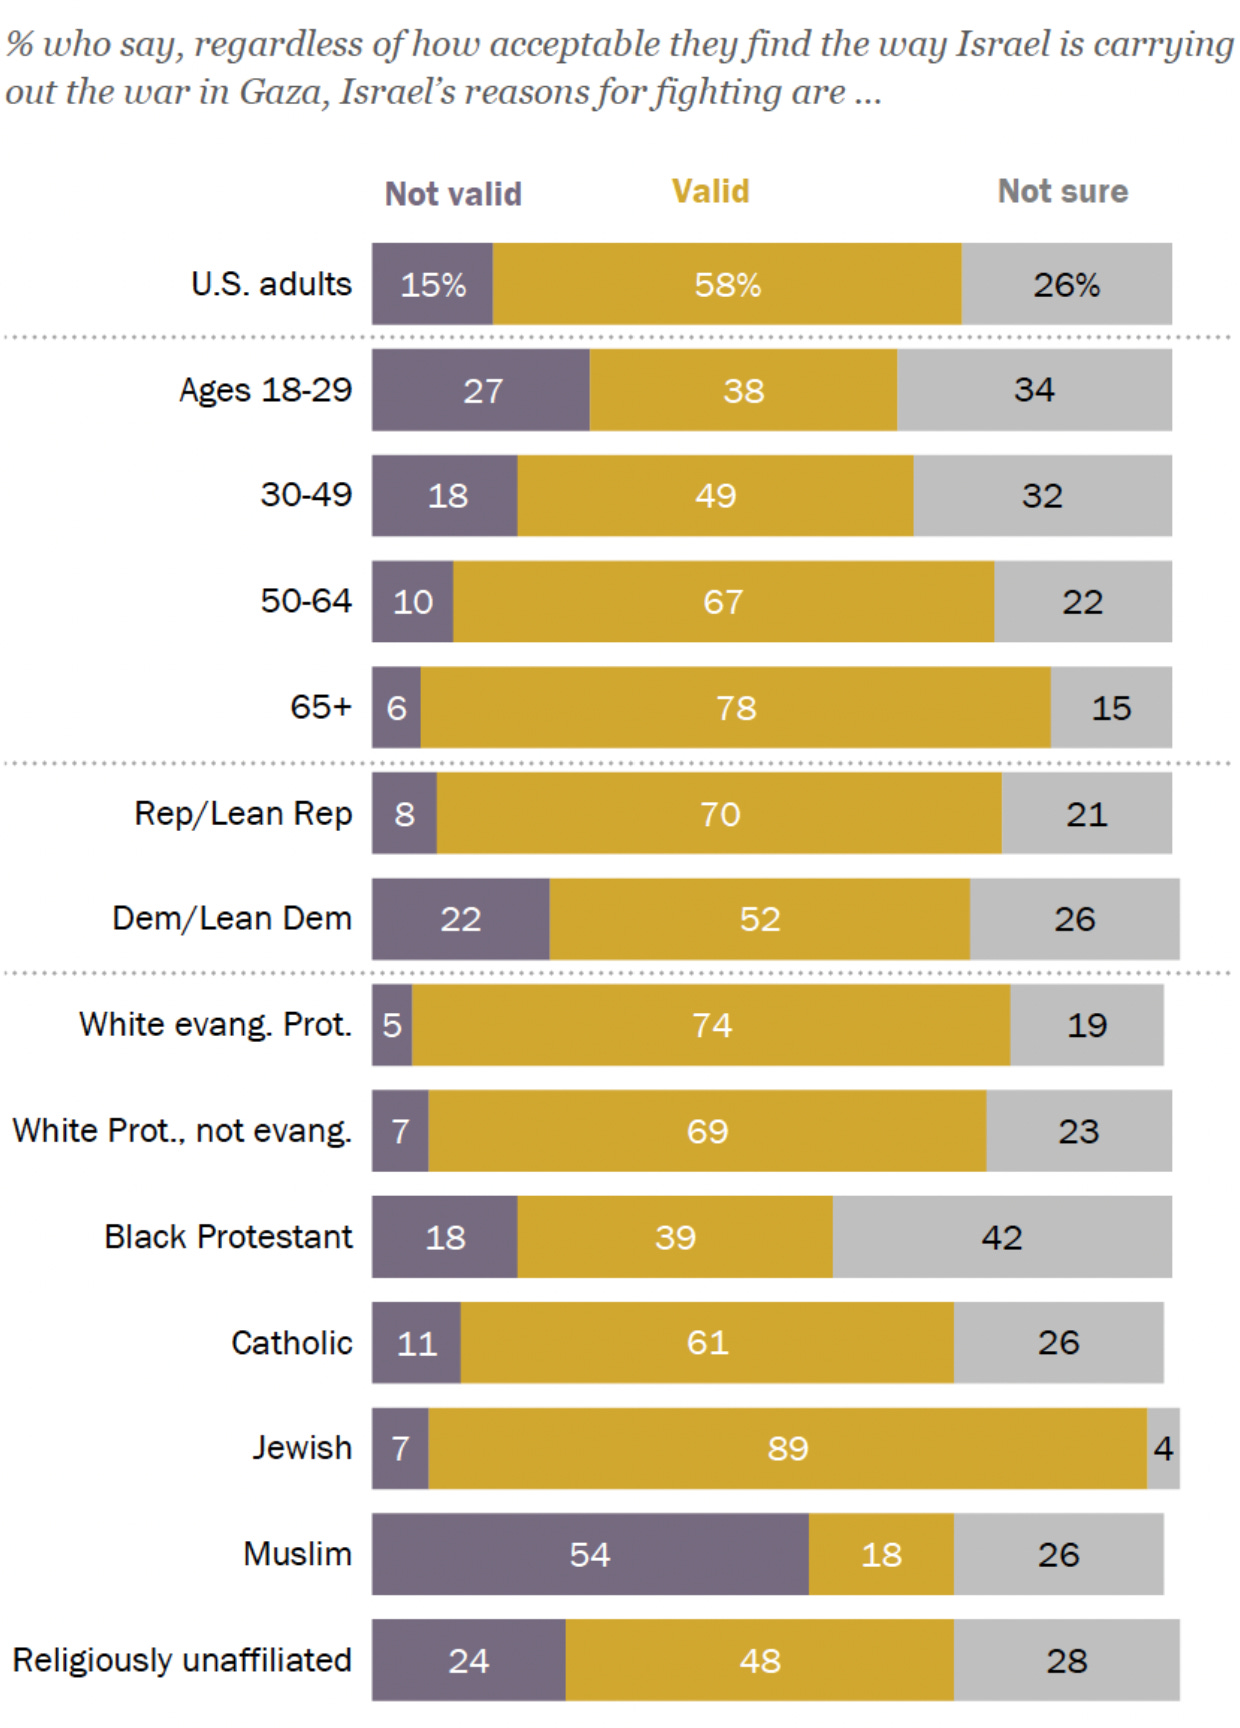
Figure 18. The Majority Of Americans Have An Unfavorable Opinion Of Hamas.
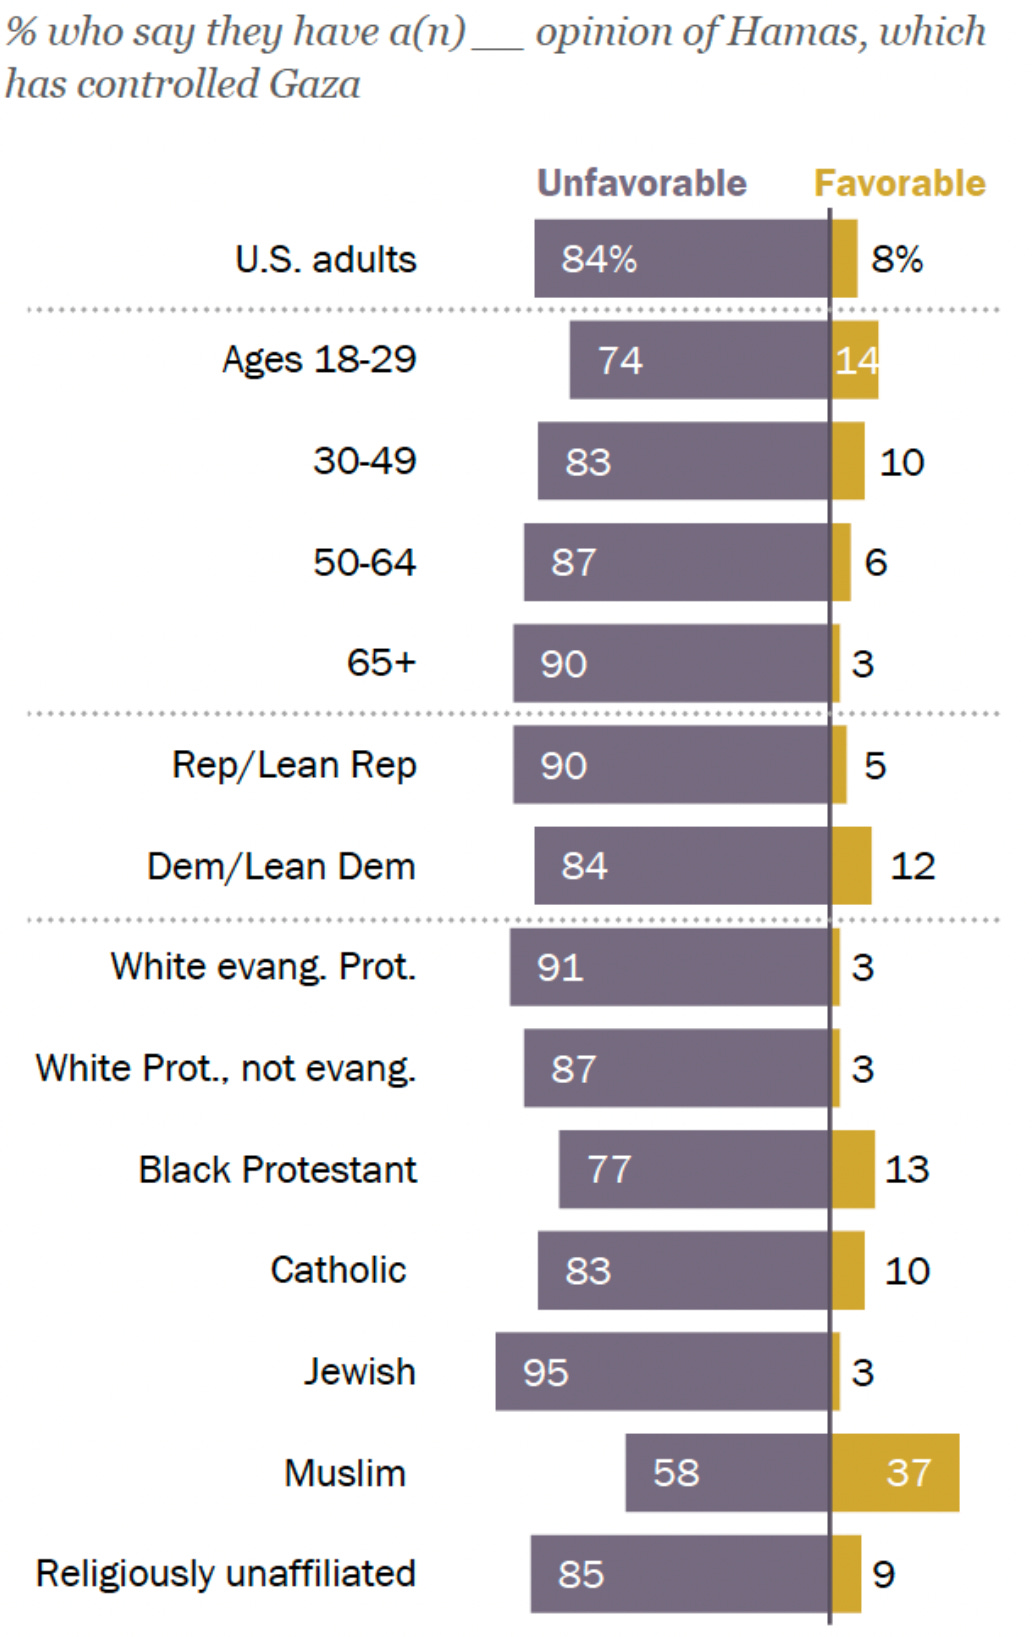
Figure 19. Americans Have A Slightly Favorable Opinion Of Providing Military Aid To Israel.
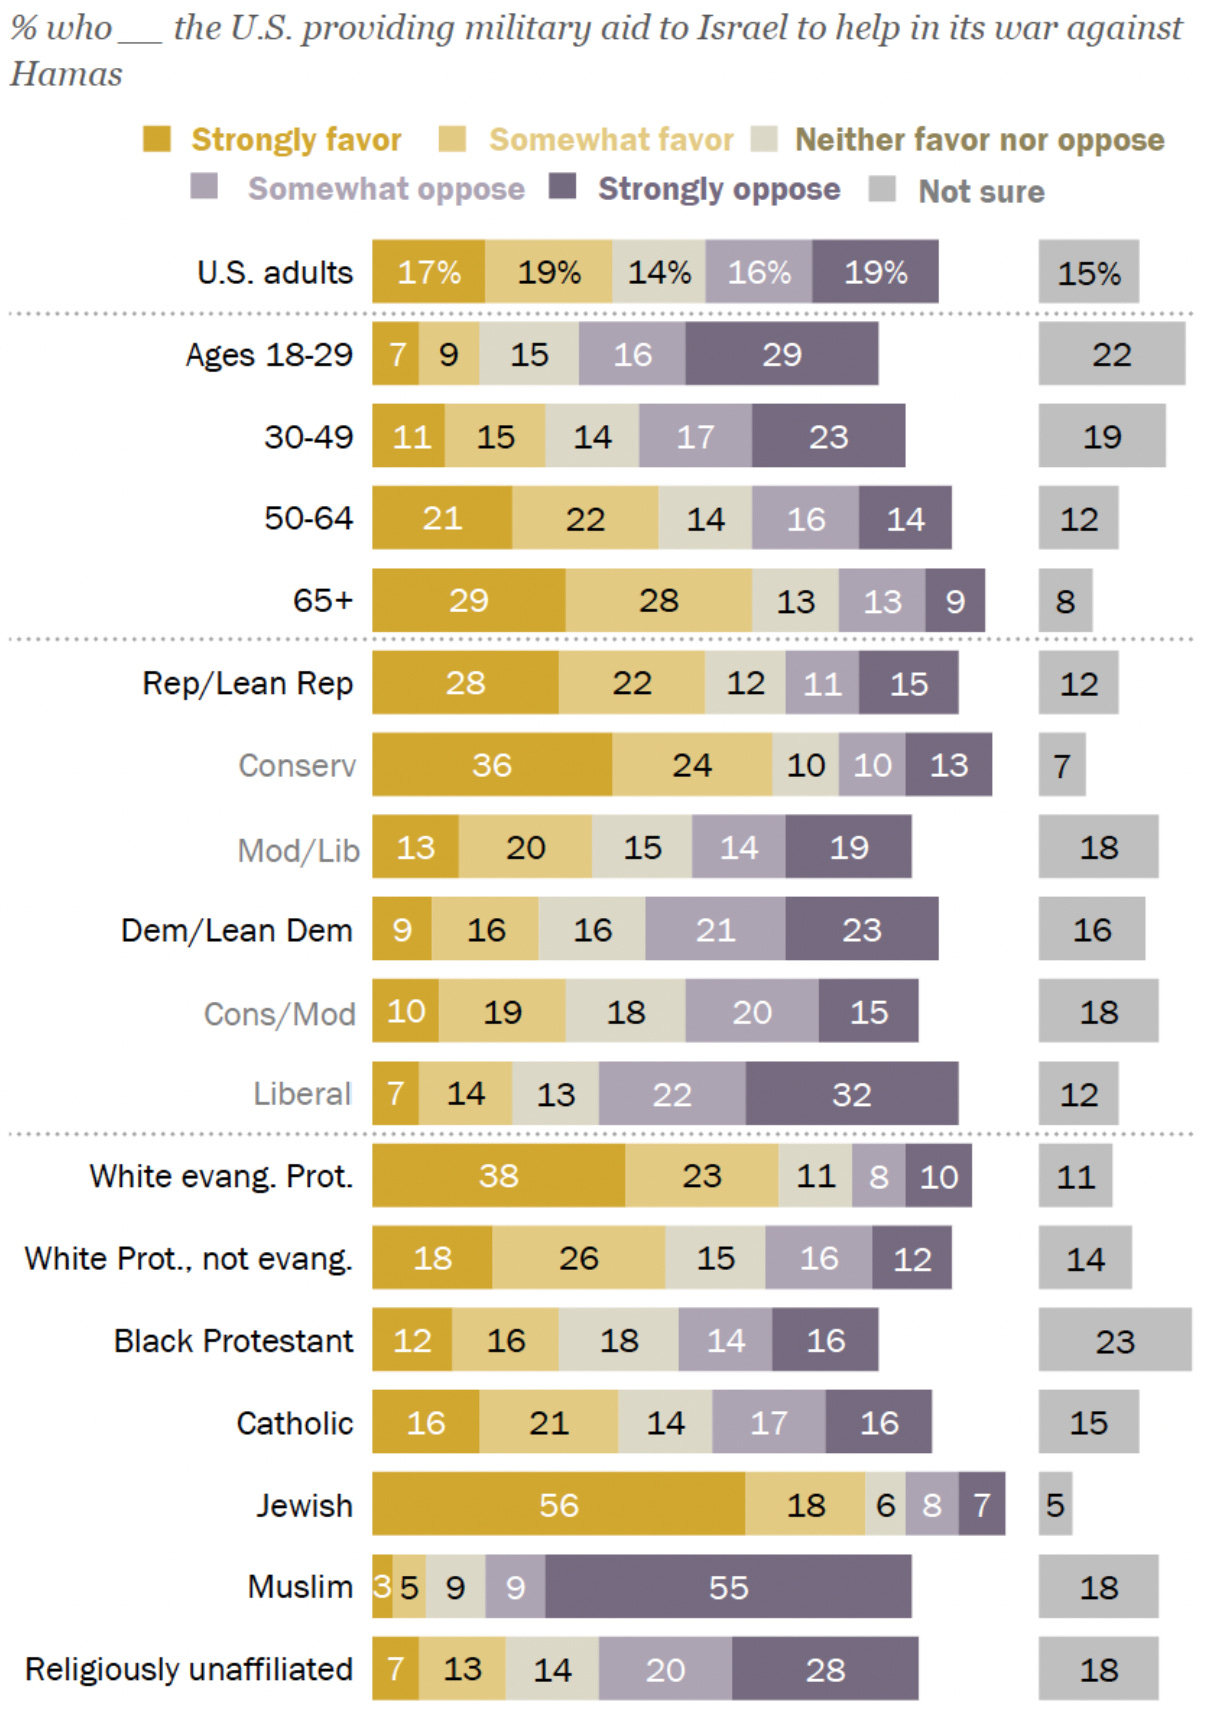
Figure 20. Politicians Celebrate Passing Legislative Policies That Ensure Support For Ukraine ( §8034 ) & Protects Israel From Terror ( §8035 ).
Source of the video: Thomas Massie
Speculators’ positioning for the forthcoming elections have leaned Democrat, previously Republican leaned, President Biden’s reelection betting odds have surpassed Trump’s odds, this is more than likely due to the fact that soft-landing is still plausible given statistics. Nonetheless, polls show that Americans disprove Biden, and historical data suggests that Biden’s popularity is currently similar to George H.W. Bush’s and Harry S. Truman’s popularity at the same POTUS.
Figure 21. Betting Odds: 2024 U.S. President. ( Upcoming Elections Odds )

Figure 22. 55.4% Of Americans Disapprove Biden, Nonetheless Reelection Odds Are At All-Time-Highs.

Figure 23. President Biden’s Approval Rating Is Similar To George H.W. Bush’s & Harry S. Truman’s At Current Term As POTUS.

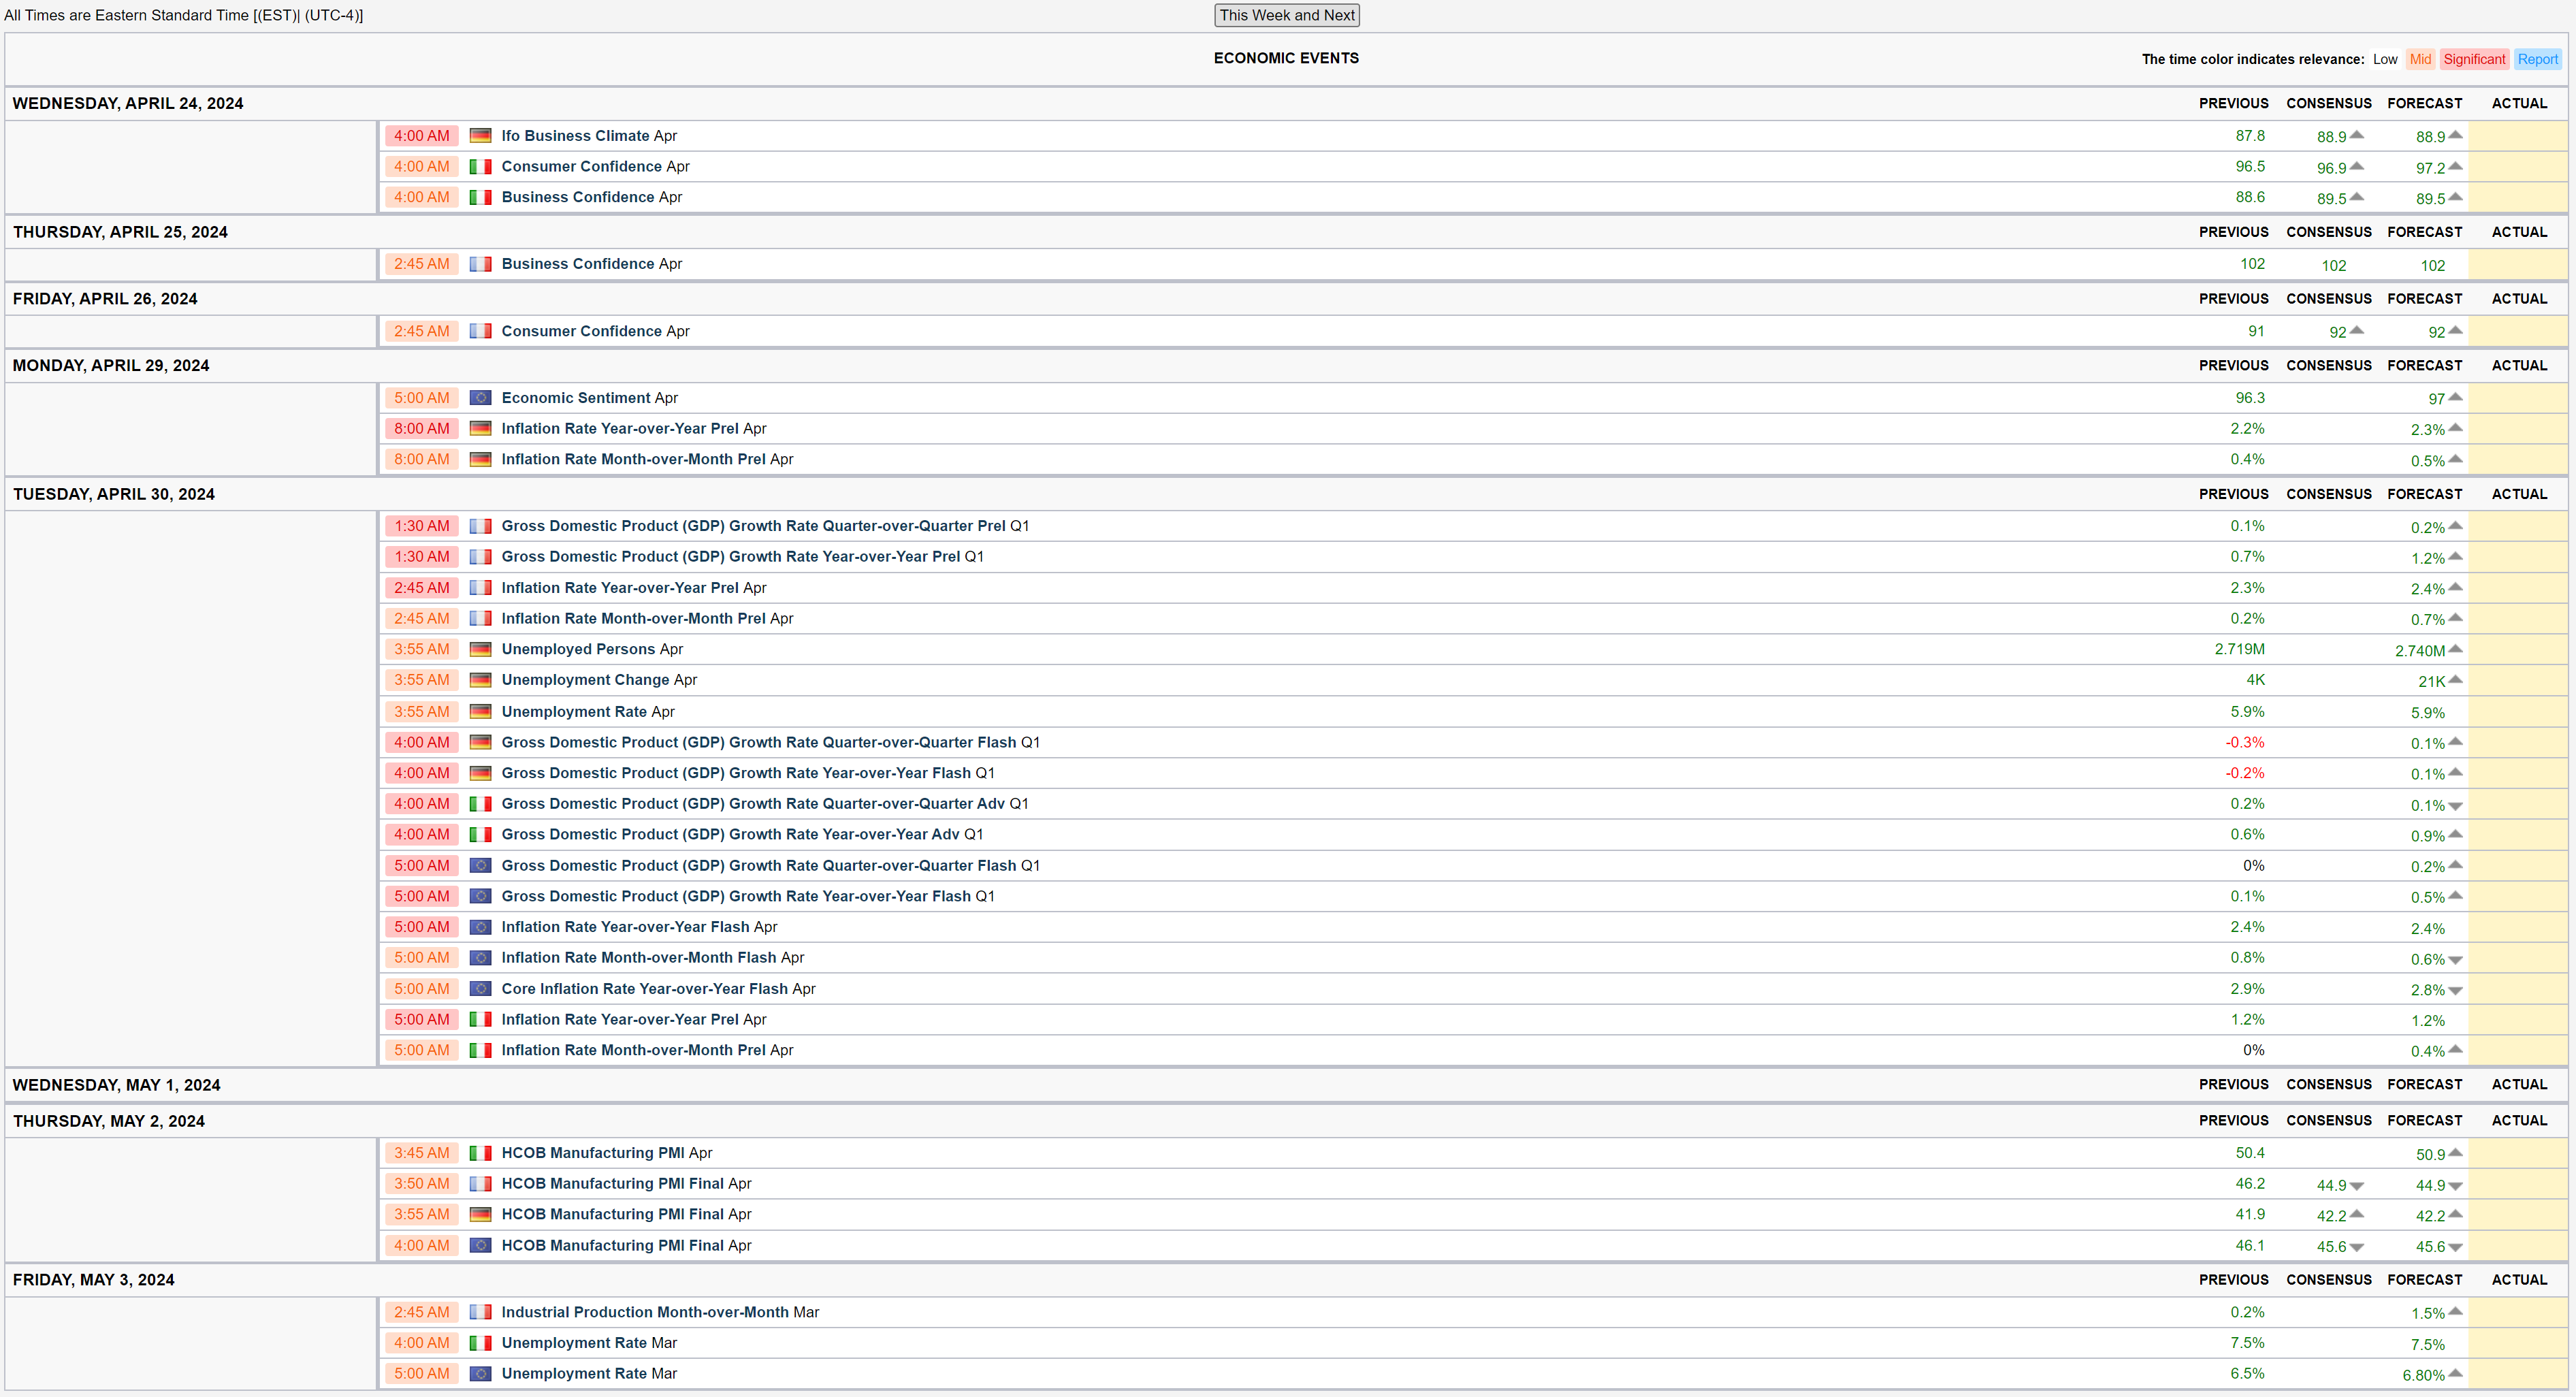
The upcoming employment and inflation data releases will likely skew the forward monetary policy stance, as monetary policy is data-dependent. If inflation data releases are more elevated than expectations, yields ( TTT ) and the dollar ( UUP ) should rise and markets ( DIA SPY QQQ IWM TLT ) should lower on a hawkish rally. If inflation data releases show deflation, yields ( TTT ) and the dollar ( UUP ) should lower, and markets ( DIA SPY QQQ IWM TLT ) should rise on a dovish rally. If job market data releases are lower than expectations, yields ( TTT ) and the dollar ( UUP ) should lower, and markets ( DIA SPY QQQ IWM TLT ) should rise on a dovish rally; if job market data releases are greater than expectations, yields ( TTT ) and the dollar ( UUP ) should rise, and markets ( DIA SPY QQQ IWM TLT ) should lower on a hawkish rally.
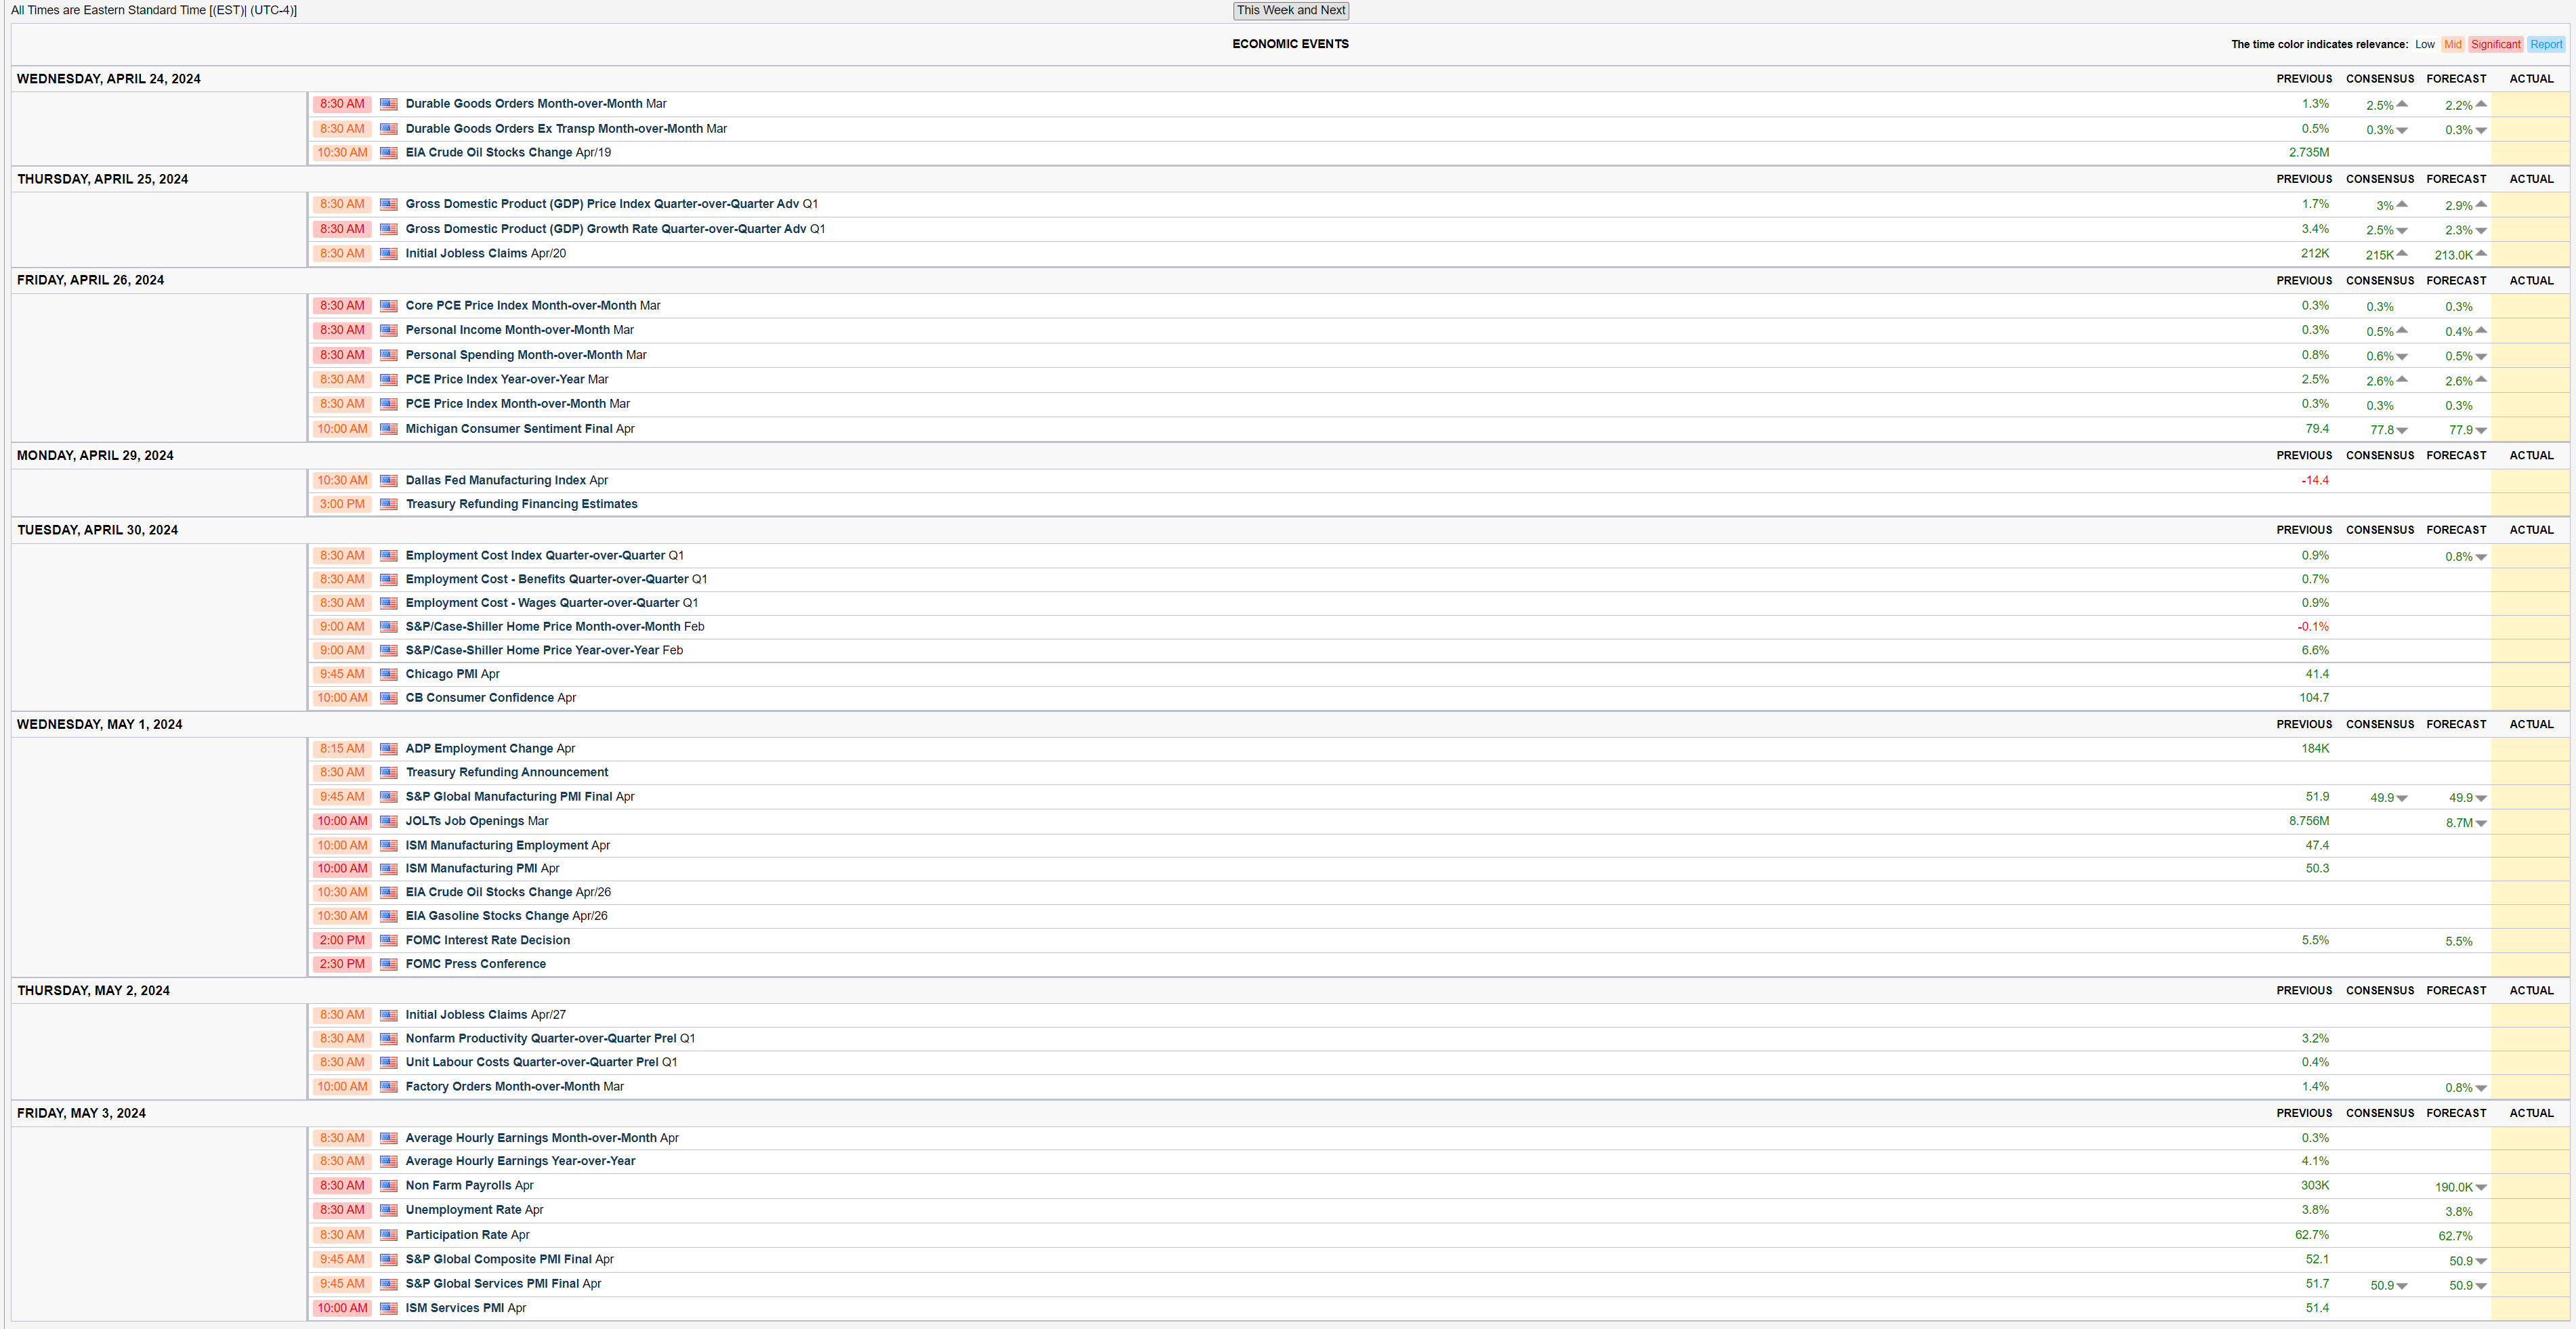
Figure 24. This & Next Week’s Macroeconomic Data Release Expectations.
To conclude, I expect a hawkish hold ( i.e., neither cut nor hike ) on the forthcoming FOMC rate decision, as there really is no need for rate cuts but for even a rate hike.
Europe:
The Eurozone is performing within the range of expectations, the monetary policy decision and data releases have been as expected, the Eurozone continues to prove resilience, as the European Central Bank’s Ms. Lagarde recently remarked. The European Central Bank’s Governing Council members shifted dovishly in recent months and weeks, but markets have shifted hawkishly in recent months as economic data suggests no need for rate cuts, although the European Central Bank pointed for the first rate cut in June of this year, which is in line with economists and market expectations.
Figure 25. European Central Bank's (ECB) Governing Council Hawk & Dove Members.

Figure 26. European Central Bank's Governing Council Doves & Hawks Infograph. ( Somewhat Neutral, Slightly Dovish )
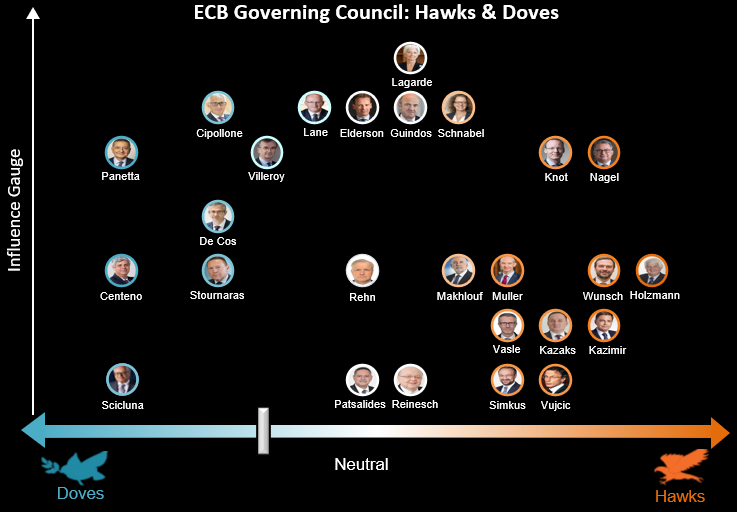
Figure 27. Economists Expectations Over Over The European Central Bank’s Monetary Policy Rate:
Figure 28. Market Expectations Over The European Central Bank’s Monetary Policy Rate:

Given the strong macroeconomic data with employment remaining strong with the unemployment rate at historical lows and the Euro-Area inflation rate nearing the European Central Bank’s price stability goal, it is coherent that the International Monetary Fund (IMF) has lifted growth forecasts for the Euro-Zone. The Euro-Zone’s Phillips curve points to soft-landing in Europe.
Figure 29. Euro-Area & European Unemployment Rate Keeps Being At Record Low Proving A Strong Job Market.
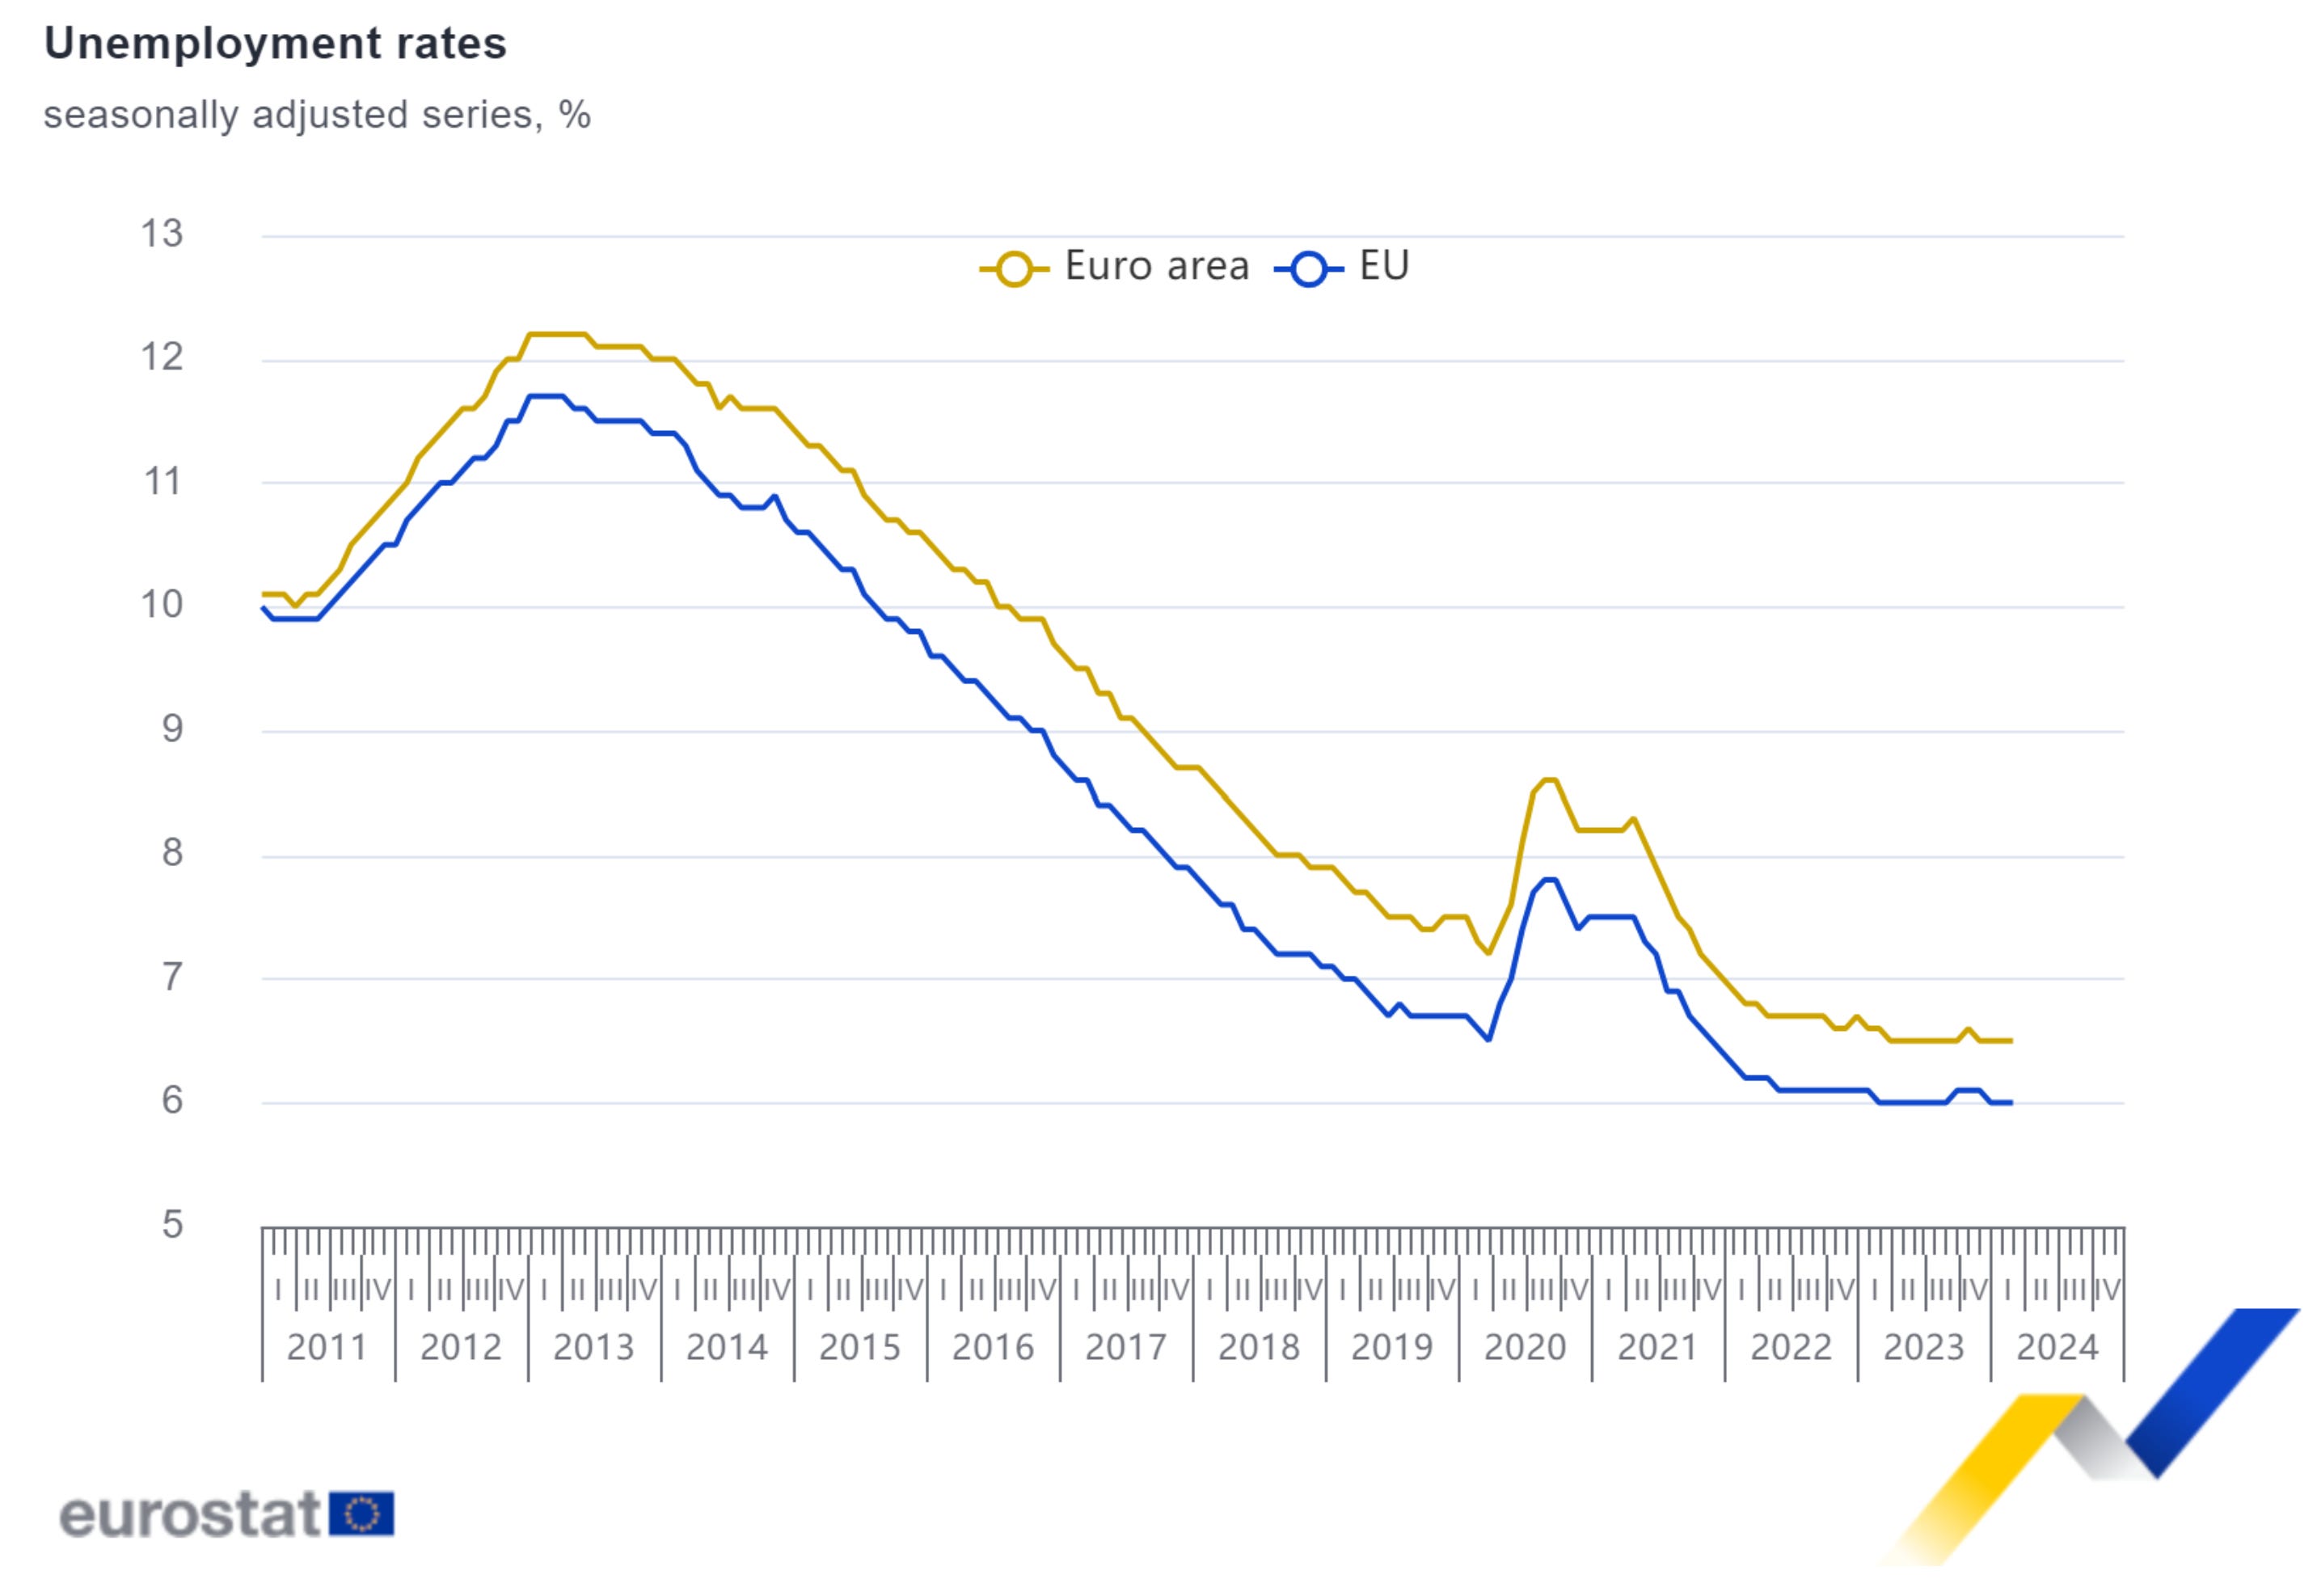
Figure 30. Euro-Area Inflation Rate Is Nearing The European Central Bank’s Price Stability Goal.
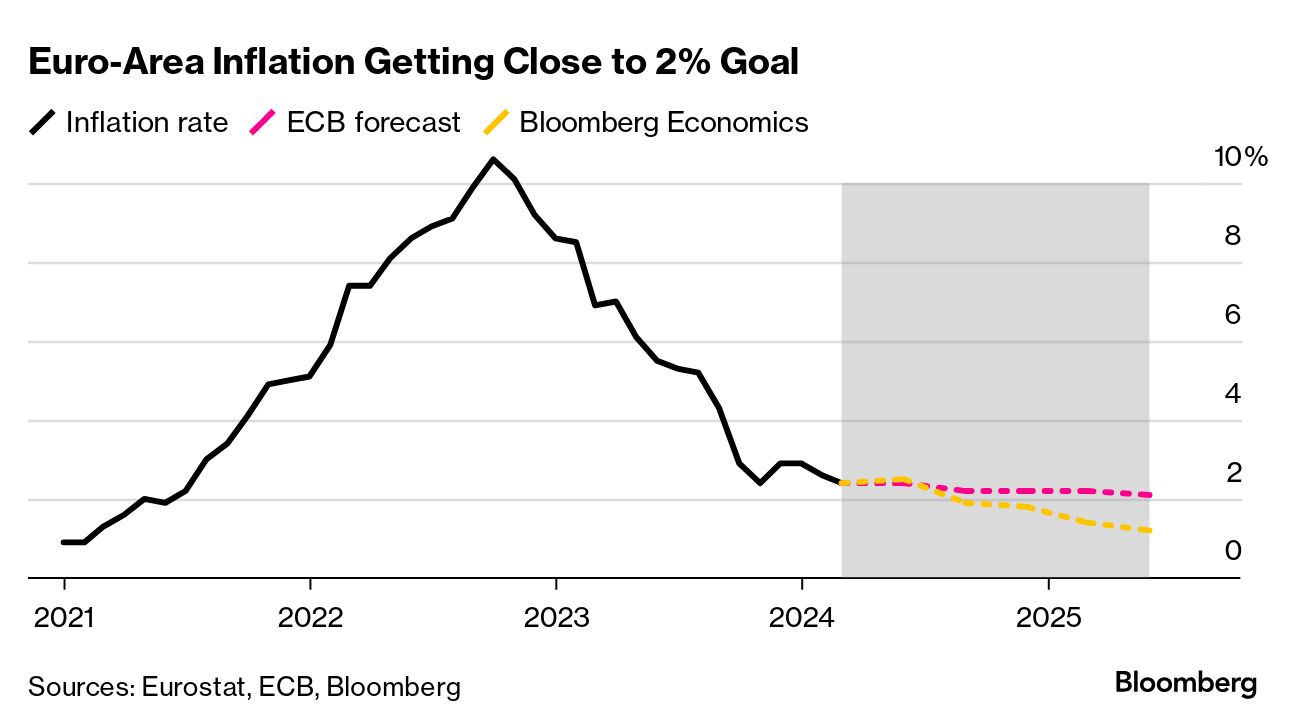
Figure 31. The International Monetary Fund’s (IMF) Inflation & Growth Projections Indicate Sof-Landing.
")
Figure 32. Euro-Zone’s Phillips Curve Indicates Soft-Landing.
")
Eurozone’s biggest economy, which is the world’s third largest economy ( which surpassed Japan early in the year ) proves resilience; sentiment has risen in compass with strong macroeconomic data releases, which Chancellor Olaf Scholz remarked; polls suggest that Chancellor Olaf Scholz’s Sozialdemokratische Partei Deutschlands (SPD) is gaining ground given the measures of the government that have and are keeping Europe’s biggest economy resilient.
Figure 33. Chancellor Olaf Scholz's Sozialdemokratische Partei Deutschlands (SPD) Is Eclipsed In Polls Since August of Last Year.

Figure 34. Political Compass Of The World's Third Largest Economy. ( Conservatives Dominate In The Polls. )

Jobs creation and improvements on inflation may be why Chancellor Olaf Scholz gained momentum in polls; with recent statistics indicating that manufacturing activity is gathering momentum, surprising analysts, polls are likely going to reflect it. Although inflation has not yet reached the European Central Bank’s price stability goal, which may be why markets strengthen the hawk positioning rather than dove positioning. When it comes to geopolitics in Europe, as explained early in the post, the war in Ukraine remains concentrated in the same regions, the Russians aren’t advancing in the Luhansk and Donetsk regions of Ukraine; in my opinion, as explained before, Russia is playing the long-term playbook in the form of an attrition war in Ukraine fought by NATO as proxy war in order to erode NATO’s military capabilities by making NATO members send their military gear to Ukraine without NATO members restocking that military gear, reminding again that just 35% of NATO members meet the alliance’s spending targets, meaning that NATO is weak and weakening by and through the proxy war’s military equipment supply, in my opinion NATO should deploy troops in Ukraine instead of weakening NATO itself in a attrition war that is in my opinion perfectly engineered to further destabilize NATO for when and if the war in the region escalates, NATO members will have less military capabilities to respond.
Figure 35. Russo-Ukrainian War Map:

Figure 36. Russo-Ukrainian War Luhansk Oblast Region Map:

Figure 37. Russo-Ukrainian War Donetsk Oblast Region Map:
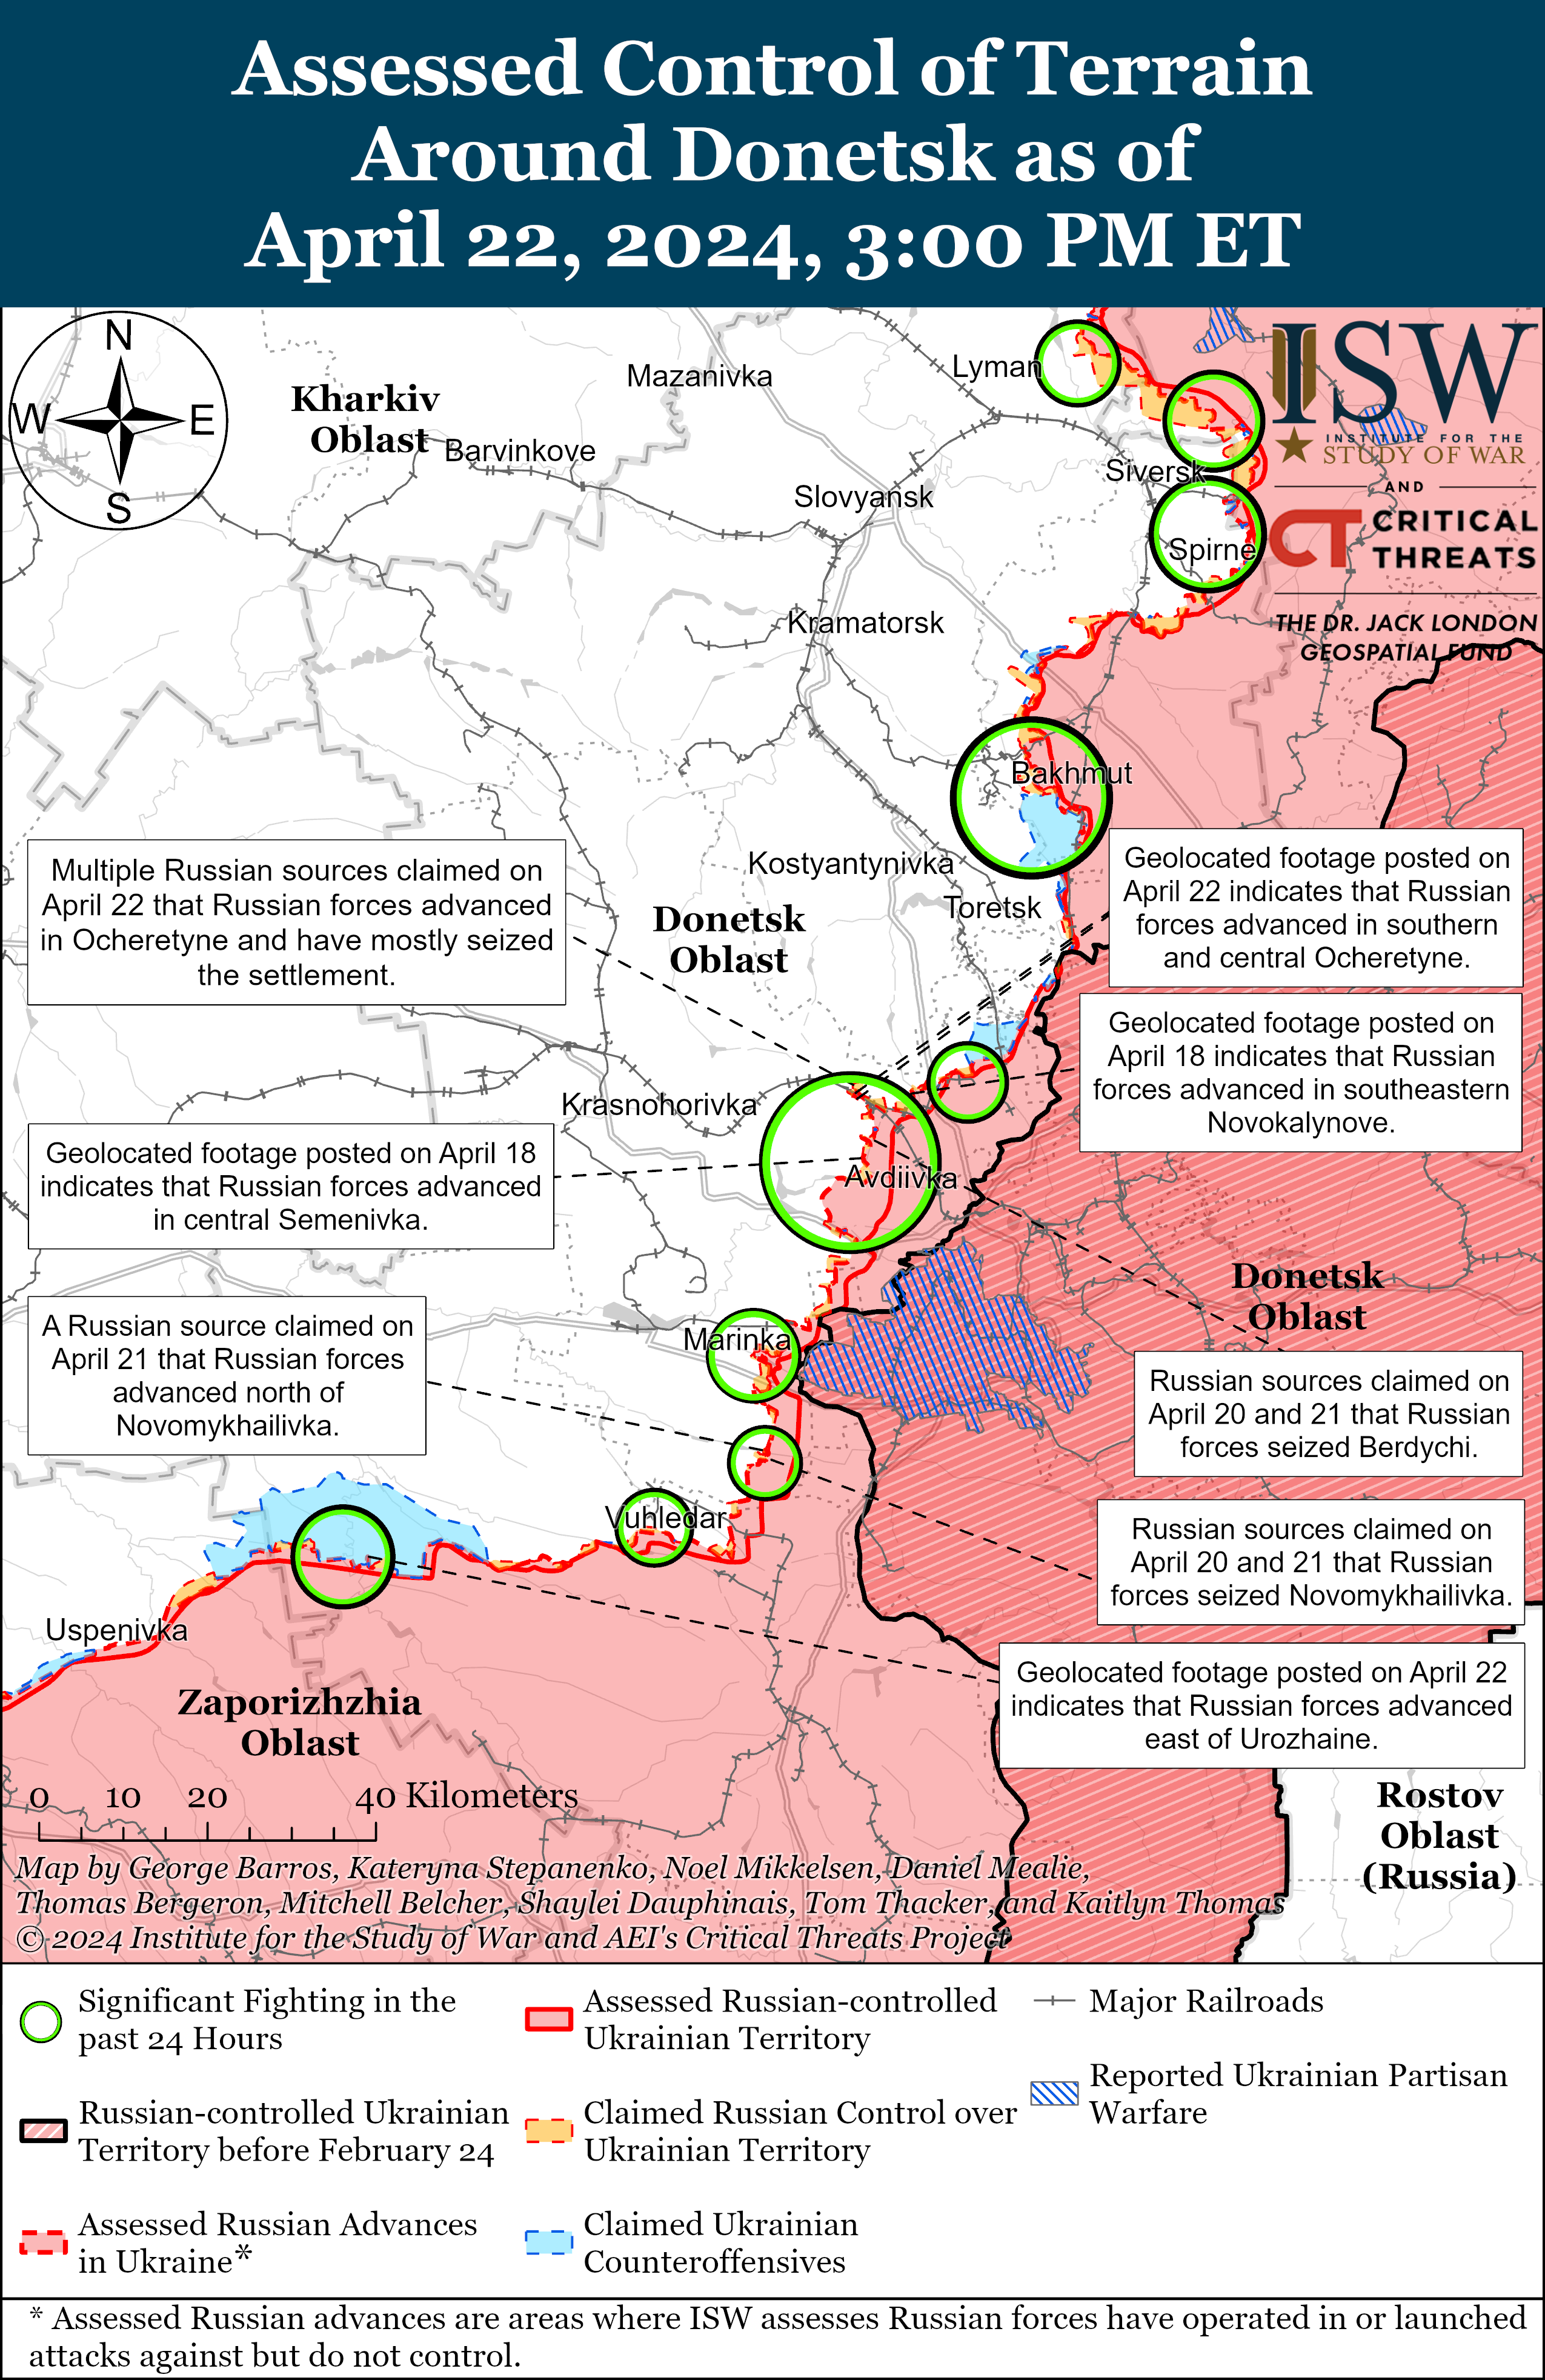
Figure 38. Russo-Ukrainian War Western Donetsk Oblast Region Map:

The risky and reckless warfare in the Zaporizhzhia Oblast region of Ukraine is somewhat concerning, as that region holds a nuclear energy plant that could erase from the map that region and more regions if damaged as a direct or indirect consequence of warfare in the region. Developments in that region are dangerously concentrated near the nuclear energy plant, which is why the International Atomic Energy Agency (IAEA) is constantly issuing statements over it.
Figure 39. Russo-Ukrainian War Zaporizhzhia Oblast Region Map:

I highly doubt that nuclear weapons will be used in the inevitable world war vectored by and from inevitable developments in the Indo-Pacific region, that were assured by China’s president. Using nuclear weapons would be a coward move, hiding like a mole underground, in a bunker, pushing a button to change nothing, because those pushing buttons will see each other again, while innocent people die because of cowards taking the easy war path that doesn’t solve nothing; markets downplay it and bet on it. To conclude, if the forward inflation data releases are more elevated than expectations, yields and the euro should rise, and markets should lower on a hawkish rally; if inflation data releases show deflation, yields and the euro should lower, and markets should rise on a dovish rally. If job market data releases are greater than expectations, yields and the euro should rise, and markets should lower on a hawkish rally; if job market data releases are lower than expectations, yields and the euro should lower, and markets should rise on a dovish rally.
Figure 40. This & Next Week’s Macroeconomic Data Release Expectations.
In summary, soft-landing remains the likely scenario; nonetheless, markets should be attentive to the next Gross Domestic Product (GDP) data release in order to confirm soft-landing expectations.
United Kingdom:
The United Kingdom is performing within the range of expectations; recent statistical data releases suggest no recession, confirming for the second consecutive month that the technical recession in the United Kingdom is over. Despite the fact that the United Kingdom’s technical recession is over, the nation’s employment statistics indicate that the United Kingdom is deviating from its strong job market path, as the nation’s unemployment rate rose to levels not seen since the summer of 2023, which a Bank of England Monetary Policy Committee member remarked.
Figure 41. The United Kingdom’s Unemployment Rate Rose To Levels Not Seen Since Summer Of 2023.

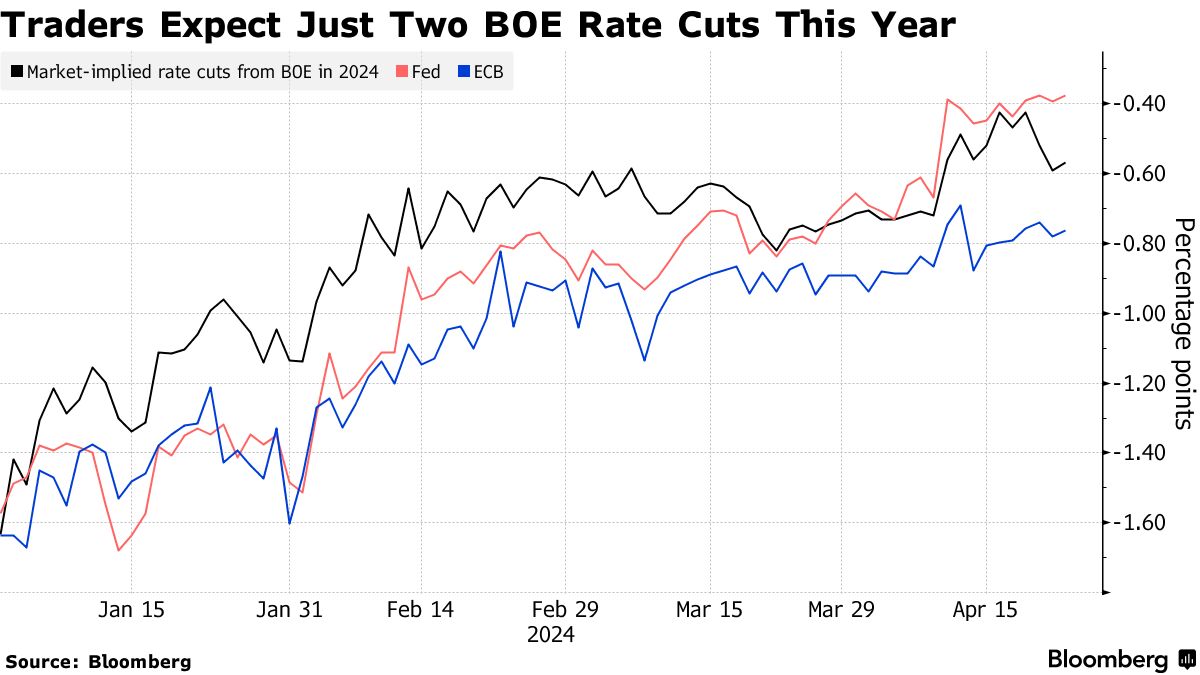
The Bank of England’s Monetary Policy Committee members’ monetary policy stance is hawkish-nimble; nonetheless, the Bank of England’s Bailey’s stance is neutral, somewhat dovish; the United Kingdom’s markets expect just two rate cuts for this year.
Figure 42. Bank of England (BoE) Monetary Policy Committee’s Hawks & Doves.

Figure 43. Market Expectations Over The Bank of England’s Monetary Policy Rate.

Figure 44. Traders Expect Just Two Rate Cuts This Year.
The government’s Gilt bond issuance increase will likely increase the effect of the Bank of England’s Quantiative Tighening (QT).
Figure 45. The United Kingdom’s Government Boosted Gilt Bond Issuance For This Fiscal Year.

The government’s Gilt bond issuance increase is skewed toward short-term bonds.
Figure 46. The Government’s Gilt Bond Issuance Increase Is Skewed Towards Short-Term Bonds.

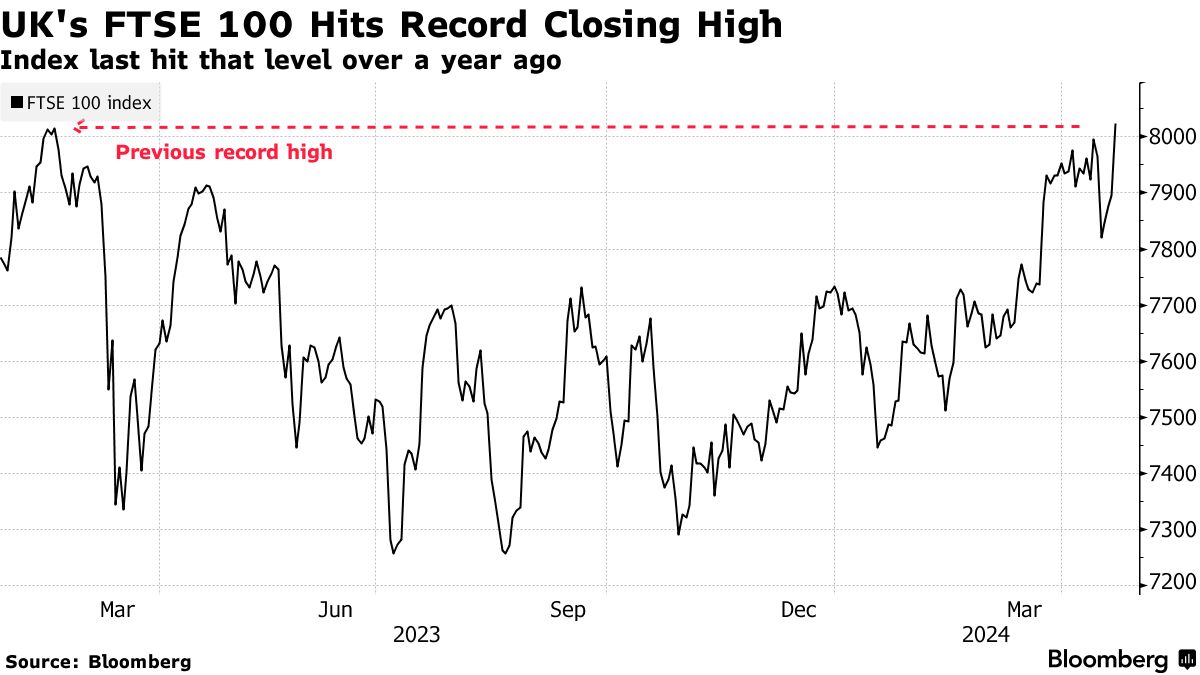
The government’s Gilt bond issuance increase will likely push government bond yields higher; this may pressurize the United Kingdom’s markets in the short-term, but this really depends on markets’ VaR. In my opinion, United Kingdom’s markets remain undervalued even though they recently reached all time highs, the strong commitment of the government towards ensuring growth has pushed the government deficit higher; polls indicate that Prime Minister Rishi Sunak has completely lost support of Britons and so have Conservatives; polls show Labour’s Keir Starmer as the favorite of Britons.
Figure 47. Just 22% Of Britons Have A Favourable Opinion Of United Kingdom’s Prime Minister Rishi Sunak.

Figure 48. Just 14% of Britons Approve The Current Government.

Figure 49. 44% Of Britons Have Labour Voting Intention.

Despite the fact that the United Kingdom’s Prime Minister Rishi Sunak’s government has tried its best, the technical recession and rising unemployment rate have contributed to the momentum in the polls.
Figure 50. 24% Of Britons Think Rishi Sunak Is Doing Well As Prime Minister.

The late-taken measures have allowed Prime Minister Rishi Sunak to deliver his pledges, but just 14% of Britons support the government; in my opinion, the government’s approach should be more direct than general, as polls indicate specific concerns by Britons that can easily be addressed with legislative measures; populism by Labour’s Keir Starmer has led to the rise in the polls.
Figure 51. Labour’s Keir Starmer Eclipses Conservative’s Rishi Sunak.

Nevertheless, 42% of Britons don’t think Labour is trustworthy, and 47% of Britons think Labour’s Keir Starmer is doing badly as Labour’s leader, despite the fact that polls find both favourable, proving to show how populism works.
Figure 52. Despite The Fact That Labour’s Keir Starmer Eclipses Conservative’s Rishi Sunak In The Polls, Britons Don’t Think Labour Is Trustworthy.

Figure 53. Almost 50% Of Britons Think Labour’s Keir Starmer Is Doing Badly As Labour Leader.

Expectations remain optimistic; I believe that the United Kingdom is a sleeping industrial country that can reindustrialize at any time, thereby phasing out the still present Brexit effect and consequently enhance the nation’s global trade of goods, which would boost the Gross Domestic Product (GDP), generate jobs, and consequently enhance the British pound value given higher global goods trade volume with it.
I Don’t Know Why But When I think About The Plausible Industrialization, I Picture The United Kingdom As Claude Monet’s Sunrise Despite Being A Painting Of France’s Lé Hâvre.

I believe that a reindustrialization of the nation is a trillion pound opportunity, that perhaps, not this generation, but the next one could materialize; which is why I believe that the United Kingdom is undervalued even though recently reached all-time highs.
Figure 54. Despite The Fact That The United Kingdom’s Markets Have Reached All-Time Highs, I Believe They’re Still Undervalued.
To conclude, if macroeconomic data releases are greater than expectations, yields and the British pound should lower, and markets should rise on a dovish rally.
Figure 55. This & Next Week’s Macroeconomic Data Release Expectations.
If macroeconomic data releases aren’t within the range of expectations, yields and the British pound should rise, and markets should lower on a hawkish rally.
Asia:
China:
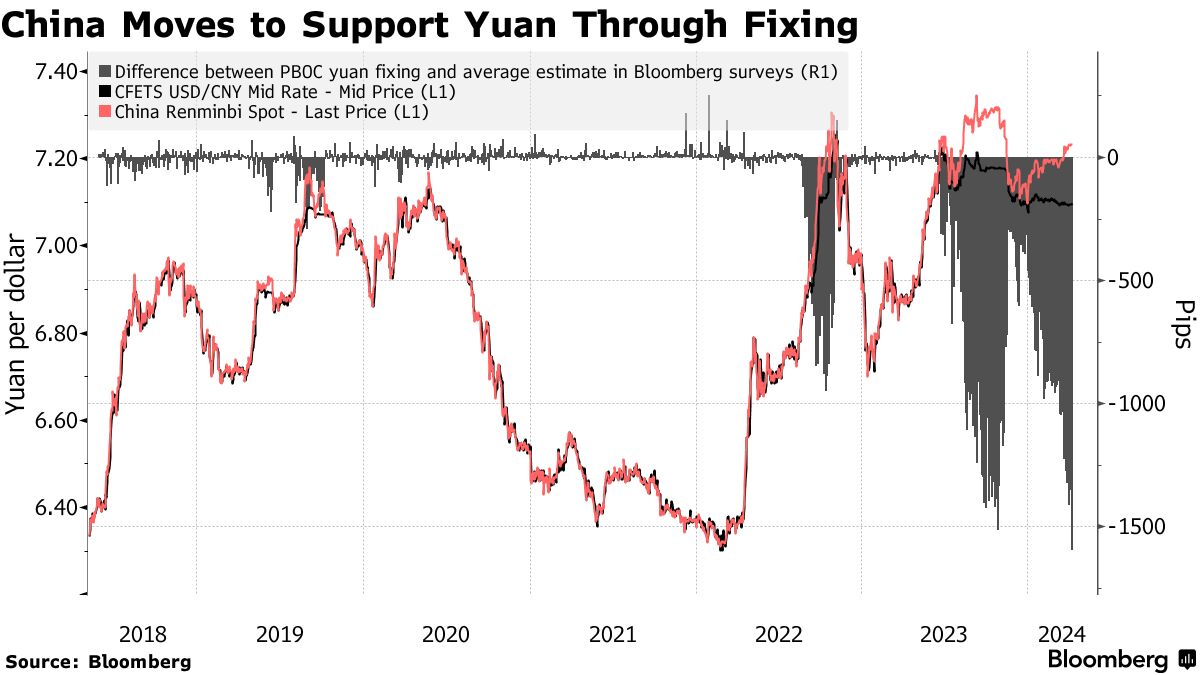
The People’s Republic of China’s government’s growth ambitions have materialized, but at the cost of devaluing the Chinese currency, which the government seeks to defend through PBoC fixing.
Figure 56. The People’s Republic of China’s Growth Ambitions Materialize.

Figure 57. The Government’s Growth Ambitions Materialized At The Cost Of The Chinese Currency Devaluation, Which The People’s Bank of China Defends Through Fixing.
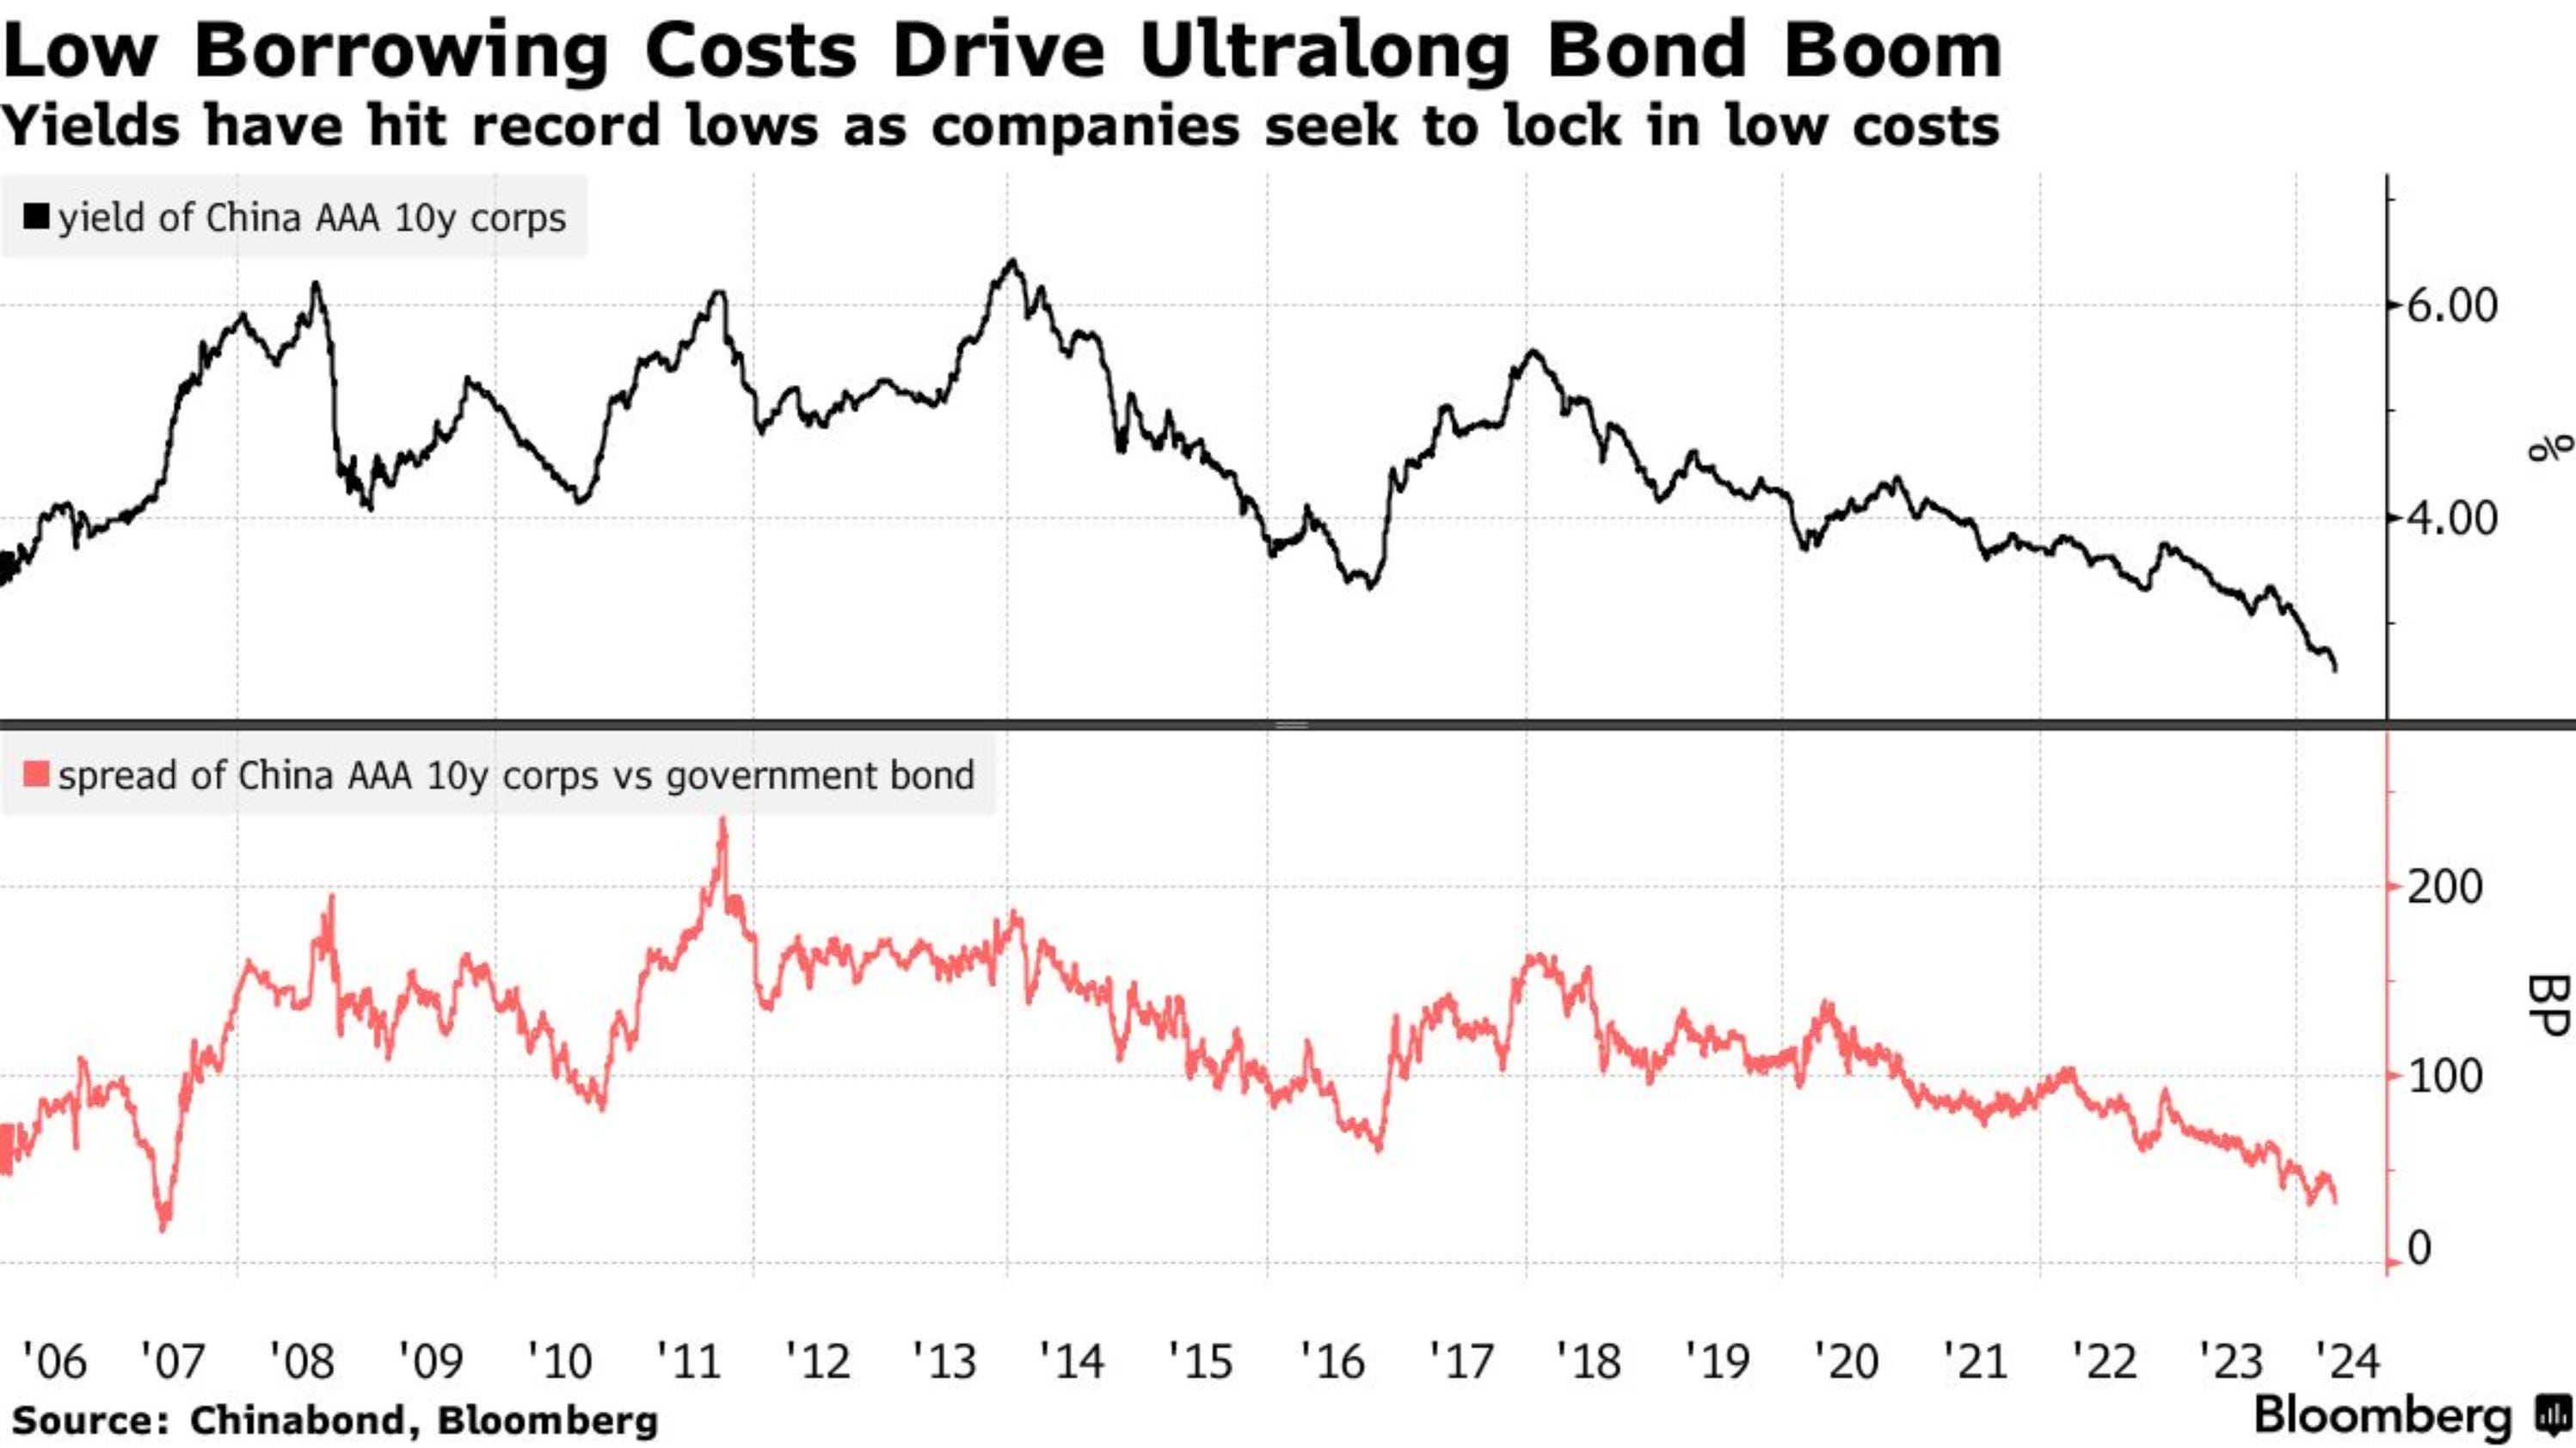
The Chinese currency’s global usage has surpassed the Euro and British pound, although this hasn’t enhanced the valued of the Chinese currency, which makes me wonder if Soros is back in business, because the price action in the Chinese currency looks like a Soros moment; although the debt market, in specific the credit and government bond market is on a bull market, markets have been adjusting VaR in Chinese markets rotating from stocks to bonds and credit.
Figure 58. Bulls Are In Control Of The Debt Market As Yields Ease To Multi Decade Lows.
Markets rotation has been going on since the People’s Republic of China’s president 习近平 commented that the People’s Republic of China may start trading government bonds during the twice-a-decade central financial work conference. A similar approach was used by the United States’ Federal Reserve through open market operations; new market rules in Chinese markets increased the market rotation from stocks to bonds, nonetheless, non-speculative Chinese markets remain steady.
Figure 59. DB China H-Shares Income Index.
[ Left Y-axis: Index data. (🟦) | Right Y-axis: Volatility of the index. (🟥) ]
![[ Left X-axis: Index data. (🟦) | Right X-axis: Volatility of the index. (🟥) ] | Data as of 04/23/2024 Hong Kong market close. | Bloomberg Ticker: DBPPCEQI <GO> |](https://substackcdn.com/image/fetch/w_1456,c_limit,f_webp,q_auto:good,fl_progressive:steep/https%3A%2F%2Fsubstack-post-media.s3.amazonaws.com%2Fpublic%2Fimages%2F61964507-416a-4716-a8ad-c0d9d45e0dfa_3818x1948.png "[ Left X-axis: Index data. (🟦) | Right X-axis: Volatility of the index. (🟥) ] | Data as of 04/23/2024 Hong Kong market close. | Bloomberg Ticker: DBPPCEQI <GO> |")
China seeks competition with major global leaders. Germany’s Chancellor Olaf Scholz’s meeting with the People’s Republic of China’s president 习近平, given the anniversary of the decade-long establishment of a partnership between Germany and China, remarked on highly stable, consistent, and constructive cooperation between the nations.
Germany’s Chancellor Olaf Scholz’s Meeting With The People’s Republic of China’s President 习近平.


When it comes to geopolitics, expectations remain the same, as Taiwan keeps being China.
Figure 60. As Shown Before, These Are The Potential Landing Beaches For Amphibious Vehicles & Taiwan’s Industrial, Military, and Logistics Sites Map:

To conclude, if macroeconomic data releases are greater than expectations, yields and the Chinese currency should lower, and markets should rise on a dovish rally.
Figure 61. Upcoming Macroeconomic Data Release Expectations.
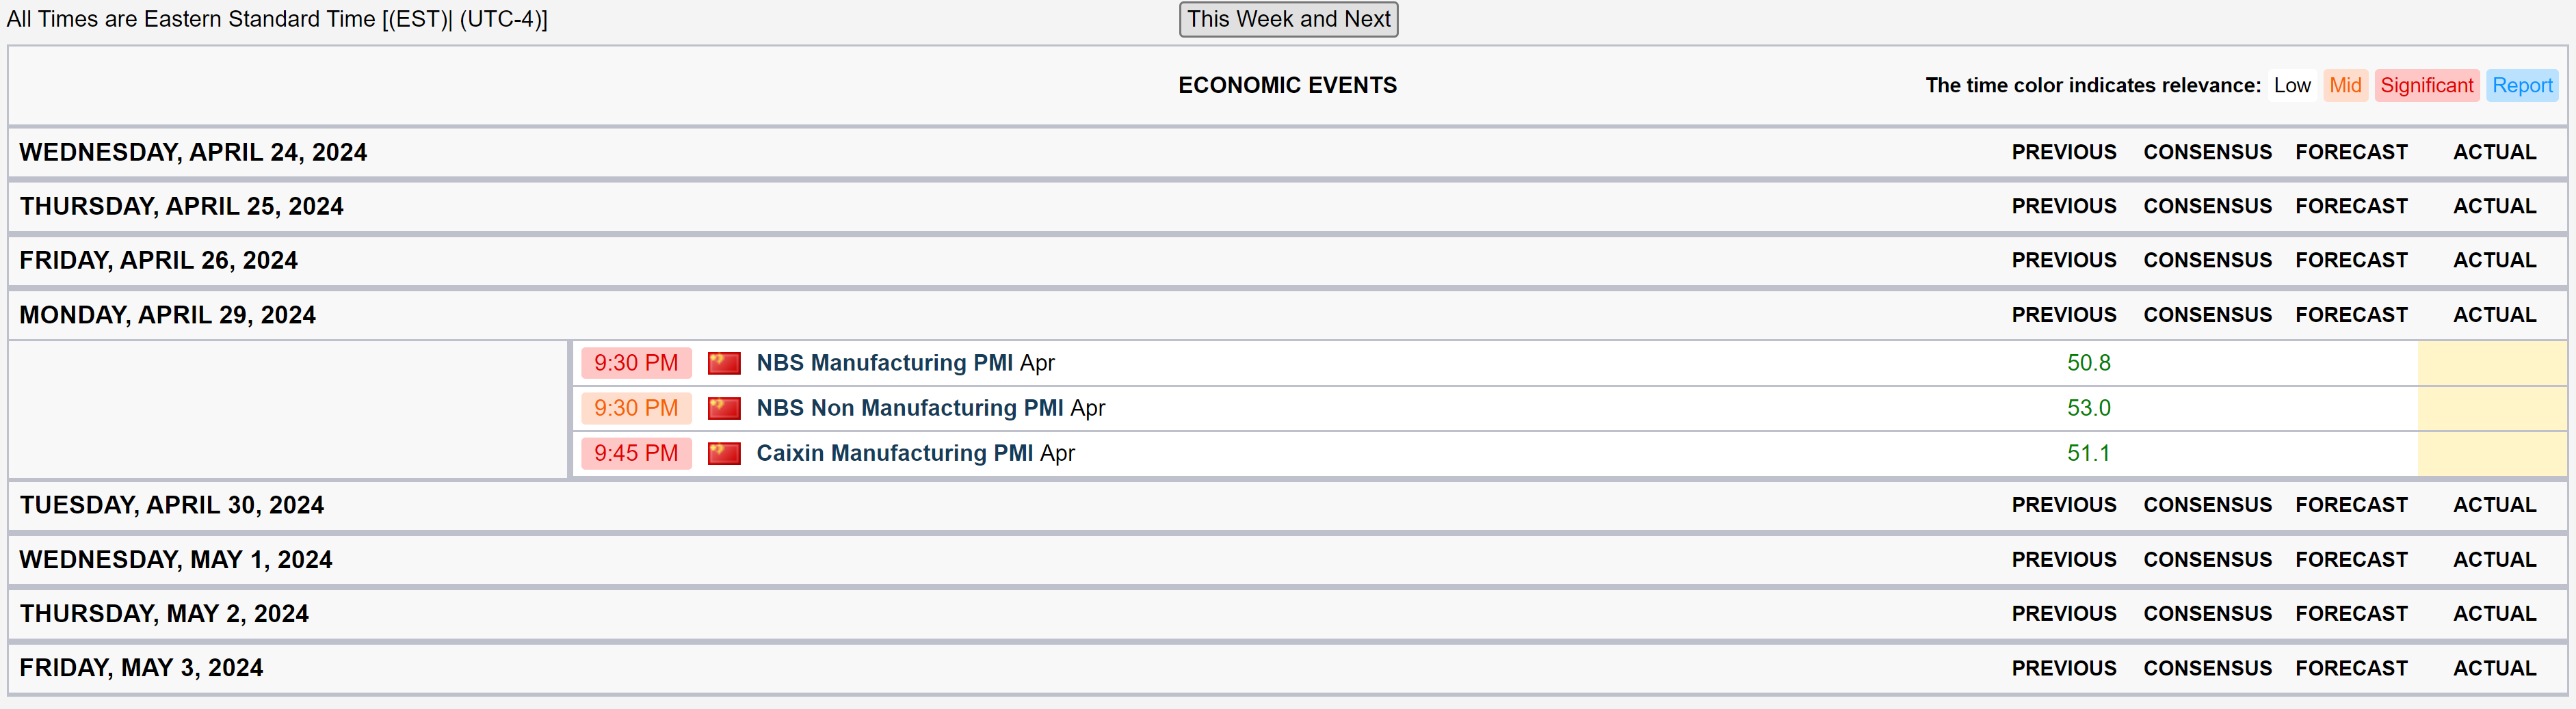
If macroeconomic data releases aren’t within the range of expectations, yields and the Chinese currency should rise, and markets should lower on a hawkish rally.
Japan:
前の記事にあったなぞなぞの暗号を解読した人は知っている。解読できなかった人は、暗号があることを知ることになる。
The Japanese economy is performing within the range of expectations, the only factor pressurizing the Japanese economy is the increased and increasing cost of living in Japanese terms, but Japan is becoming cheap in U.S. dollar terms, given the Japanese Yen devaluation. Japanese households spending slowed, although Japanese households signal tolerance to inflation as inflation eases towards the Bank of Japan’s price stability goal.
Figure 62. Japanese Households Signal Tolerance To Inflation.
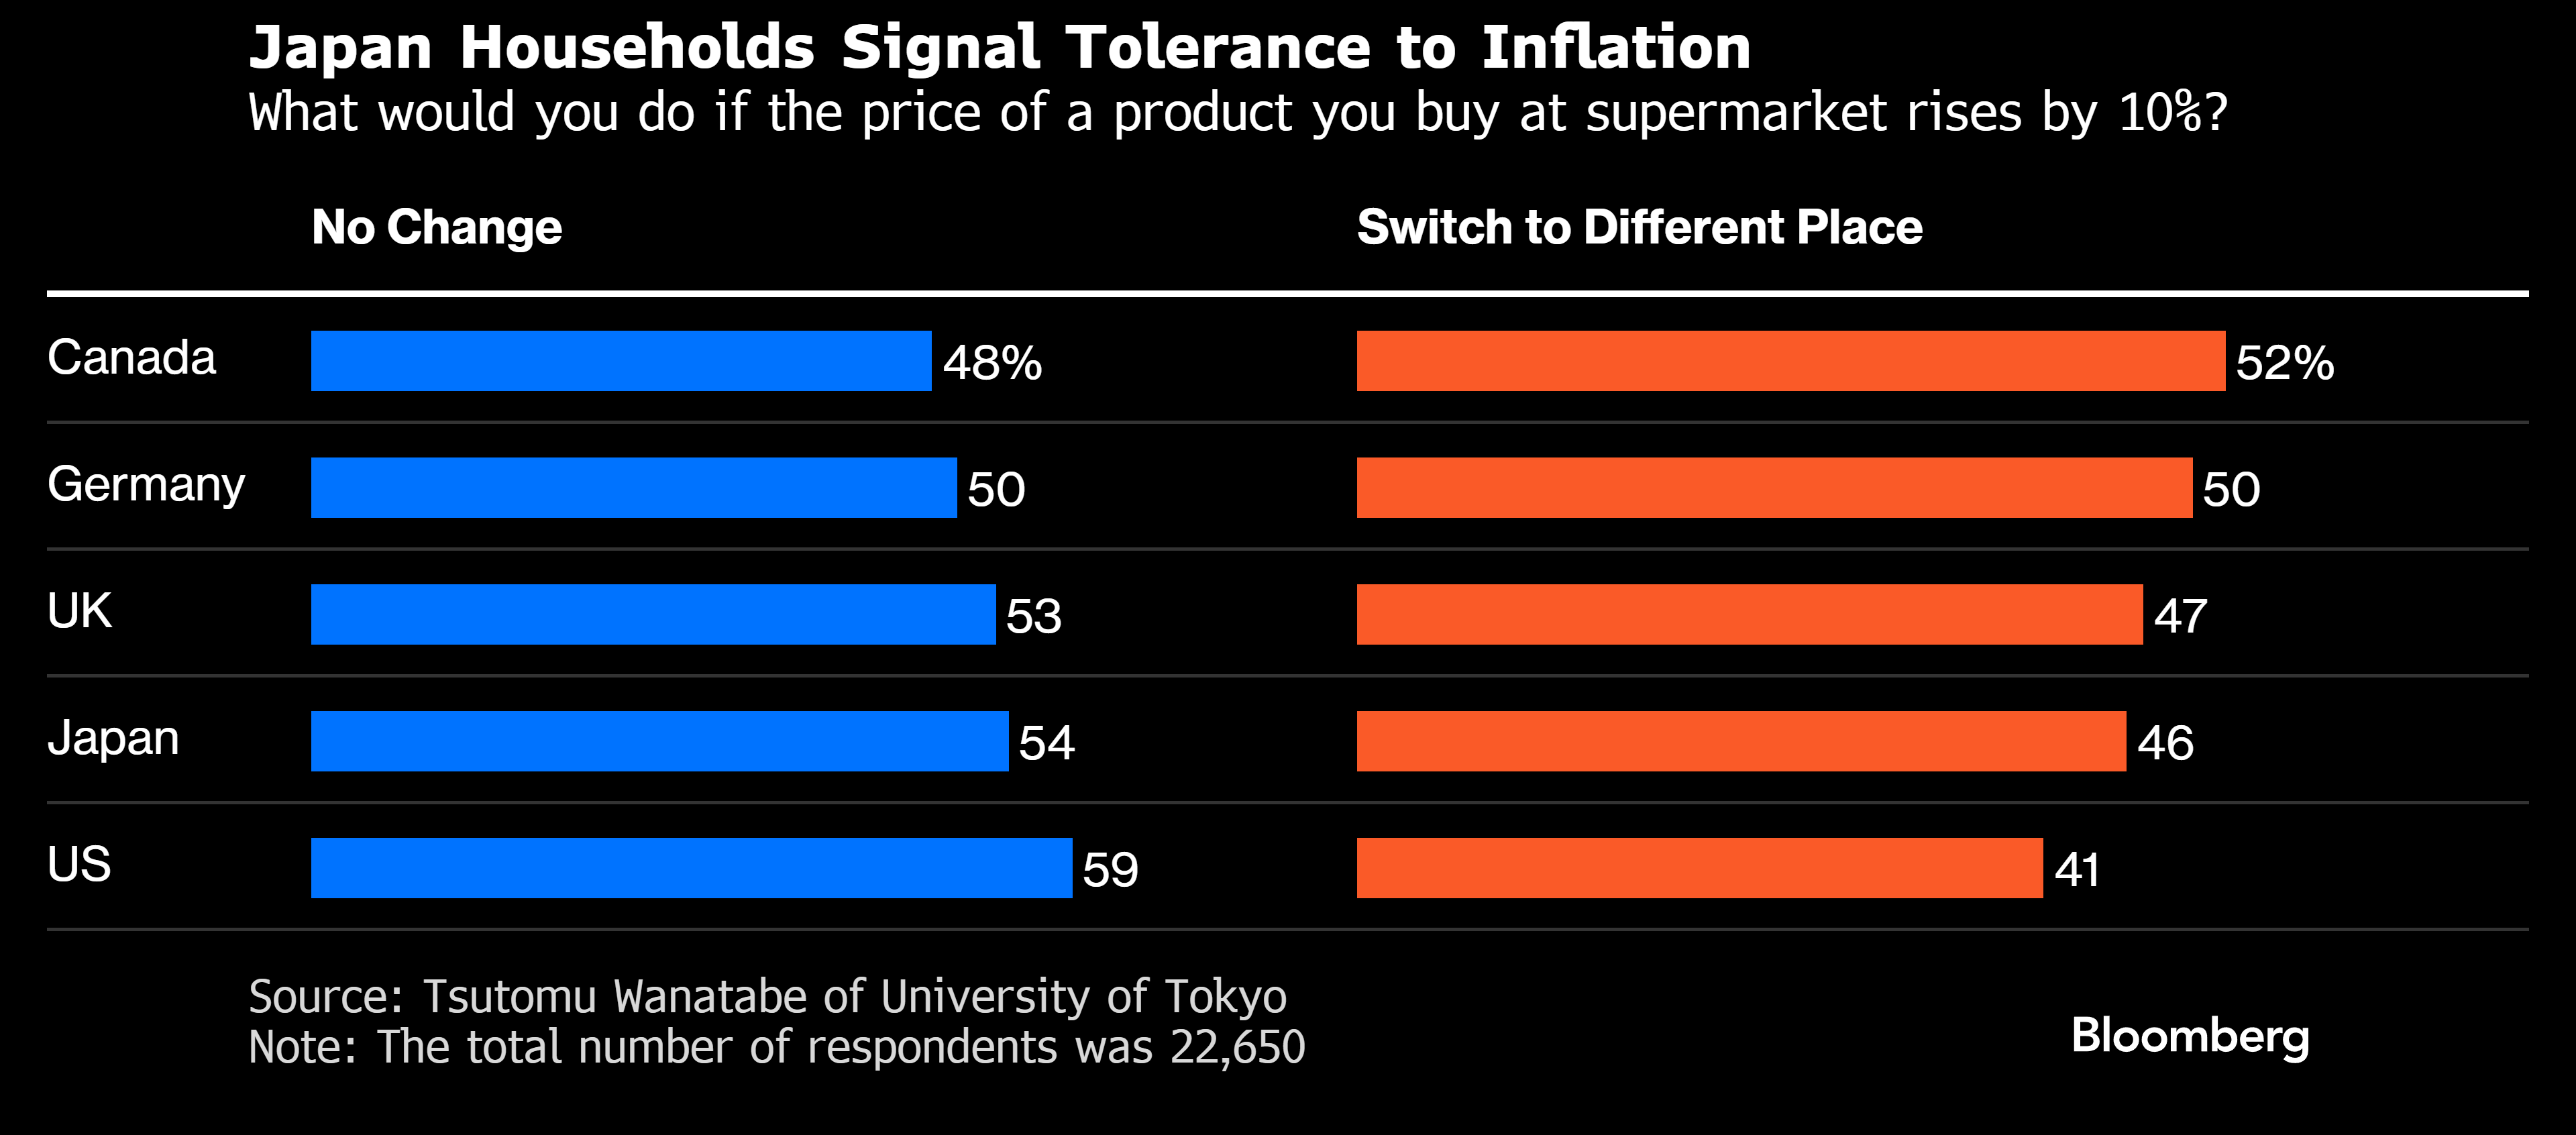
Figure 63. Japanese Core & Non-Core Inflation Statistics.

Figure 64. Japanese Energy-Related Inflation:

Given the fact that the non-harmonized inflation statistics show Japanese inflation at a double-digit percentage, markets are quite bearish on the Japanese Yen; the non-existent measures by the Japanese government towards enhancing the Japanese currency have led to a more drastic devaluation of the Japanese Yen even though rate hikes were implemented.
Figure 65. Markets Are Bearish On The Japanese Yen.

Figure 66. The Non-Existent Measures By The Government Have led To A More Drastic Japanese Yen Devaluation, Despite The Fact That The Bank of Japan (BoJ) Normalized Monetary Policy.

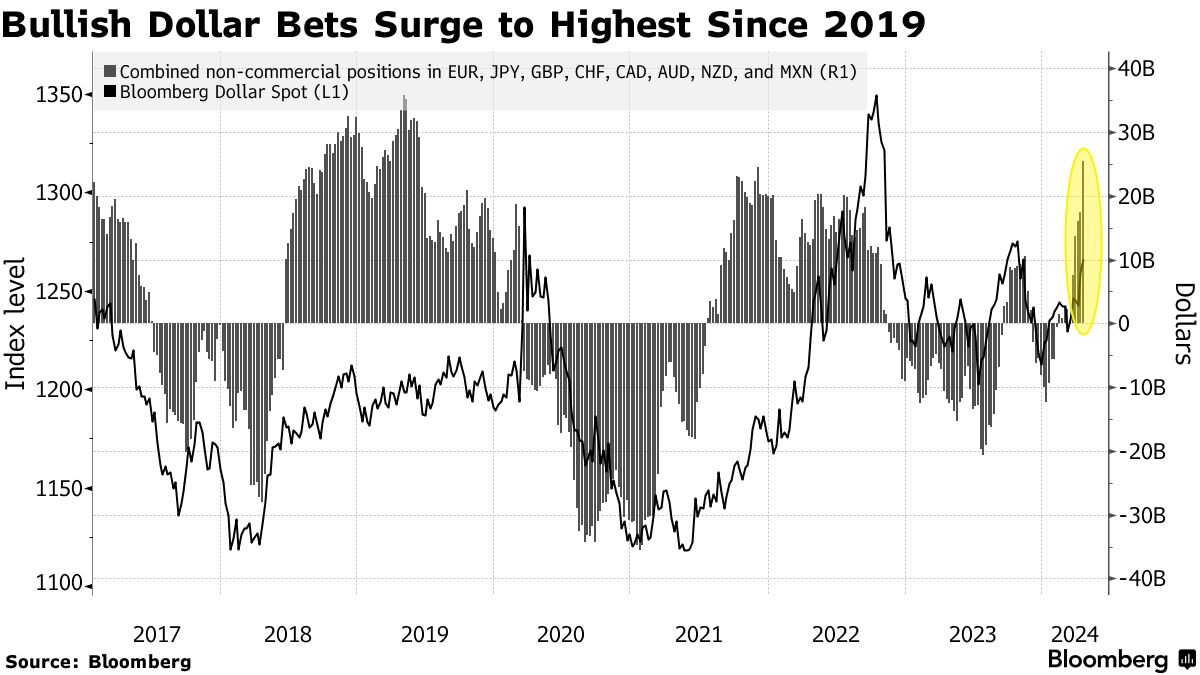
Market bullishness on the dollar is at its highest level since 2019, has also contributed to the previously shown statistics.
Figure 67. Dollar Bullishness By Markets At The Highest Level Since 2019 Has Contributed To The Japanese Yen Devaluation.
The Japanese Yen devaluation has pushed Japanese government bond yields to levels not seen in a while; these factors have contributed to the pressurization of Japanese market valuations, although non-speculative markets kept trending higher.
Figure 68. DB Japan Dividend ER.
[ Left Y-axis: Index data. (🟦) | Right Y-axis: Volatility of the index. (🟥) ]
![[ Left X-axis: Index data. (🟦) | Right X-axis: Volatility of the index. (🟥) ] | Data as of 04/23/2024 Tokyo market close. | Bloomberg Ticker: DBAPDIJE <GO> |](https://substackcdn.com/image/fetch/w_1456,c_limit,f_webp,q_auto:good,fl_progressive:steep/https%3A%2F%2Fsubstack-post-media.s3.amazonaws.com%2Fpublic%2Fimages%2Fc188a789-2798-4a1d-bc98-b0d69ce8f41c_3812x1948.png "[ Left X-axis: Index data. (🟦) | Right X-axis: Volatility of the index. (🟥) ] | Data as of 04/23/2024 Tokyo market close. | Bloomberg Ticker: DBAPDIJE <GO> |")
Japan’s non-existent energy independence posed a risk to the Japanese Yen given the warfare in the Middle East that disrupted the oil supply to Japan and still poses a risk for the country since the 2011 Fukushima nuclear disaster, Japan’s energy independence has been reduced to less than 10%. These factors have also been a vector of speculative price action on the Japanese Yen, although oil price remained pressurized but the previously mentioned brent short volatility index captured the whole geopolitical speculative price action that affected the Japanese Yen.
Figure 69. Brent Short Volatility III Sub Index 3.
[ Left Y-axis: Index data. (🟦) | Right Y-axis: Volatility of the index. (🟥) ]
![[ Left X-axis: Index data. (🟦) | Right X-axis: Volatility of the index. (🟥) ] | Data as of 04/23/2024 market close. | Bloomberg Ticker: DBCMBS33 <GO> |](https://substackcdn.com/image/fetch/w_1456,c_limit,f_webp,q_auto:good,fl_progressive:steep/https%3A%2F%2Fsubstack-post-media.s3.amazonaws.com%2Fpublic%2Fimages%2Fdb05ad3e-3bd0-443d-aab6-130c0a293dd1_3806x1934.png "[ Left X-axis: Index data. (🟦) | Right X-axis: Volatility of the index. (🟥) ] | Data as of 04/23/2024 market close. | Bloomberg Ticker: DBCMBS33 <GO> |")
Market positioning is hawkish, and economists’ expectations over monetary policy are hawkish; I expect a hawkish hold in the upcoming rate decision of the Bank of Japan (BoJ); from July of this year to October of this year, the rate hike probability is elevated; from October of this year to further in time, the rate hike probability is low; Bank of Japan (BoJ) members are in their majority dovish, Governor Ueda is neutral.
Figure 70. Economists’ Bank of Japan (BoJ) Rate Hike Expectations In Two Scenarios.

Figure 71. Bank of Japan (BoJ) Hawks & Doves.

To conclude, if macroeconomic data releases are greater than expectations, yields and the Japanese Yen should lower, and markets should rise on a dovish rally.
Figure 72. This & Next Week’s Macroeconomic Data Release Expectations.
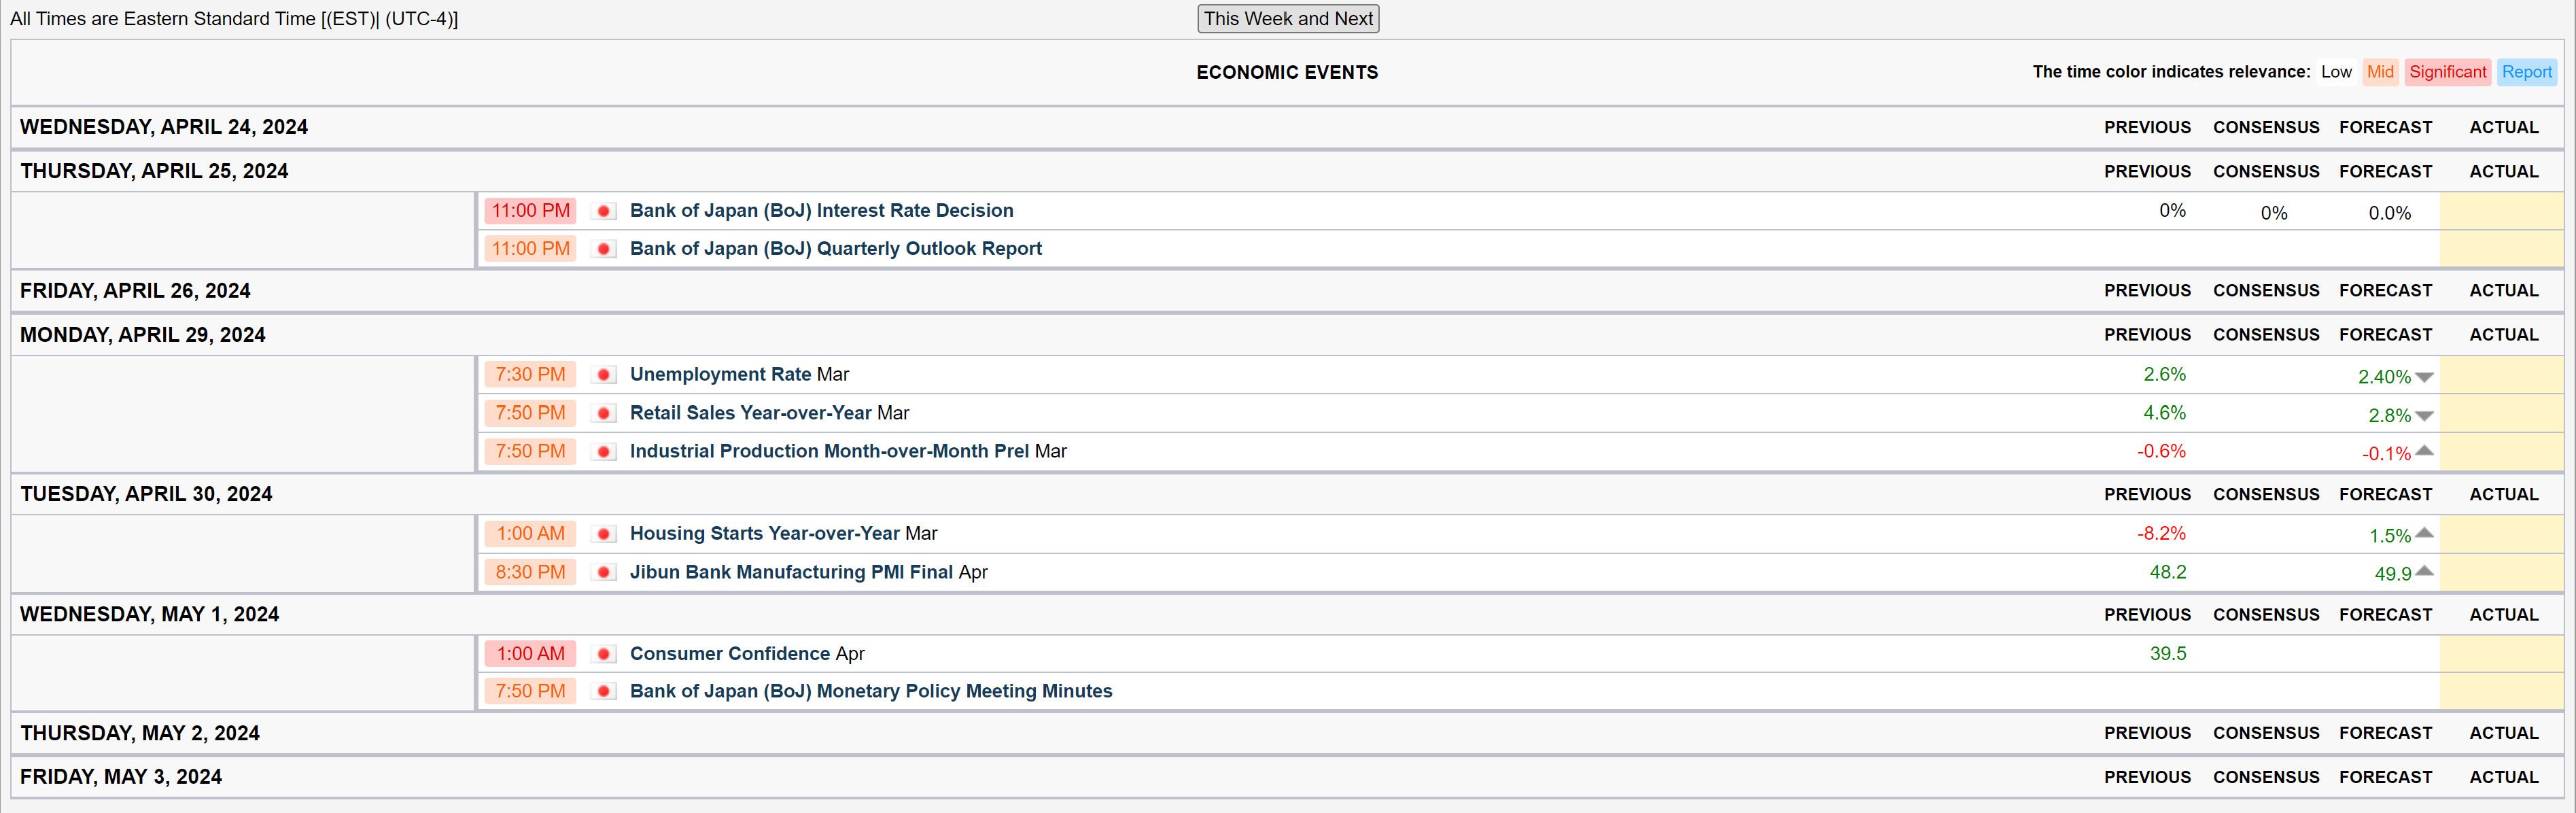
If macroeconomic data releases aren’t within the range of expectations, yields and the Japanese Yen should rise, and markets should lower on a hawkish rally.
Do feel free, as it’s free, to share, leave a comment, and subscribe to Quantuan Research Substack if you want, by using the next buttons.
It's not about the money (the research is free); it's about sending a message (delivering alpha to the reader).
Source of the video: Warner Bros.
Note: If the text in the post is grey (example) it is because the source of data is linked; everything is linked in the text, so it’s not messy to add everything at the end like in some tweets.