


Soft-landing is the likely scenario, but there are hidden risks.
Analysis of microeconomic data, macroeconomic data, political data, geo-political data, and monetary policy with commentary on it.

United States:
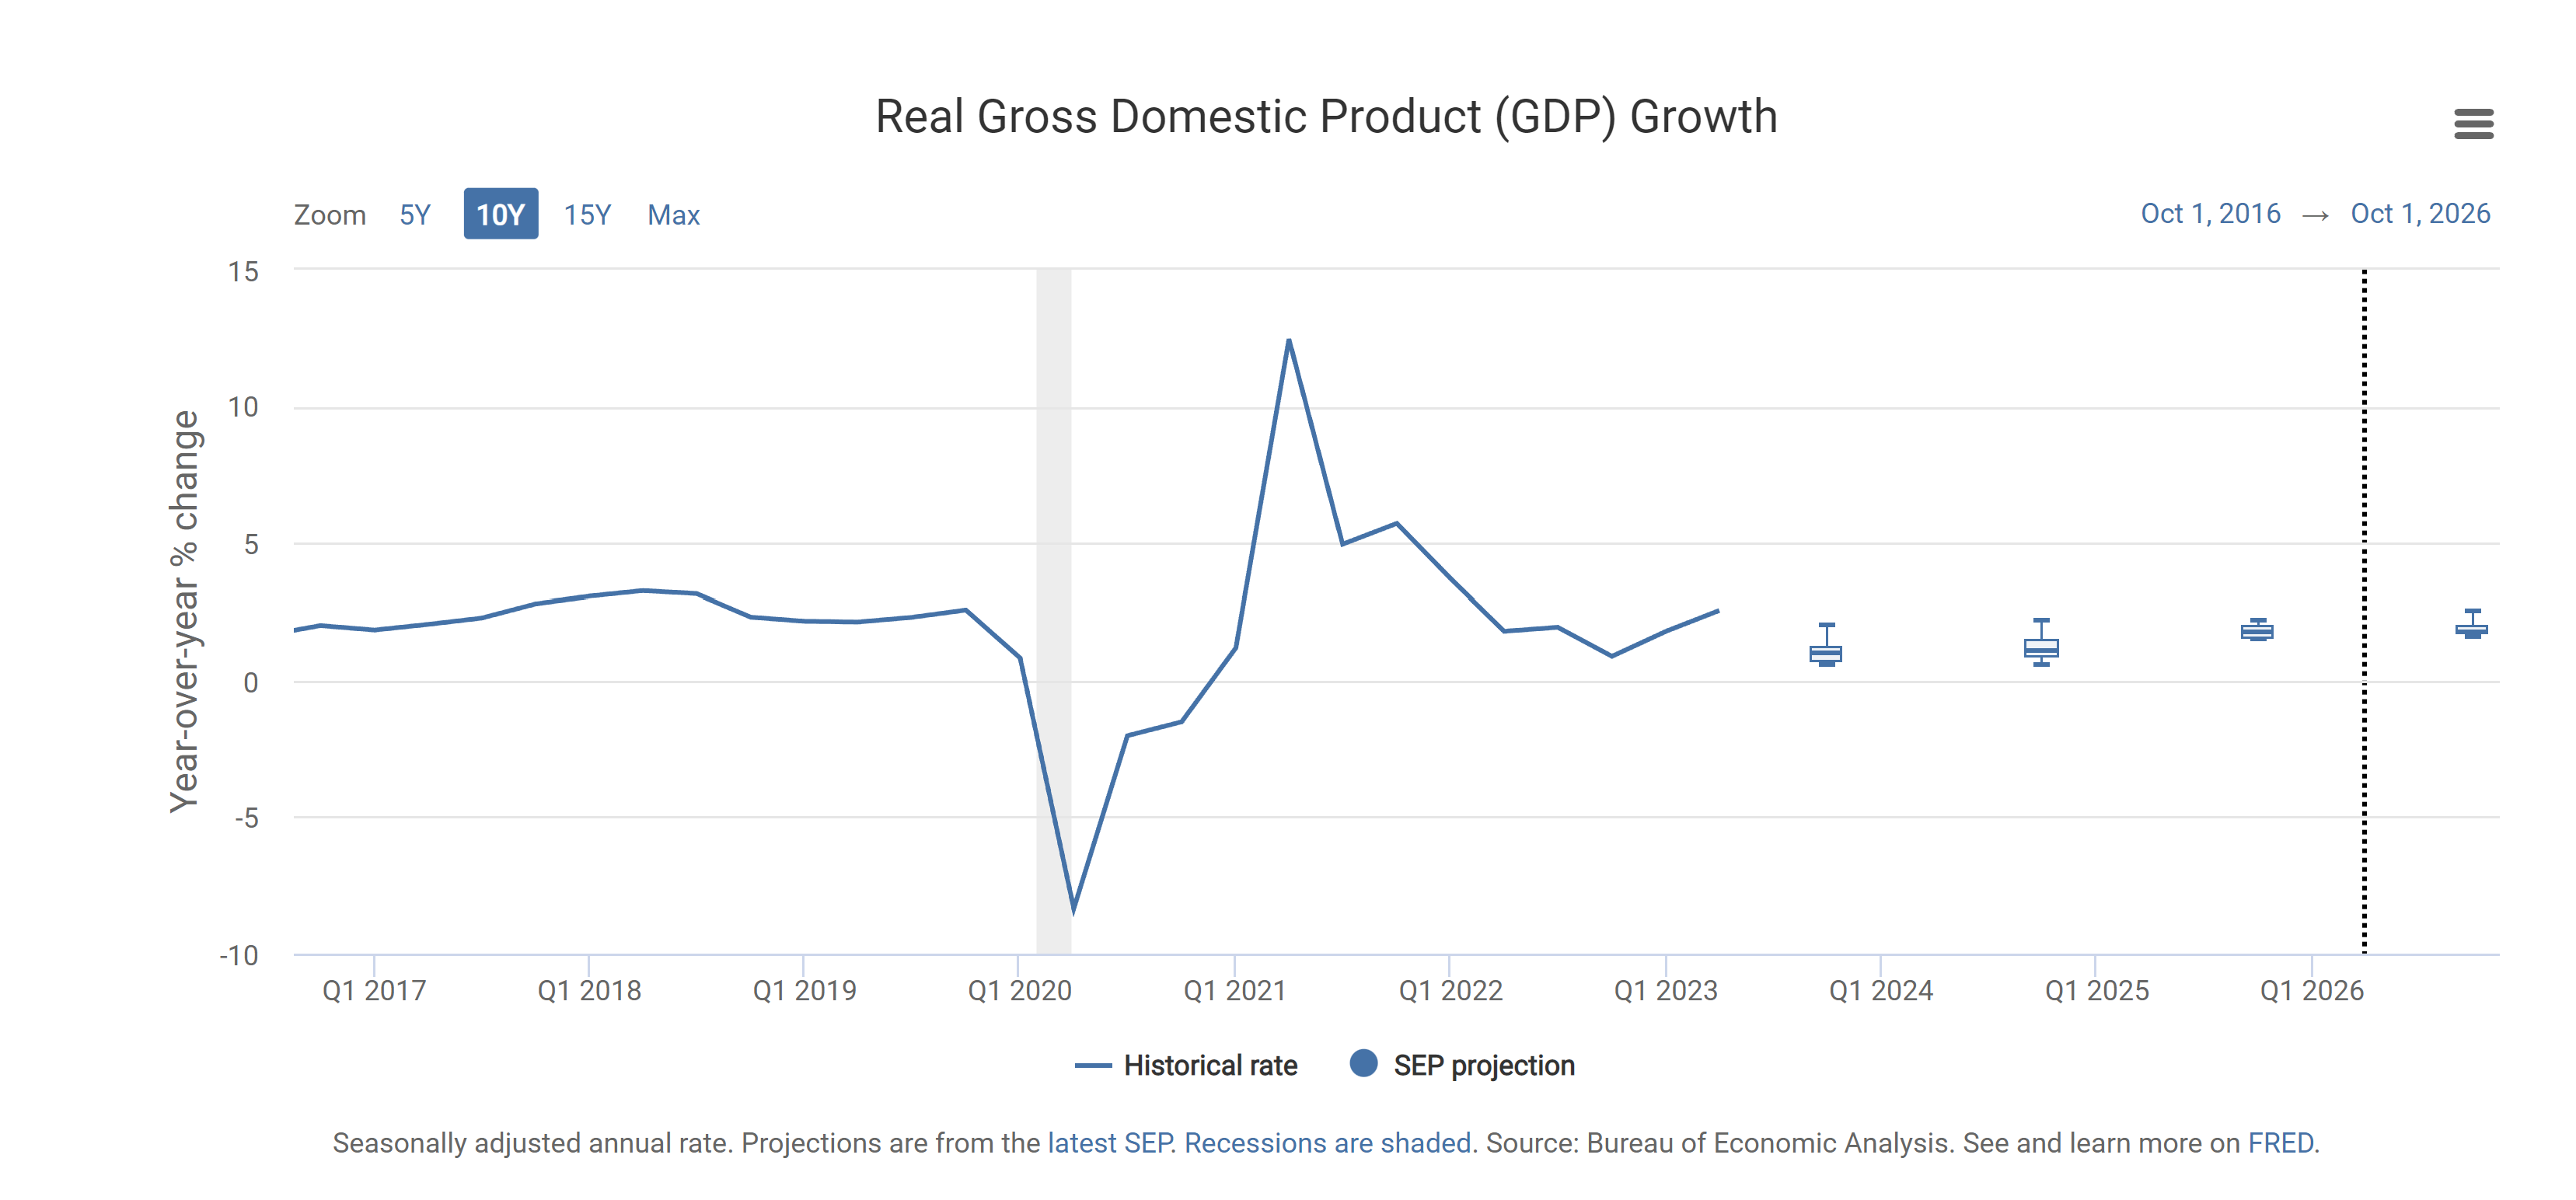
The United States inflationary pressures continue to ease as the Federal Reserve’s FOMC members continue to tighten monetary policy and as supply chains continue to improve; thus, these are the main vectors of lower inflationary pressures in consumer and producer inflation price statistics. Last week's PCE inflation and Gross Domestic Product data releases remain within the range of FOMC officials' projections, as can be seen in the next two charts.
Figure 1. Personal Consumption Expenditures (PCE) Inflation Projections by the FOMC.
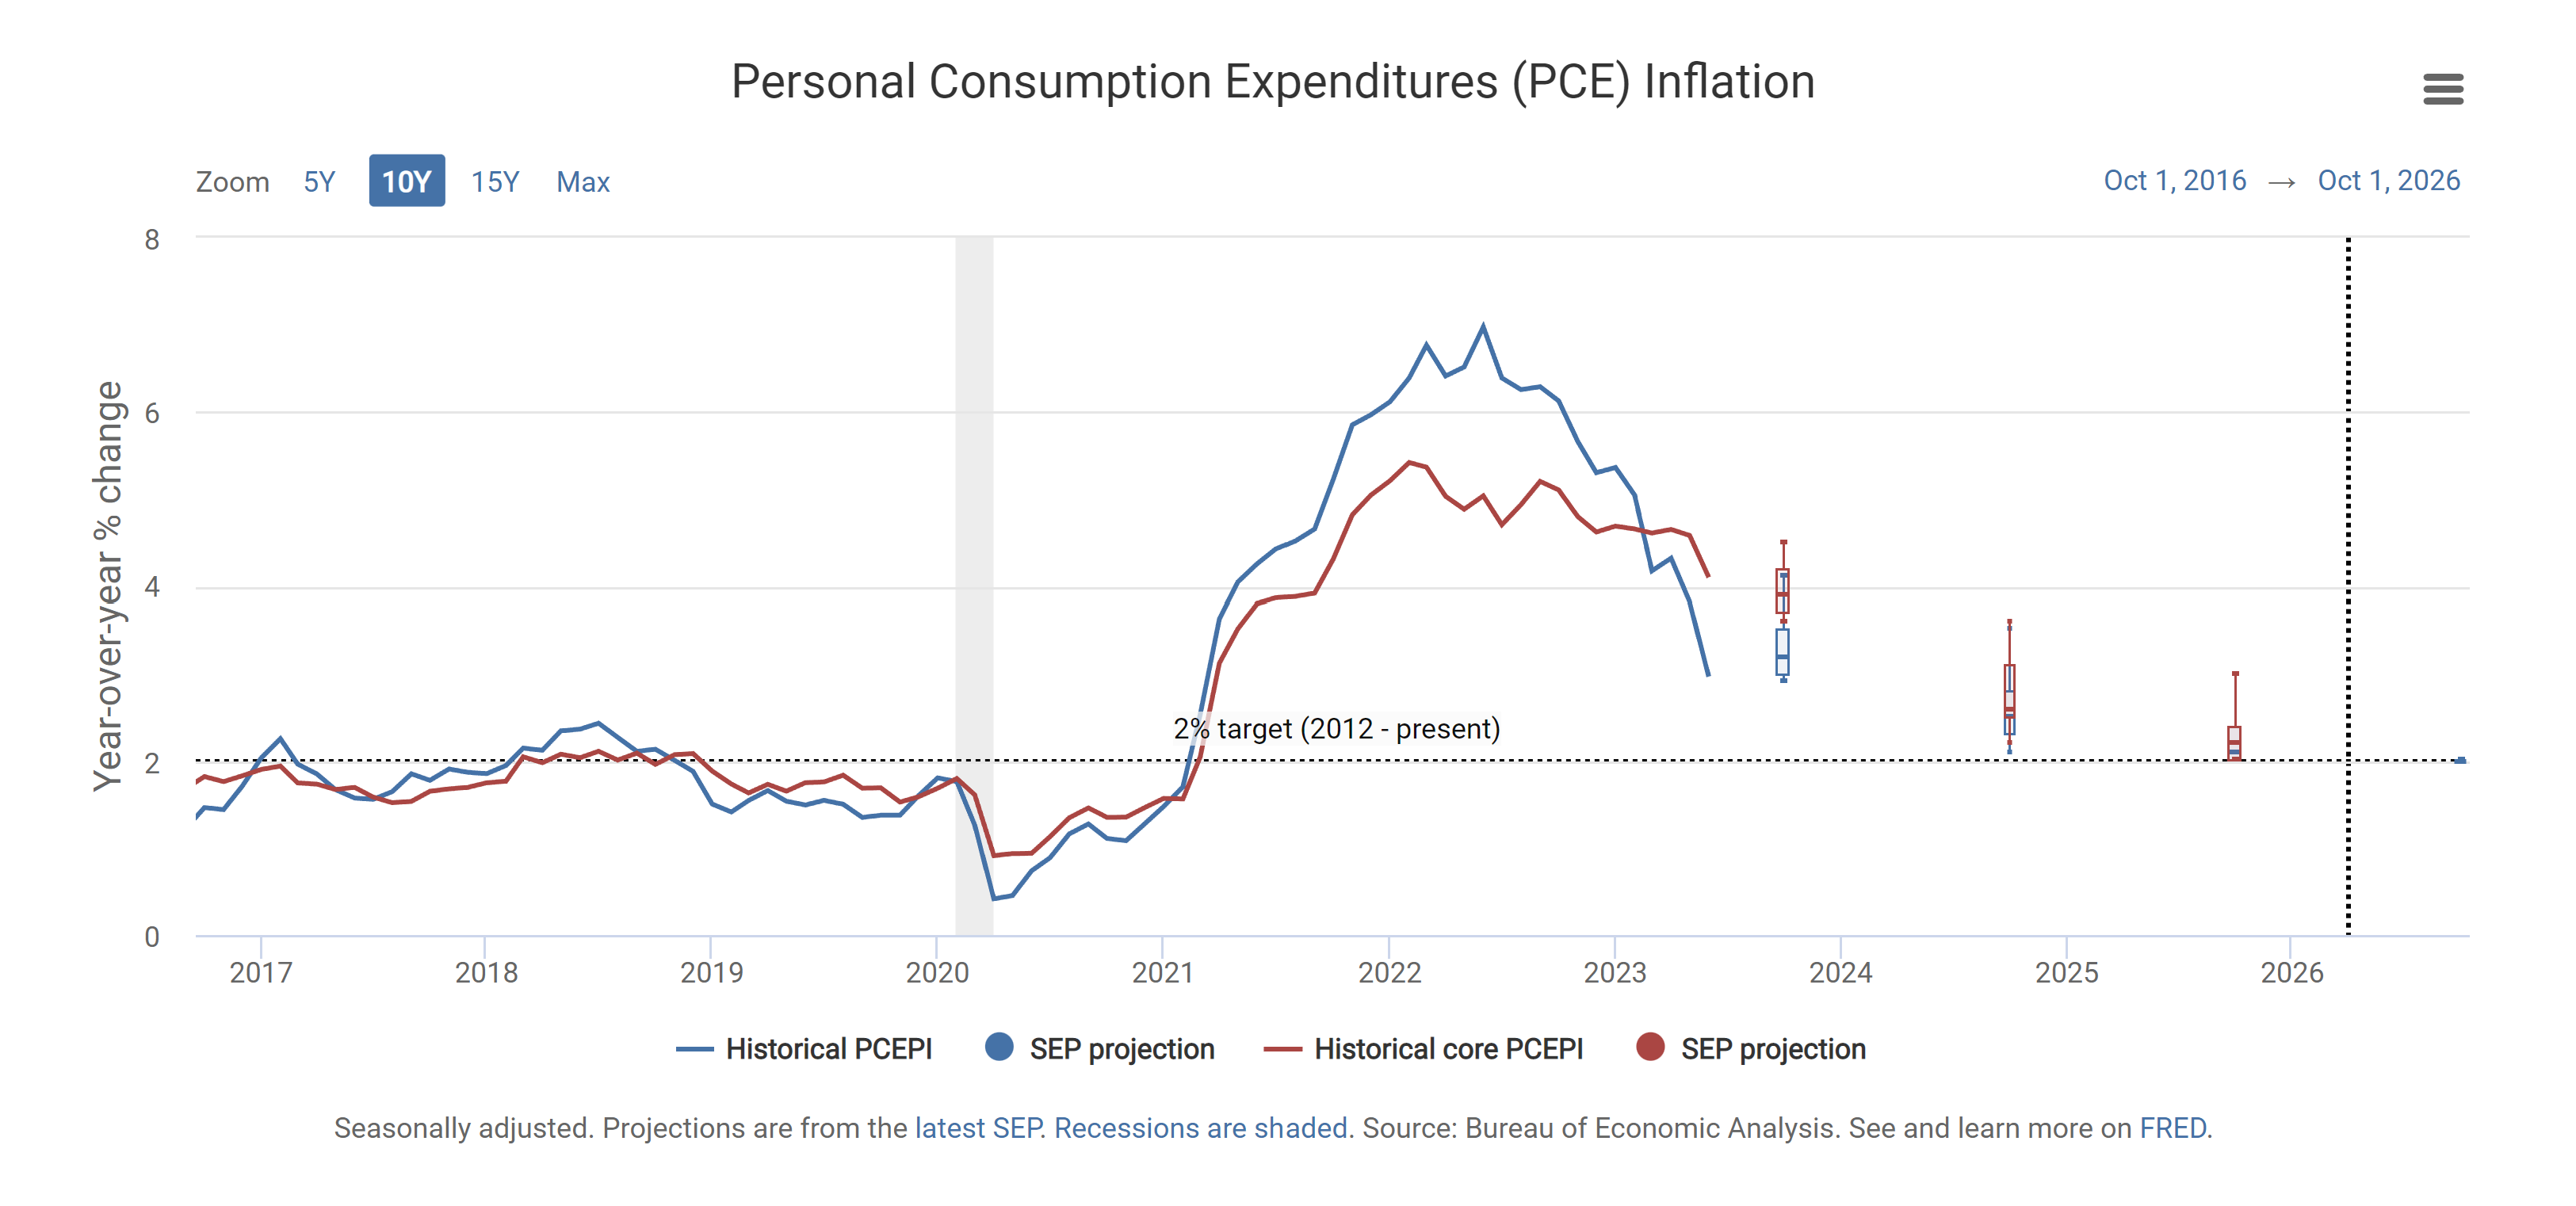
Figure 2. Real Gross Domestic Product (GDP) Growth Projections by the FOMC.
Lower inflationary pressures enhanced market valuations as consumers purchasing power increased due to less inflationary currency depreciation on a month-over-month and year-over-year basis. Also, given the reopening of the economy that is still being reflected in the strong United States’ Gross Domestic Product data, as shown in last week's data release, and in the performance of companies’ earnings and thus in market valuations, as reflected in the next chart, this is due to the fact that the consumer remains resilient, as reflected in the consumer spending statistics.
Figure 3. Deutsche Bank CROCI US Plus Index Total Return.
Market-driven devaluation of the dollar, given the previously mentioned factors, which the market echoed, still pressurizes the dollar, but recent data has made the Bloomberg Dollar Index stabilize above 100; that volatile price action in the dollar is still making global speculators shift further towards emerging markets, as is reflected in the next chart.
Figure 4. Ascent Broad Index.
 Left side of the chart index price levels. (USD) || Right side of the chart Volatility of the index. (Red line)")
As explained before, government measures were expected to generate an energy price disinflation effect that is currently under energy price reflation. The United States government has no alternative but to increase domestic production of energy sector commodities instead of reducing production and stop the use of the Strategic Petroleum Reserve, which has been and is currently being used to contain energy price pressures in the short-term without solving long-term issues.
Government operations with the Strategic Petroleum Reserve have temporarily reduced the effect of OPEC+ oil output cuts but are losing effect as the oil volume increases to levels that the United States government can't handle unless production increases in line with OPEC+ oil output cuts. The next two charts show the current United States energy sector commodity production and current and forward world liquid fuel consumption and production.
Figure 5. World liquid fuels consumption is expected to exceed world liquid fuels production by the end of the year. As mentioned before.

Figure 6. United States Oil and Natural Gas Production.

Given the fact that the United States government is doing the opposite, these factors are the main drivers of forward expectations and projections of world liquid fuel consumption exceeding production into year-end and into next year. Volatility-bear indexes of the energy sector remain the niche for those who want to hedge the current and forward supply-driven inflationary scenario. Cheers to the folks who took attention months ago when the forward expectations that are currently materializing were explained.
Figure 7. Brent Short Volatility III Sub Index 3.
 Left side of the chart index price levels. (USD) || Right side of the chart Volatility of the index. (Red line)")
These energy price pressures are supply-side, so monetary policy can't lower these supply-side inflationary pressures without causing demand destruction that could send the United States and consequently countries under reserve currency use into a recession. As explained before, the United States remains strong, with employment data improving at record levels and inflation trending in the expected and projected direction.
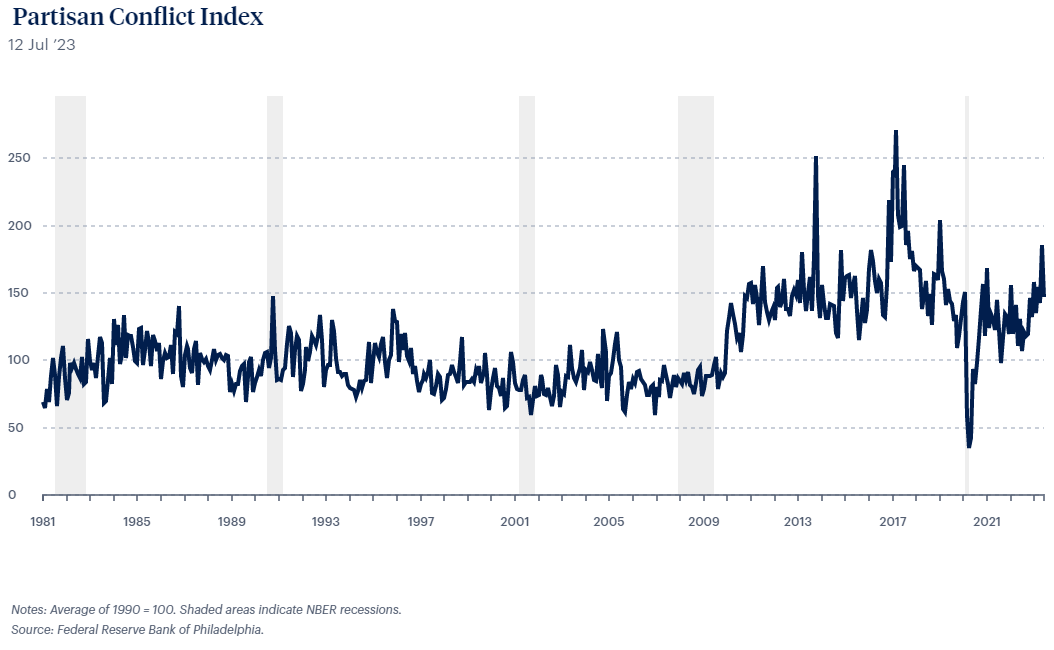
The improvements in the Federal Reserve Bank of Philadelphia's Partisan Conflict Index, as can be seen in the next chart, lowered those worries, but they still remain. As the government is not focusing on supply-side inflationary pressures that monetary policy can't lower, consumer recession expectations and recession probabilities have decreased from previously reported probabilities.
Figure 8. Partisan Conflict Index.
The soft-landing path remains stable, although the previously explained more than plausible monetary policy overreaction ( Volcker-like event ) to forward energy price-reflation is what sets at risk the soft-landing path. As it could cause demand destruction that could send the United States and consequently the countries under the reserve currency use into recession. Which is the previously mentioned black swan event that markets should be attentive to. The next two charts show the CFTC market’s largest participants positioning statistics in Nasdaq 100 E-mini futures and S&P 500 E-mini futures.
Figure 9. CFTC Statistics over the Largest 8 or Less Traders Positioning in Nasdaq 100 E-Mini Futures.
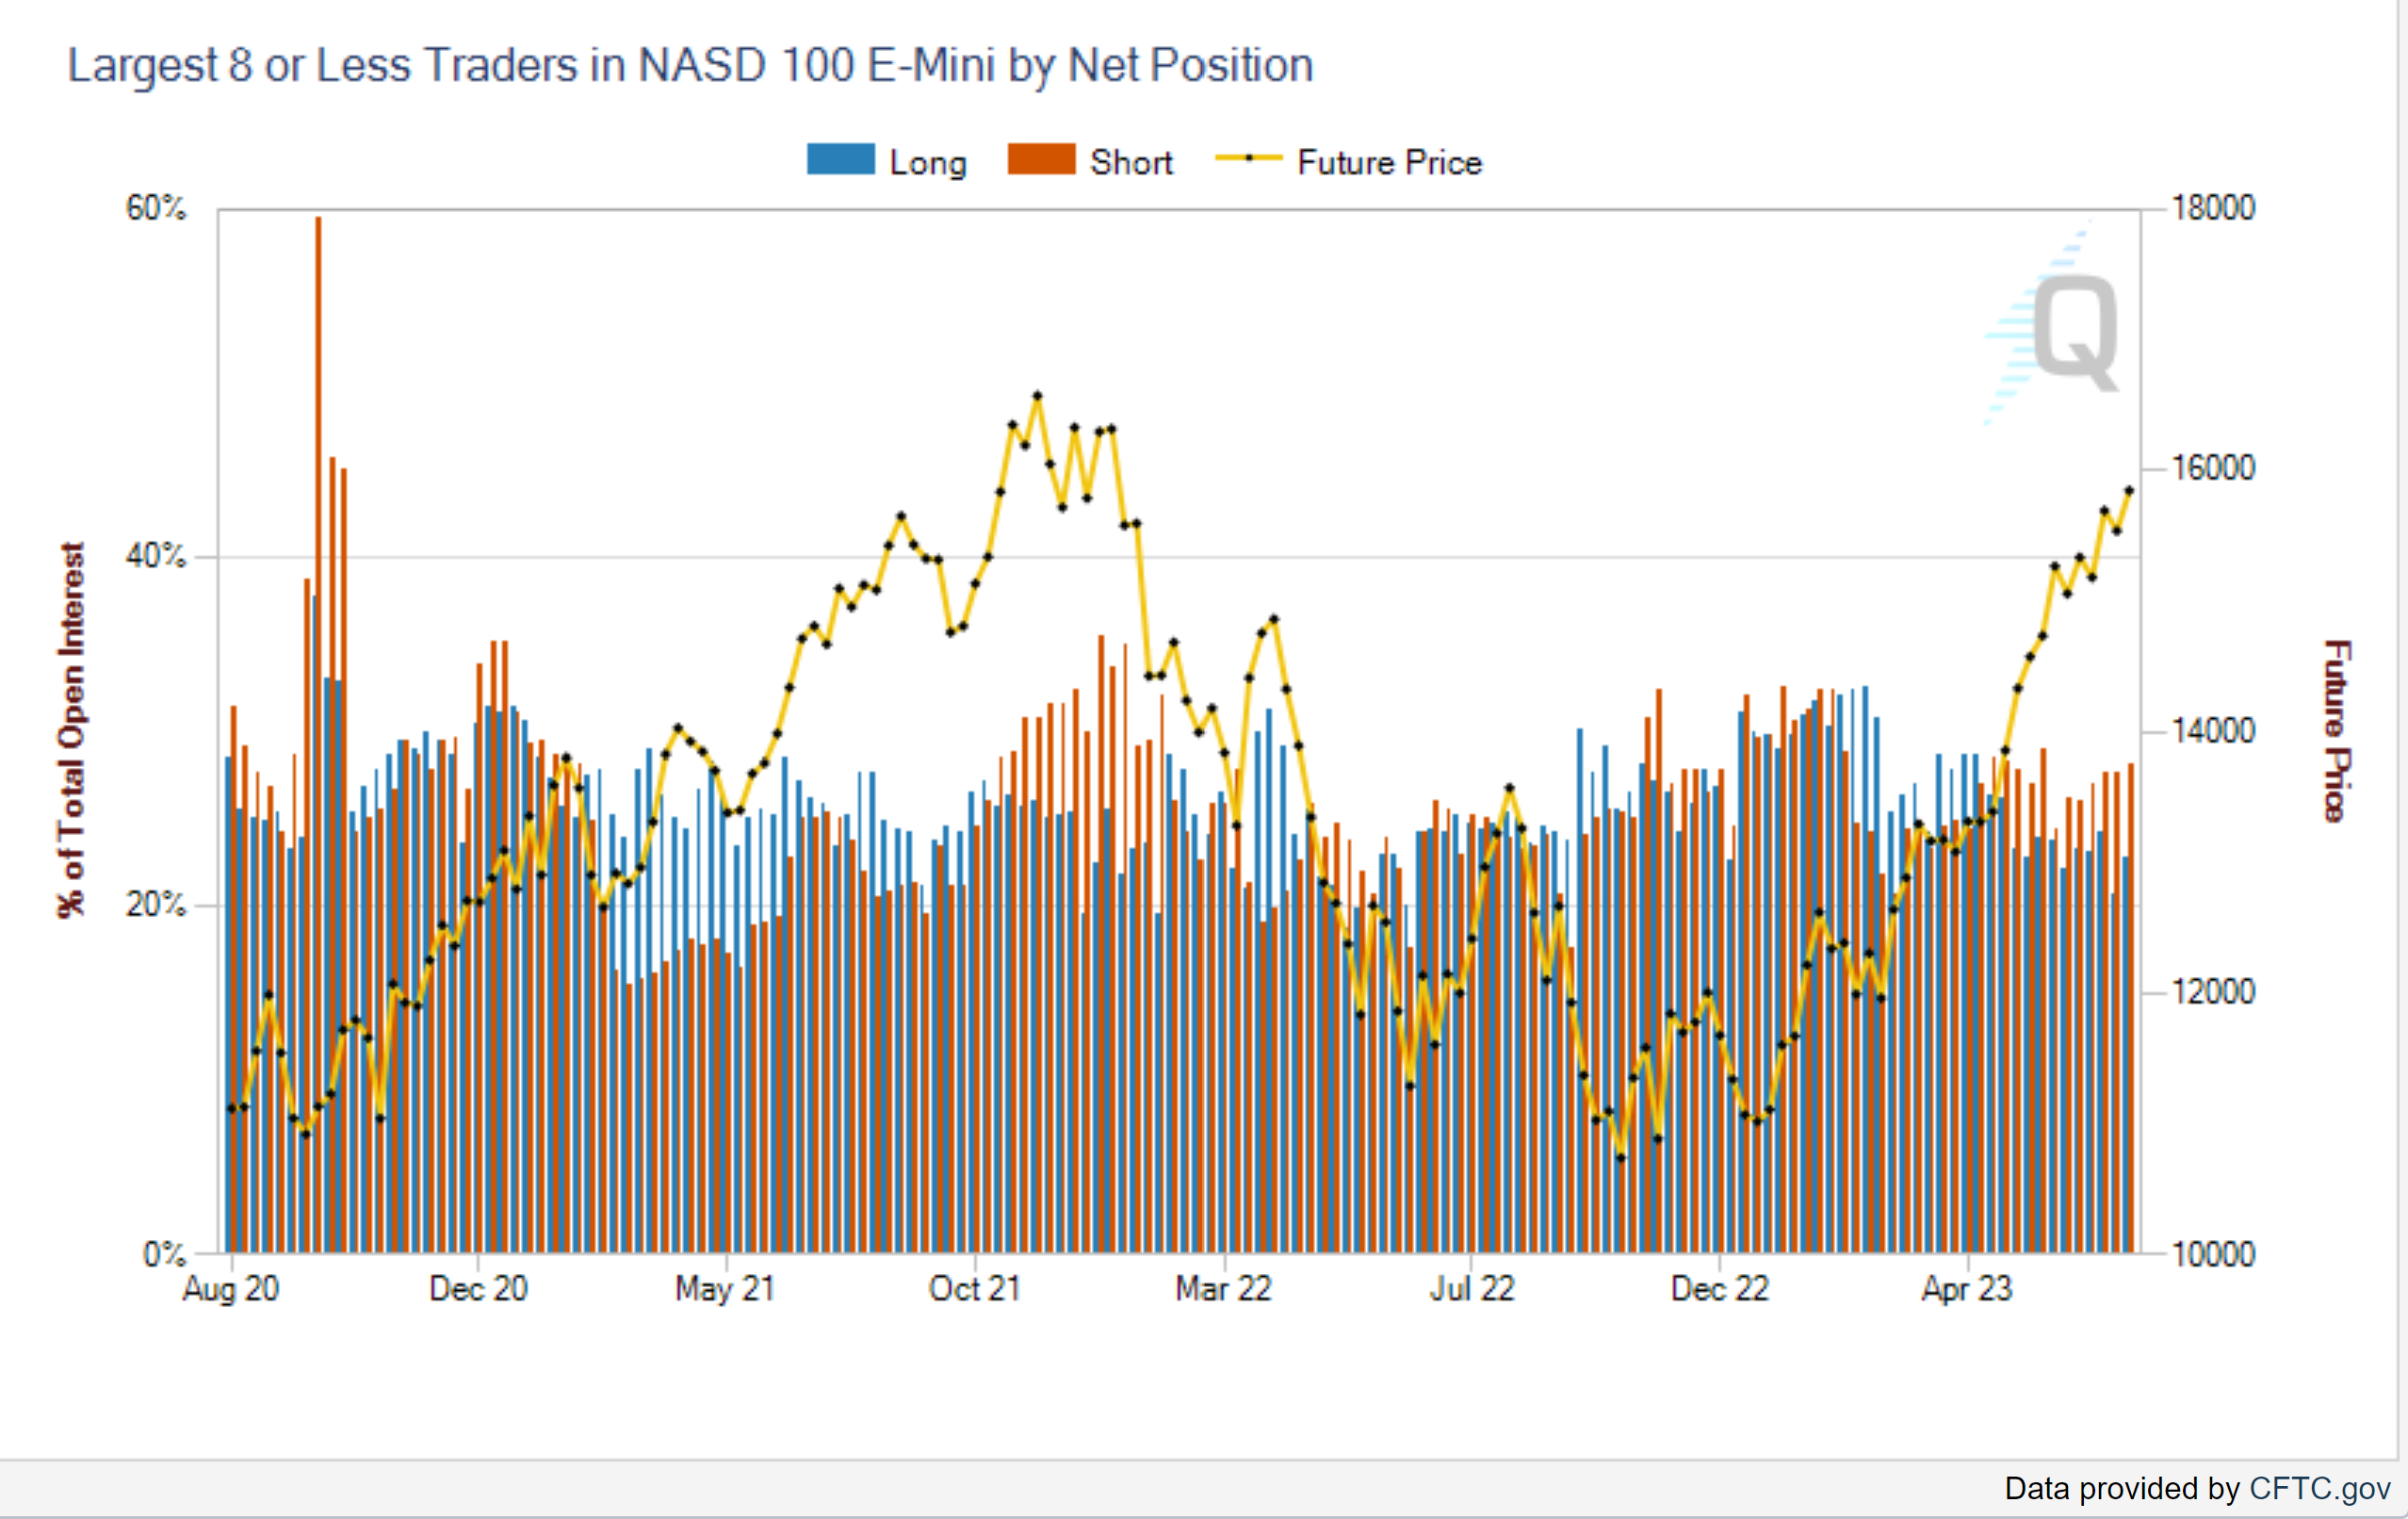
Figure 10. CFTC Statistics over the Largest 8 or Less Traders Positioning in S&P 500 E-mini Futures.
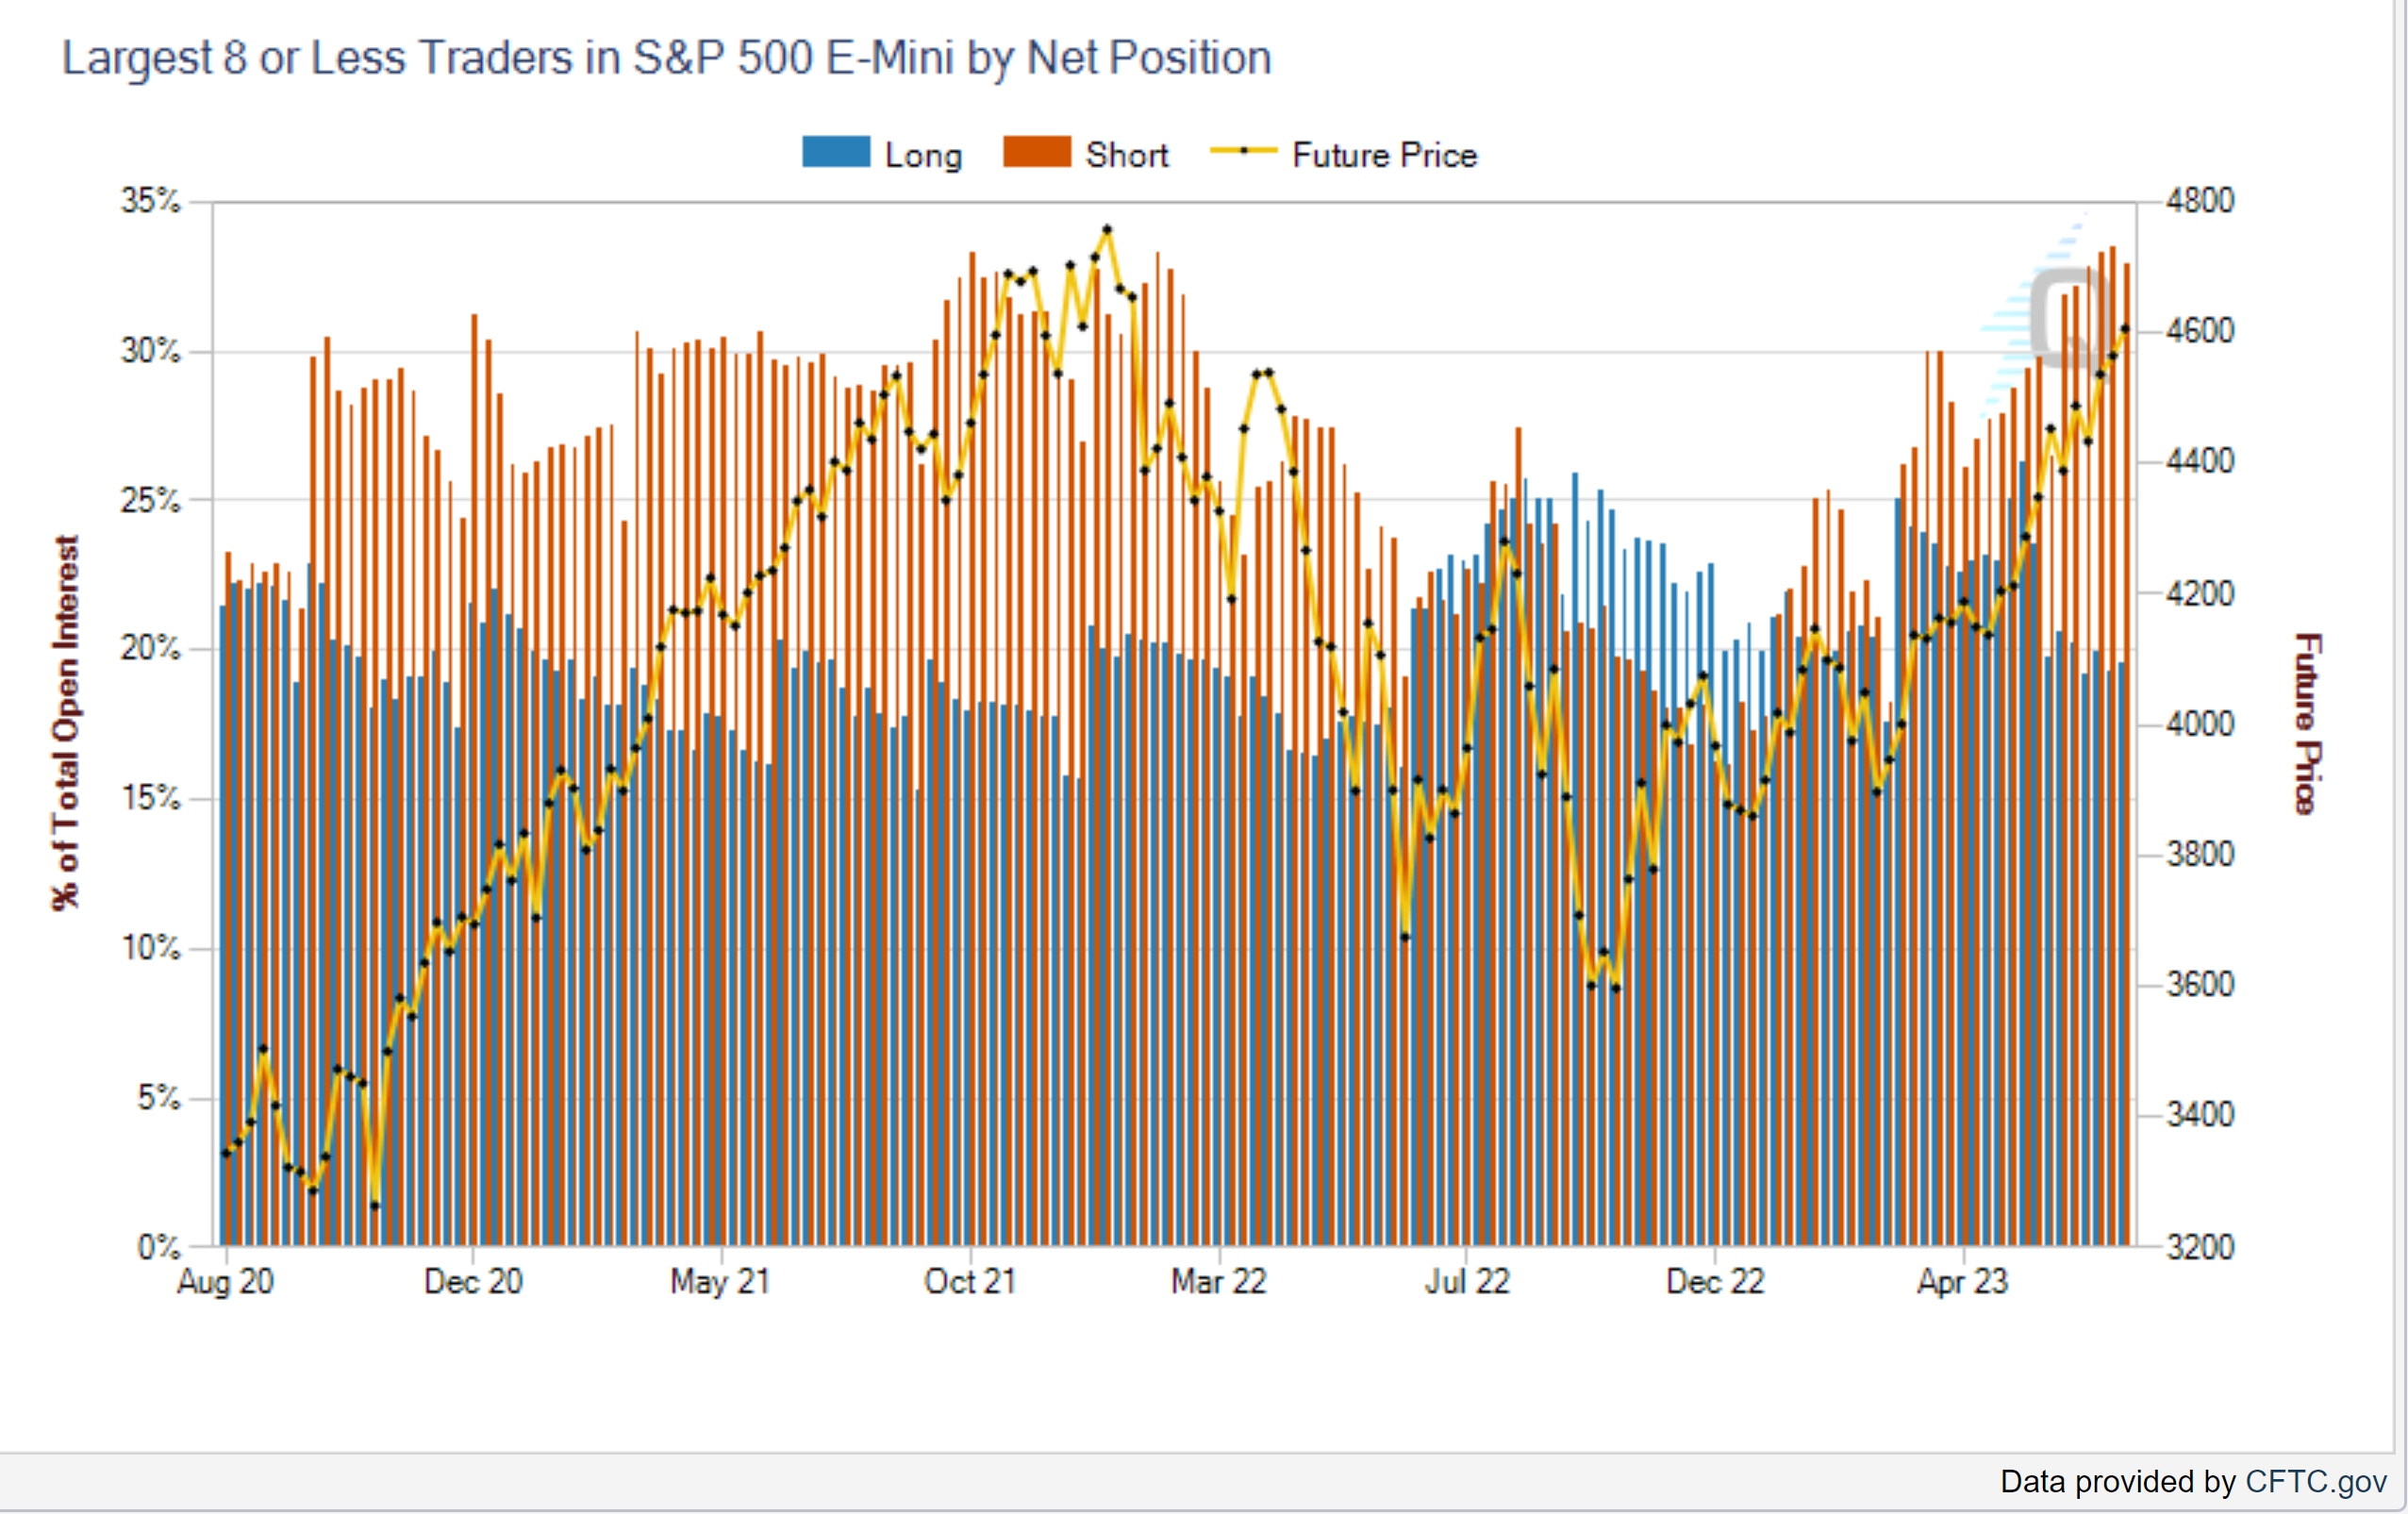
Markets have been under a so-called term short-squeeze; the last two charts prove it; the previous two charts show that large market participants are positioning bearish on S&P 500 and Nasdaq 100 CME futures as markets rise, reaching March 2022's percentage of total open interest in S&P 500 positioning. As shown before with a hilarious meme Volatility bears are the only winners in the current market. Dynamic allocation volatility control indexes remain the winners in the current market, as shown before and reflected in the next chart.
Figure 11. Deutsche Bank CROCI US 5% Vol. Control Index.
 Left side of the chart index price levels. (USD) || Right side of the chart Volatility of the index. (Red line)")
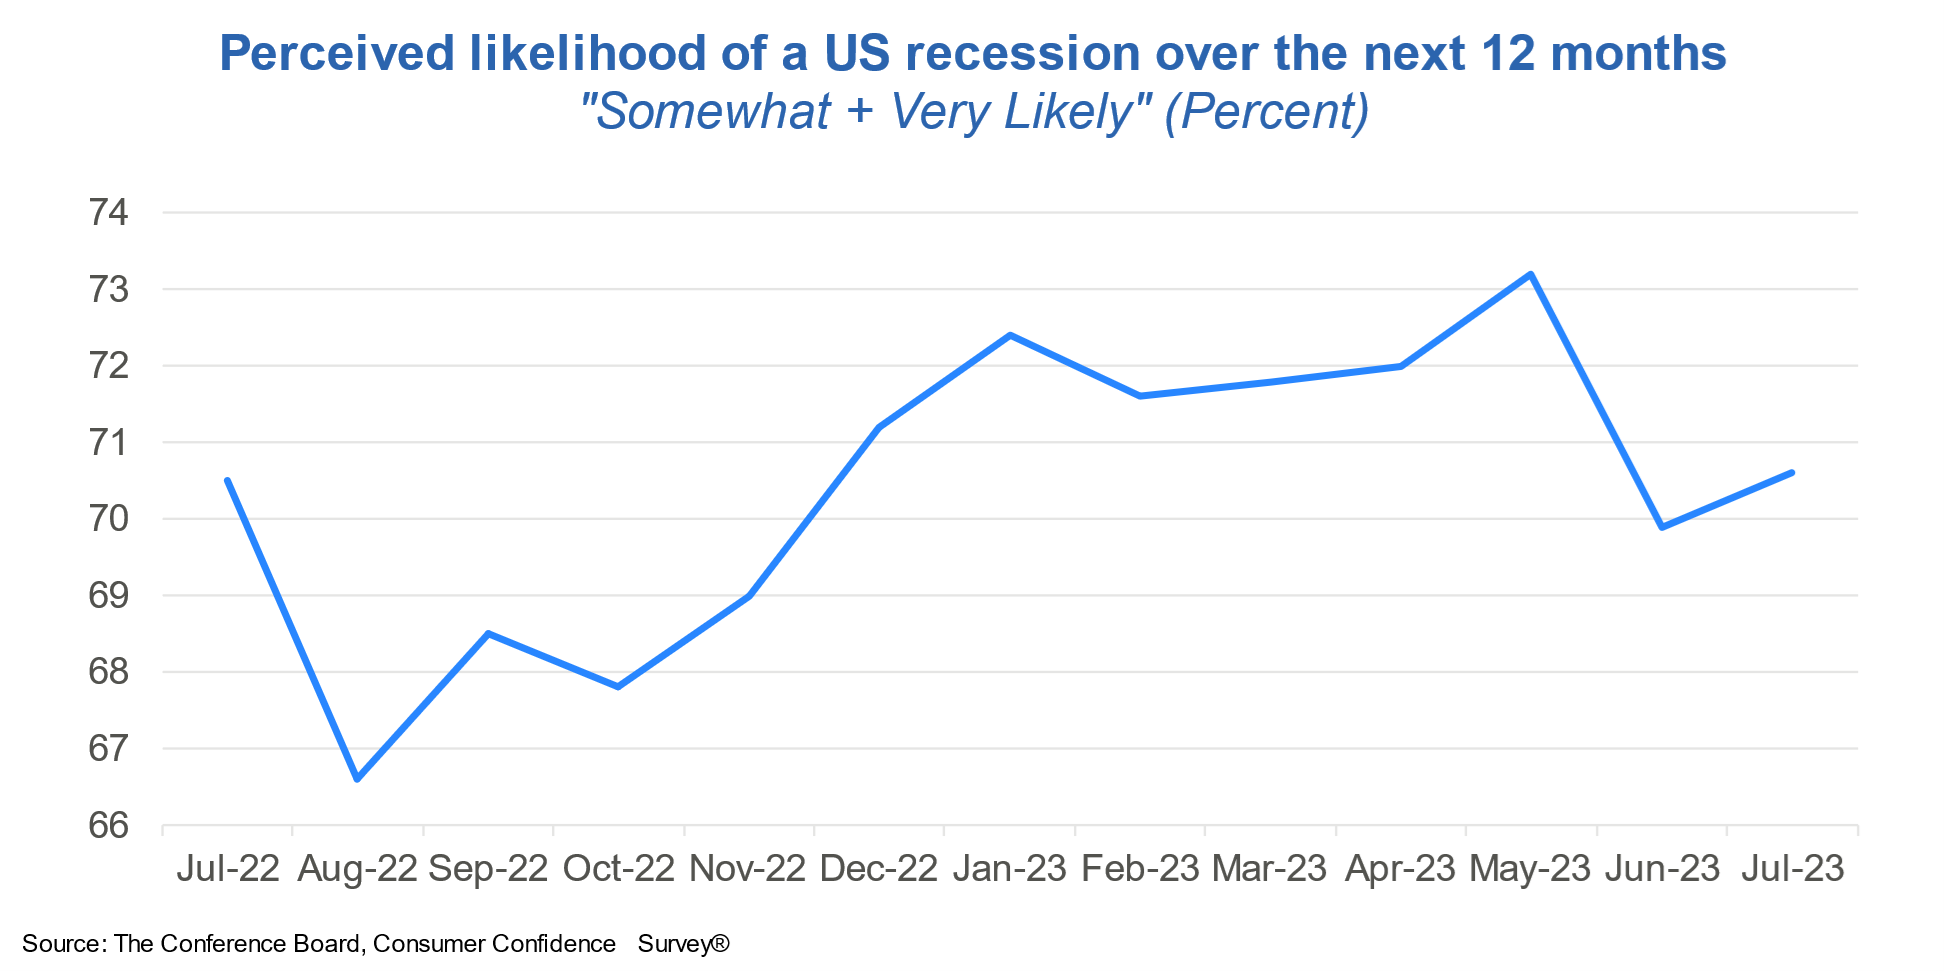
The United States Gross Domestic Product data and consumer confidence remain strong; in fact, consumer confidence has reached a two-year high, although consumer recession expectations upticked, as can be seen in the next two charts.
Figure 12. United States Gross Domestic Product (GDP).
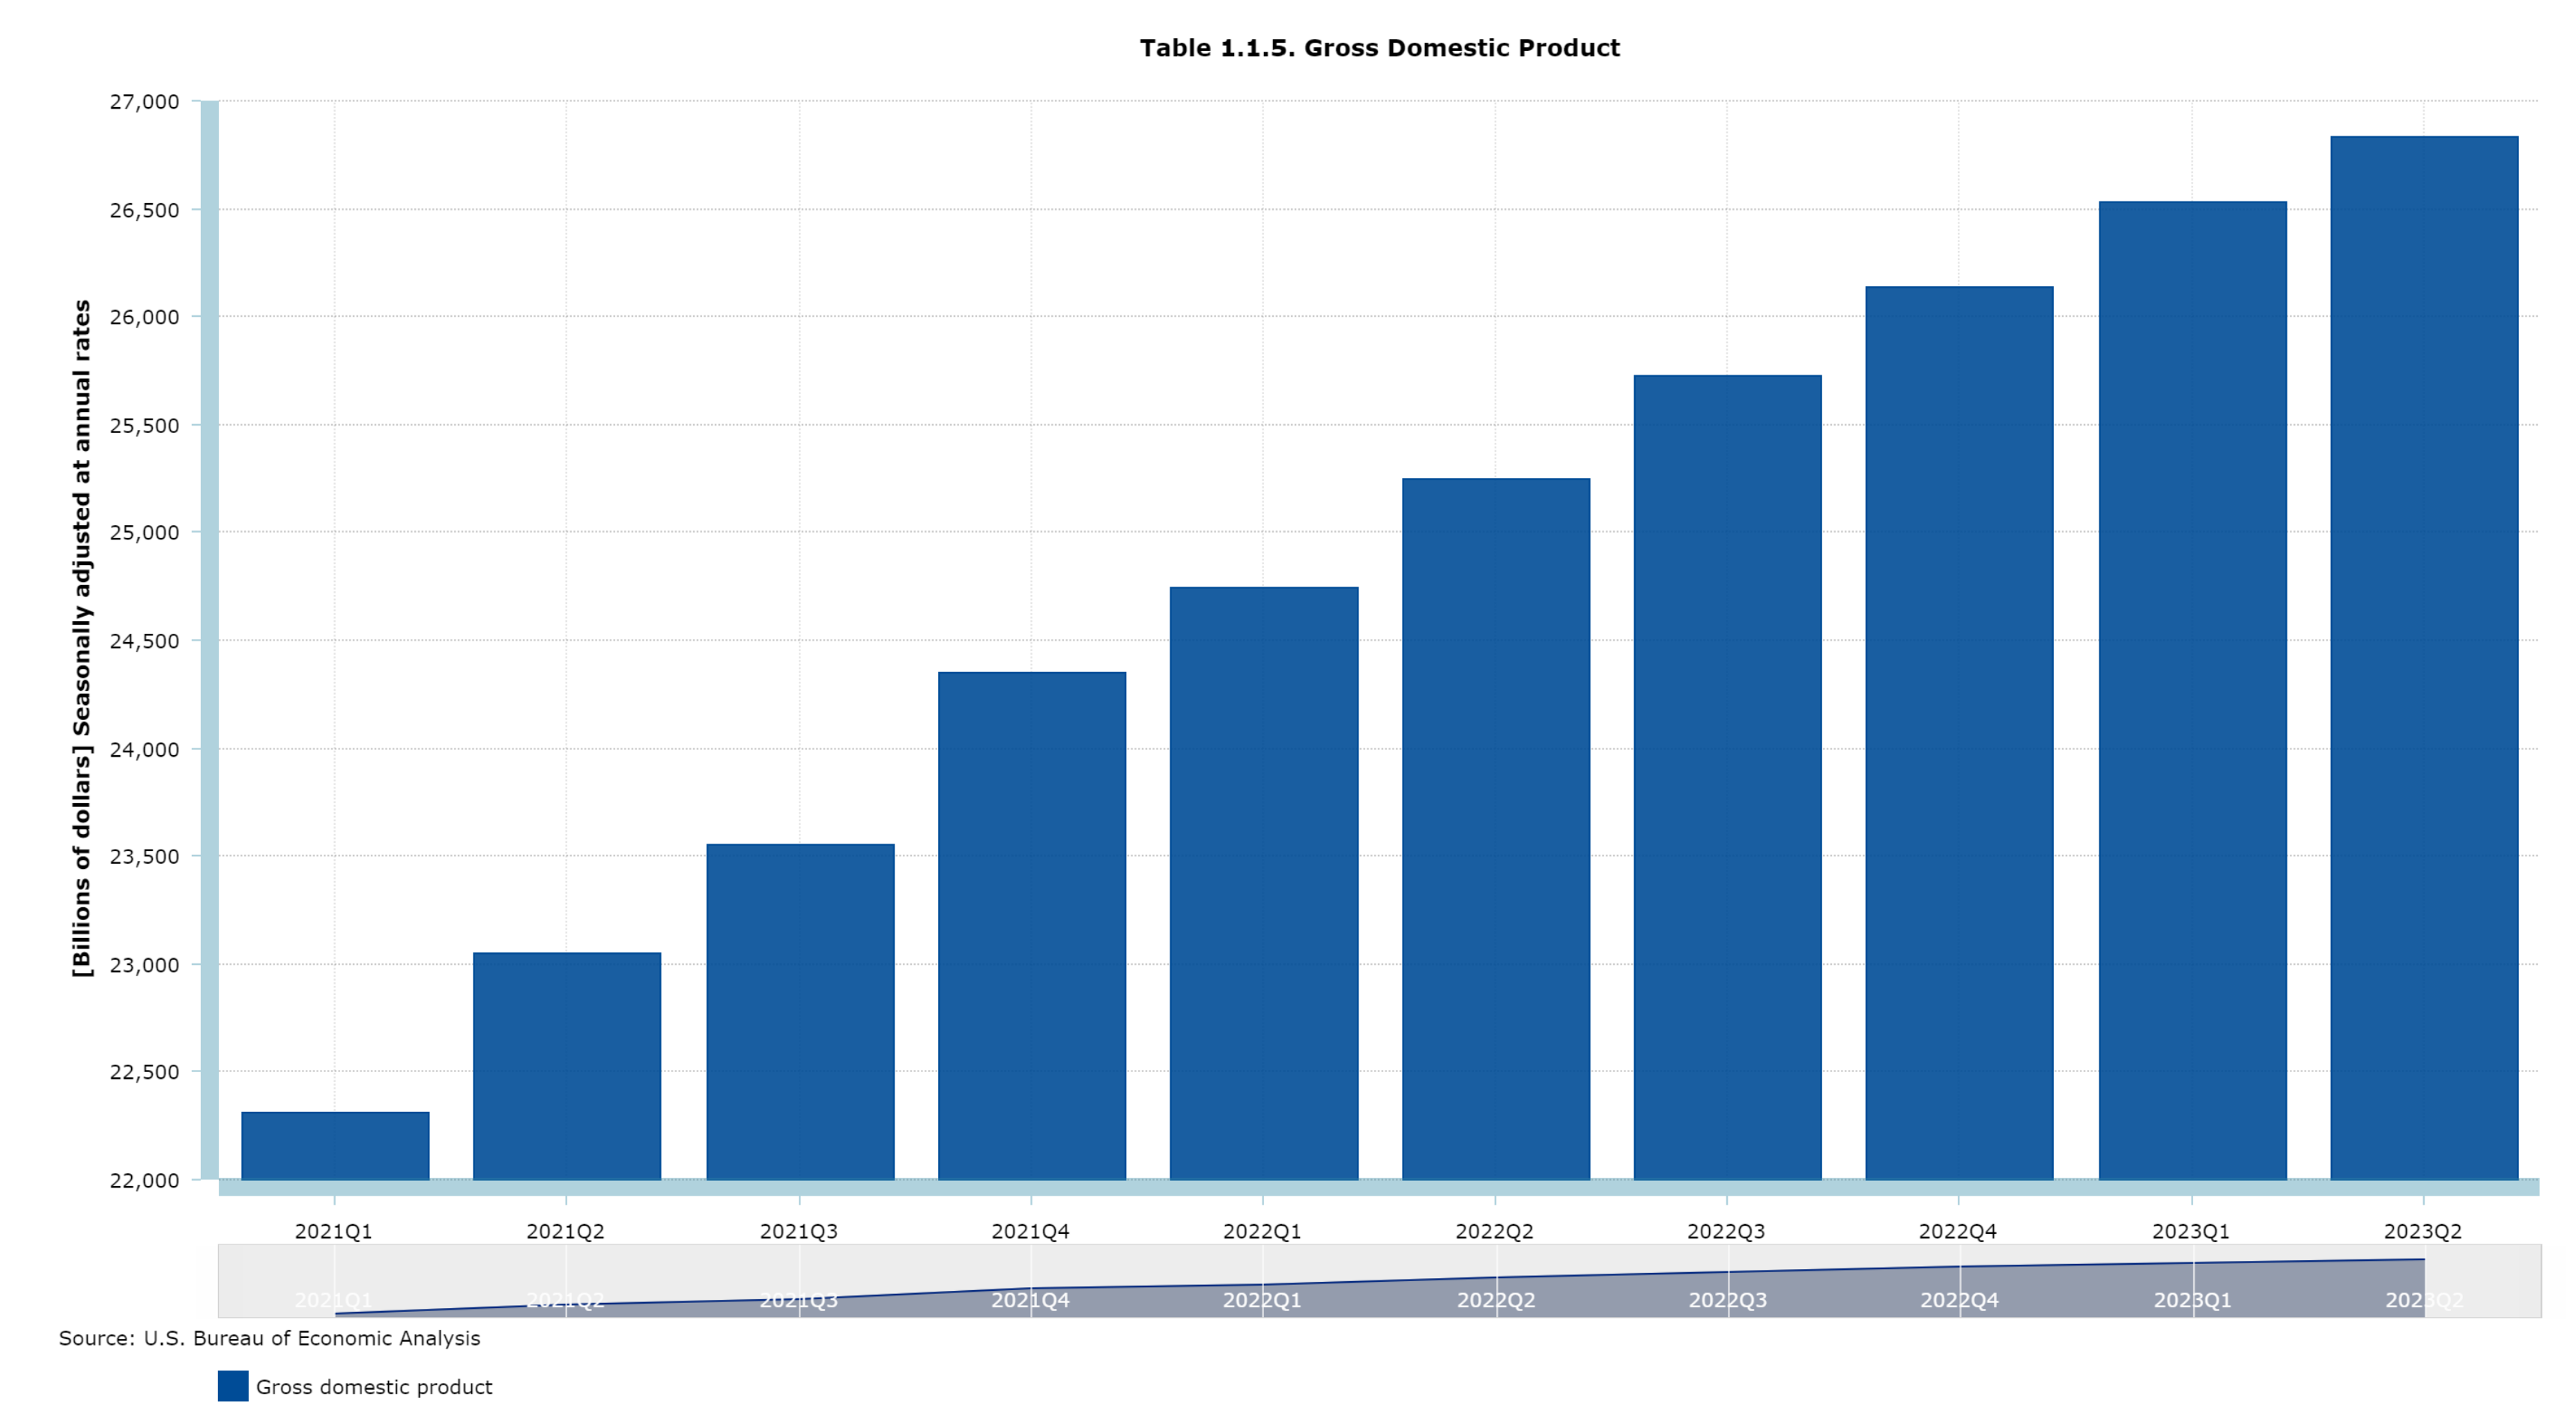
Figure 13. Consumers’ recession fears upticked in July 2023.
Forward and current supply-driven inflationary pressures remain a concern; the previously mentioned supply-driven price action in grain commodities, given warfare and extreme climate conditions, is also contributing to the limited supply of these agricultural sector commodities on the market, although grain production is expected to remain high in the United States. The next chart shows FAO "Cereal Production, Utilization, and Stocks" statistics and forecast.
Figure 14. Cereal Production, Utilization, and Stocks statistics per FAO.
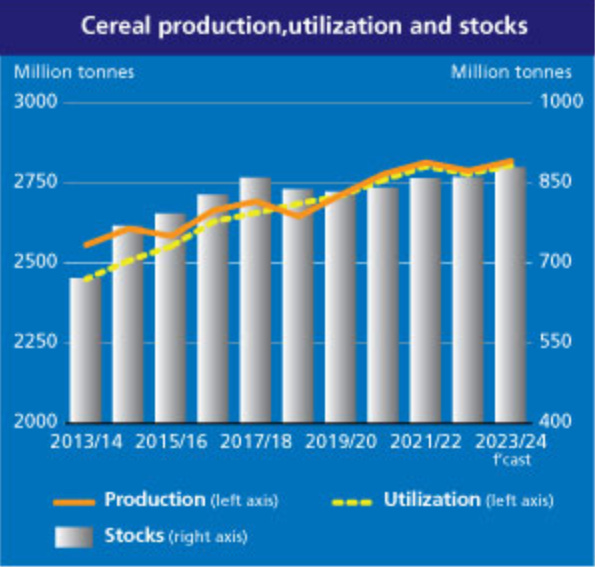
These factors are reflected in the recent performance of agriculture sector commodities, and these grain supply-side inflationary pressures are expected to continue this trend until supply matches demand earlier into next year; when grain output from production matches grain demand, this is expected to happen with grain supply, not rice supply ( chart ).
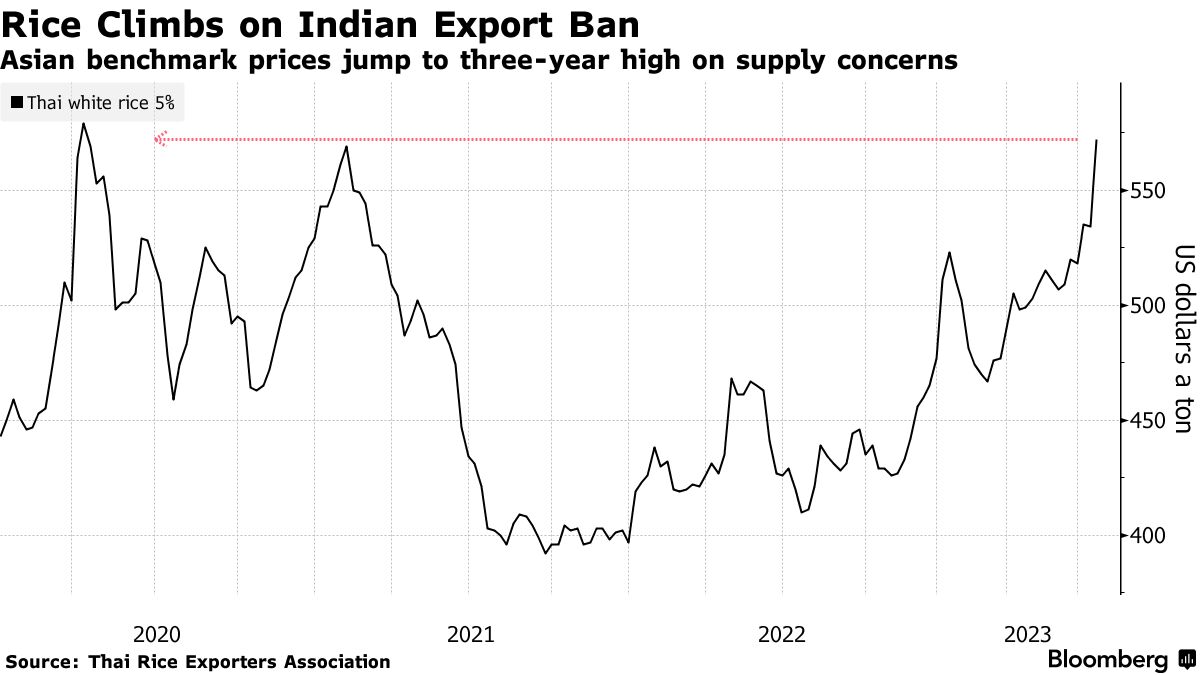
The rice supply situation is similar to the grain supply situation; both non-developed and developed countries source their supply from the cheapest producer, which generates instability by centralizing supply. Rice supply curbs will more than likely cause concerns for FAO into 2024, like the grain supply curbs did in 2022, but they will be more drastic given the higher percentage that the centralized rice supply represents.
These supply-driven price pressures in grains are expected to be reflected in forward food inflation data. For the folks that want to hedge these temporary supply-driven price pressures until supply and demand of these commodities stabilize, there is an agriculture sector commodities index to do so.
Figure 15. Diversified Agriculture Index TR
 Left side of the chart index price levels. (USD) || Right side of the chart Volatility of the index. (Red line)")
Geopolitical tensions remain high; the world is phasing slower than expected but phasing towards World War from the current Second Cold War that the world is currently experiencing; the current geopolitical tensions remain nearly at the same levels as previously reported; probabilities have lowered but remain at dangerous levels; vector probabilities remain the same.
Taiwan still remains an Achilles heel for the West, given Taiwan's semiconductor supply-chain centralization by the West; initiatives by Europe and the United States have reduced semiconductor supply-chain disruption risks in the long run for the West, although these supply-chain disruption risks remain in the near-term as semiconductor supply dependence of the West has not changed much in the near-term but rather shifts are in the long term.
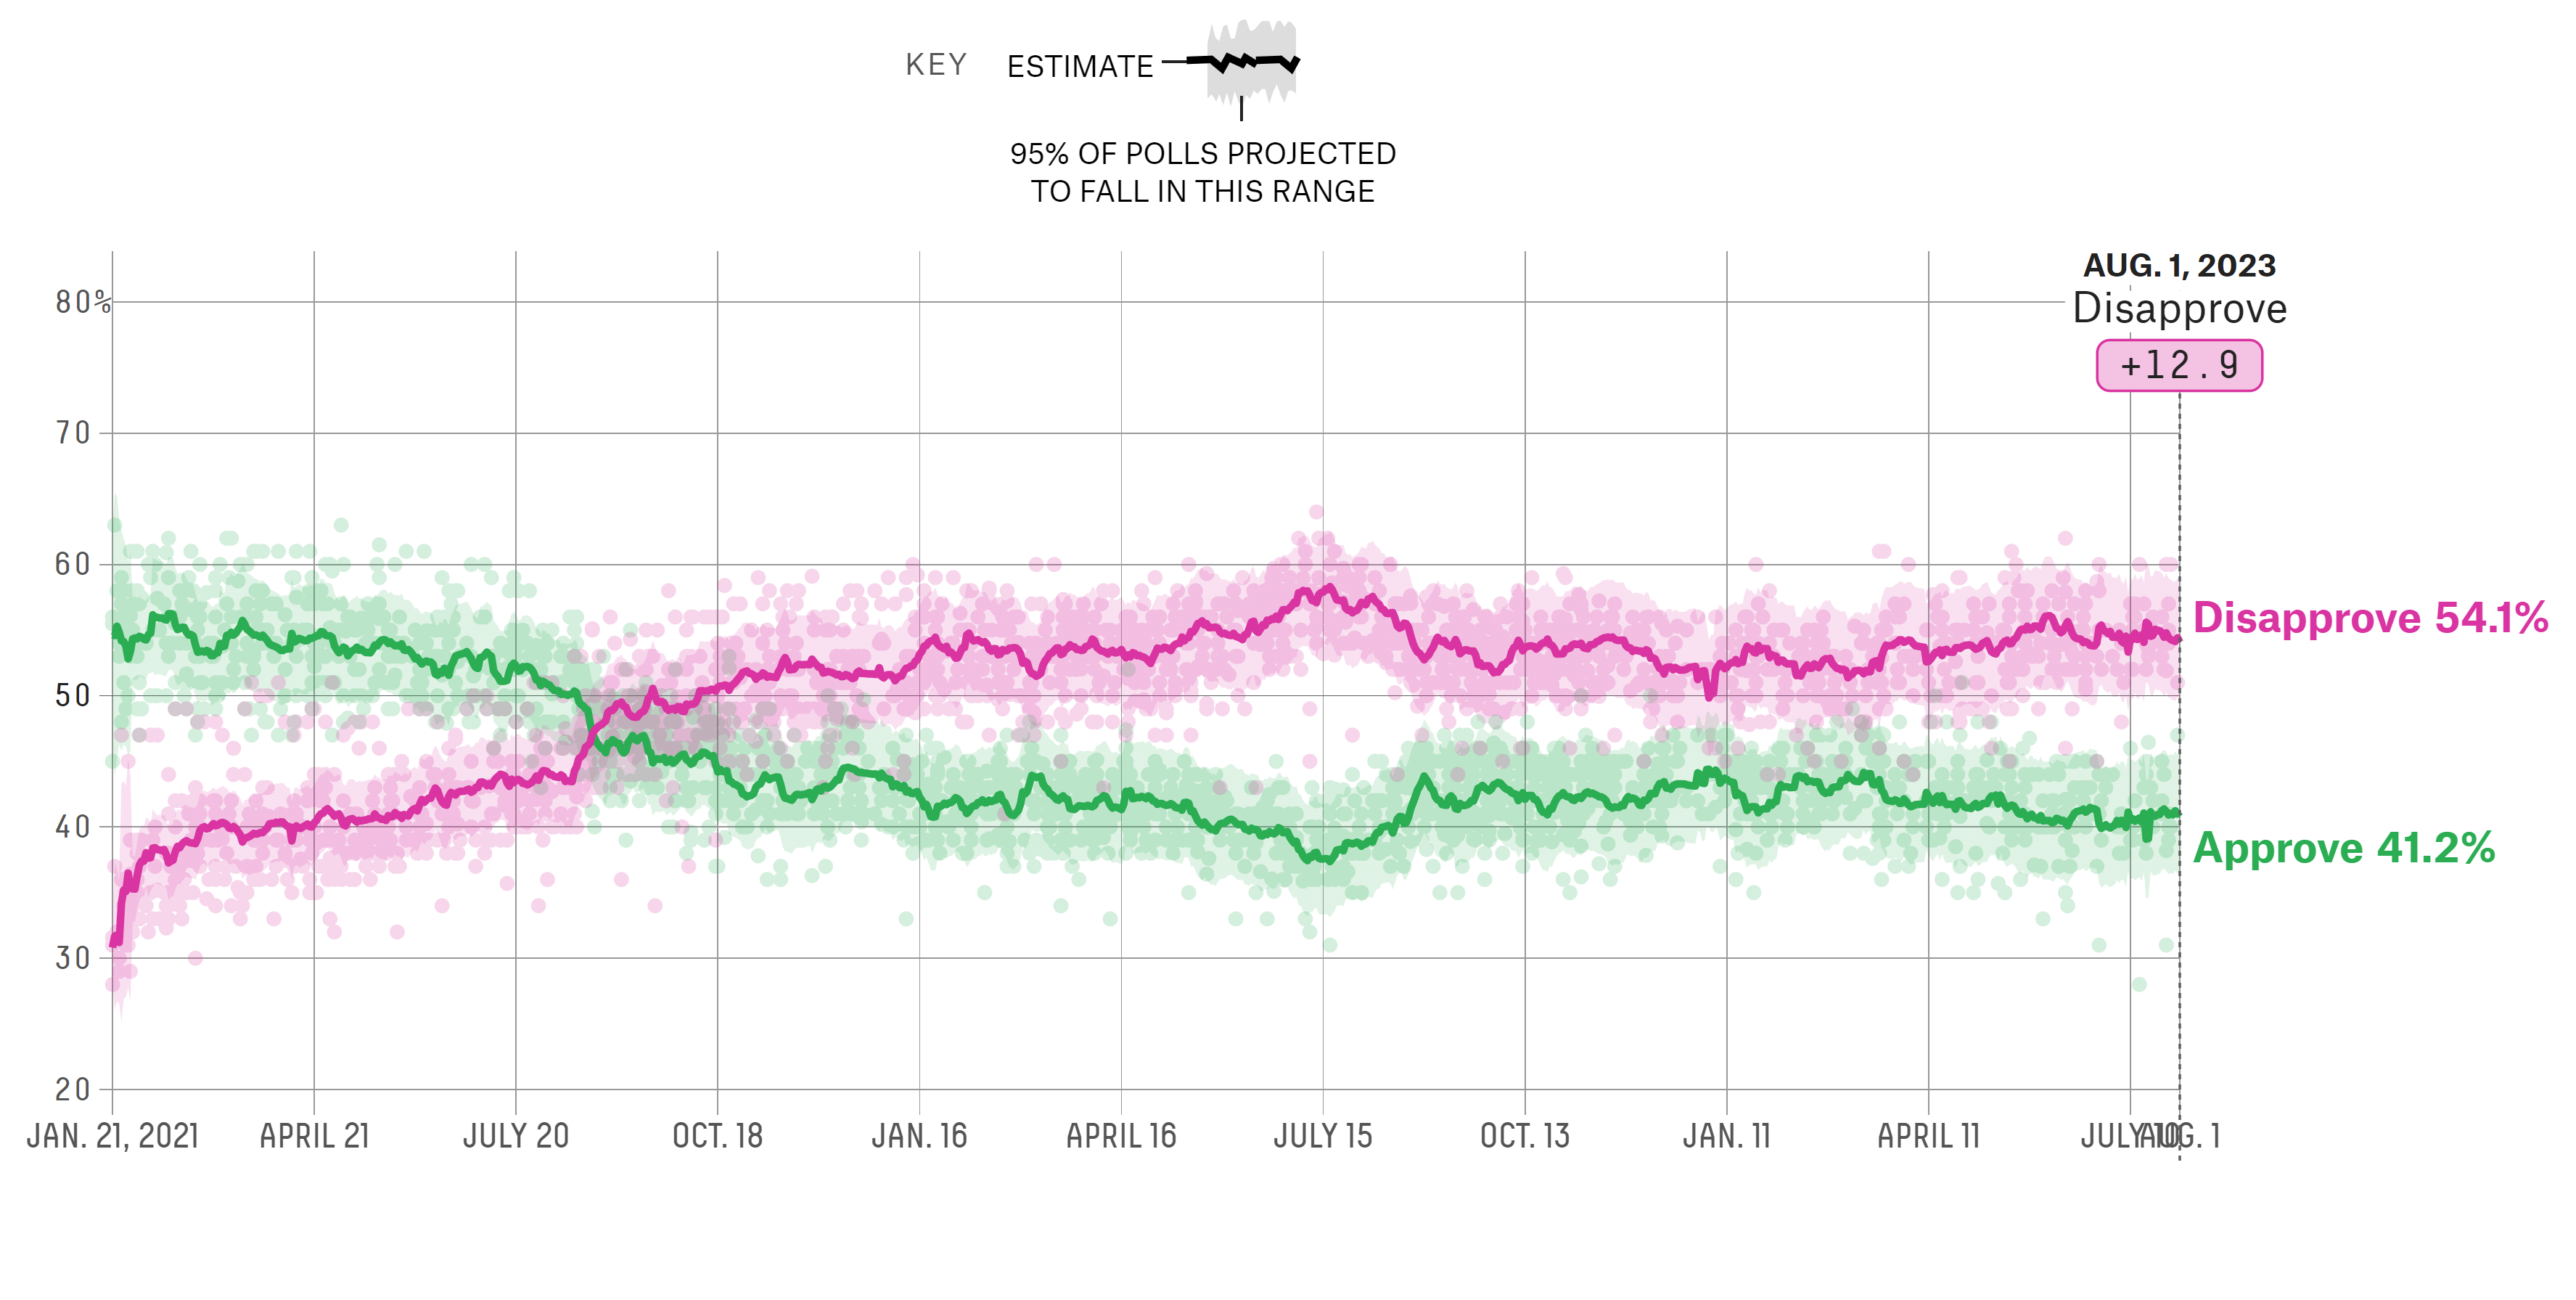
The political situation in the United States remains nearly unchanged, and President Joe Biden's approval rating has shifted upward as the economy improves. Recent reports suggest that American voters from both sides (Republicans and Democrats) agree on the United States main threats; this data is in line with the current geopolitical tensions.
Figure 16. President Joe Biden's Approval and Disapproval Rating Statistics.
The United States' government's measures towards approaching the Taiwan dilema suggest that the government should actually take more direct military or diplomatic decisions when it comes to addressing China's regional interests instead of stating one thing about Taiwan and doing the other, because China remains focused on the Taiwan dilema and China's demonstration of power in the region increases.
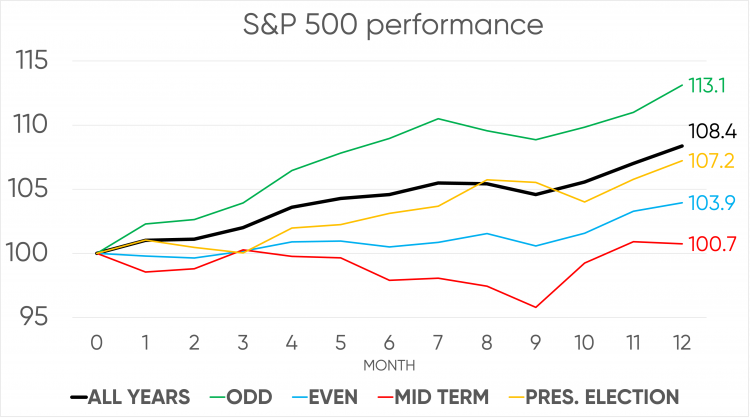
Market seasonality over the forward elections in 2024 is expected to remain the same, and confrontation between politicians in the United States remains constant, which is bad. As explained before, a thing that politicians must never forget is that the United States was founded on union; unity is what made the United States what it is now, and they should respect that. No matter which administration is in power, the current scenario requires unity rather than confrontation, given the forward geopolitical events that require unity.
Figure 17. S&P 500 Performance in Odd, Even, Mid-Term, and Presidential Elections.
To summarize everything, the United States economy is strong but under pressure due to current and forward supply-side inflationary pressures that actually put the United States at risk of recession. Depending on how the government addresses these supply-side inflationary pressures, energy prices could continue to rise or not to new highs. As demand-side inflationary pressures persist, monetary policy is expected to keep its current restrictive stance, as monetary policy is data-dependent, forward data will guide monetary policy, If there is an overreaction to forward supply-driven energy price inflation, expect a Volcker-like recession. If there is no overreaction to forward supply-driven energy price inflation, expect a soft-landing. To put it this way, the current and forward inflation paths are currently under the control of the Biden Administration's forward measures over the supply of energy sector commodities, as the current and forward energy price inflation is supply-driven. Positioning remains prepared for either scenario.
Europe:
The Eurozone inflation continues to trend in the expected direction, in line with consumer expectations and the European Central Bank's projections. European economies' Gross Domestic Product performance remains resilient, beating expectations, although the Producer Manufacturer data is starting to reflect the slowdown in industrial activity in the Eurozone. This is an issue that the European Central Bank can't resolve without causing inflationary pressures; thus, the monetary policy tightening path is expected to continue.
Recession fears given by Producer Manufacturer data should be contained through European governments' fiscal and legislative policy measures, just as it's been done in the United States when there was a Producer Manufacturer slowdown and it was resolved with Bidenomics fiscal and legislative policy measures. Given the recent, previously mentioned popularity of European countries' leaders among their citizens, if they want to remain leaders, they should consider taking the correct fiscal and legislative policy measures towards addressing current recession fears that could also lower supply-side inflationary pressures.
Forward expectations over Eurozone performance remain the same as it performs within the range of expectations and beats expectations; there is confidence in European leaders' correct addressing of current data. Markets continue to focus on inflation data, which continues to ease, and Eurozone employment data, which remains strong.
Thus far, Europe has already averted a recession that was vectored by electric grid instability, European countries measures towards ensuring electric grid stability have and are ensuring stable supply of energy for Europe, this is one of many reasons why markets remain optimistic over the forward implementation of fiscal and legislative policies towards addressing recent recession worries. In fact, optimism and improving data showing resilience in Europe are reflected in markets's performance, as can be seen in the next chart.
Figure 18. Deutsche Bank CROCI Global Dividend Euro TR Index.
 Left side of the chart index price levels. (EUR) || Right side of the chart Volatility of the index. (Red line)")
A thing to point out is that a recent measure by the European Central Bank has been controversial as it doesn't enhance the monetary policy stance and deteriorates stability in the Eurozone; although monetary policy remains under the expected stance, continuing the monetary policy tightening path, the market priced-in peak rate remains above the European Central Bank's projections.
Markets frontloaded the forward and current supply-driven energy price inflation, which is expected to have minimal effect in Europe as supply of energy sector commodities has been and is expected to exceed demand. The European Central Bank is expected to continue to ensure price stability as inflation remains well above the 2% target. Ms. Lagarde's stance remains hawkish but nimble, the "could be a hike, could be a pause." comment remains unclear; forward data releases should guide forward monetary policy measures.
United Kingdom:
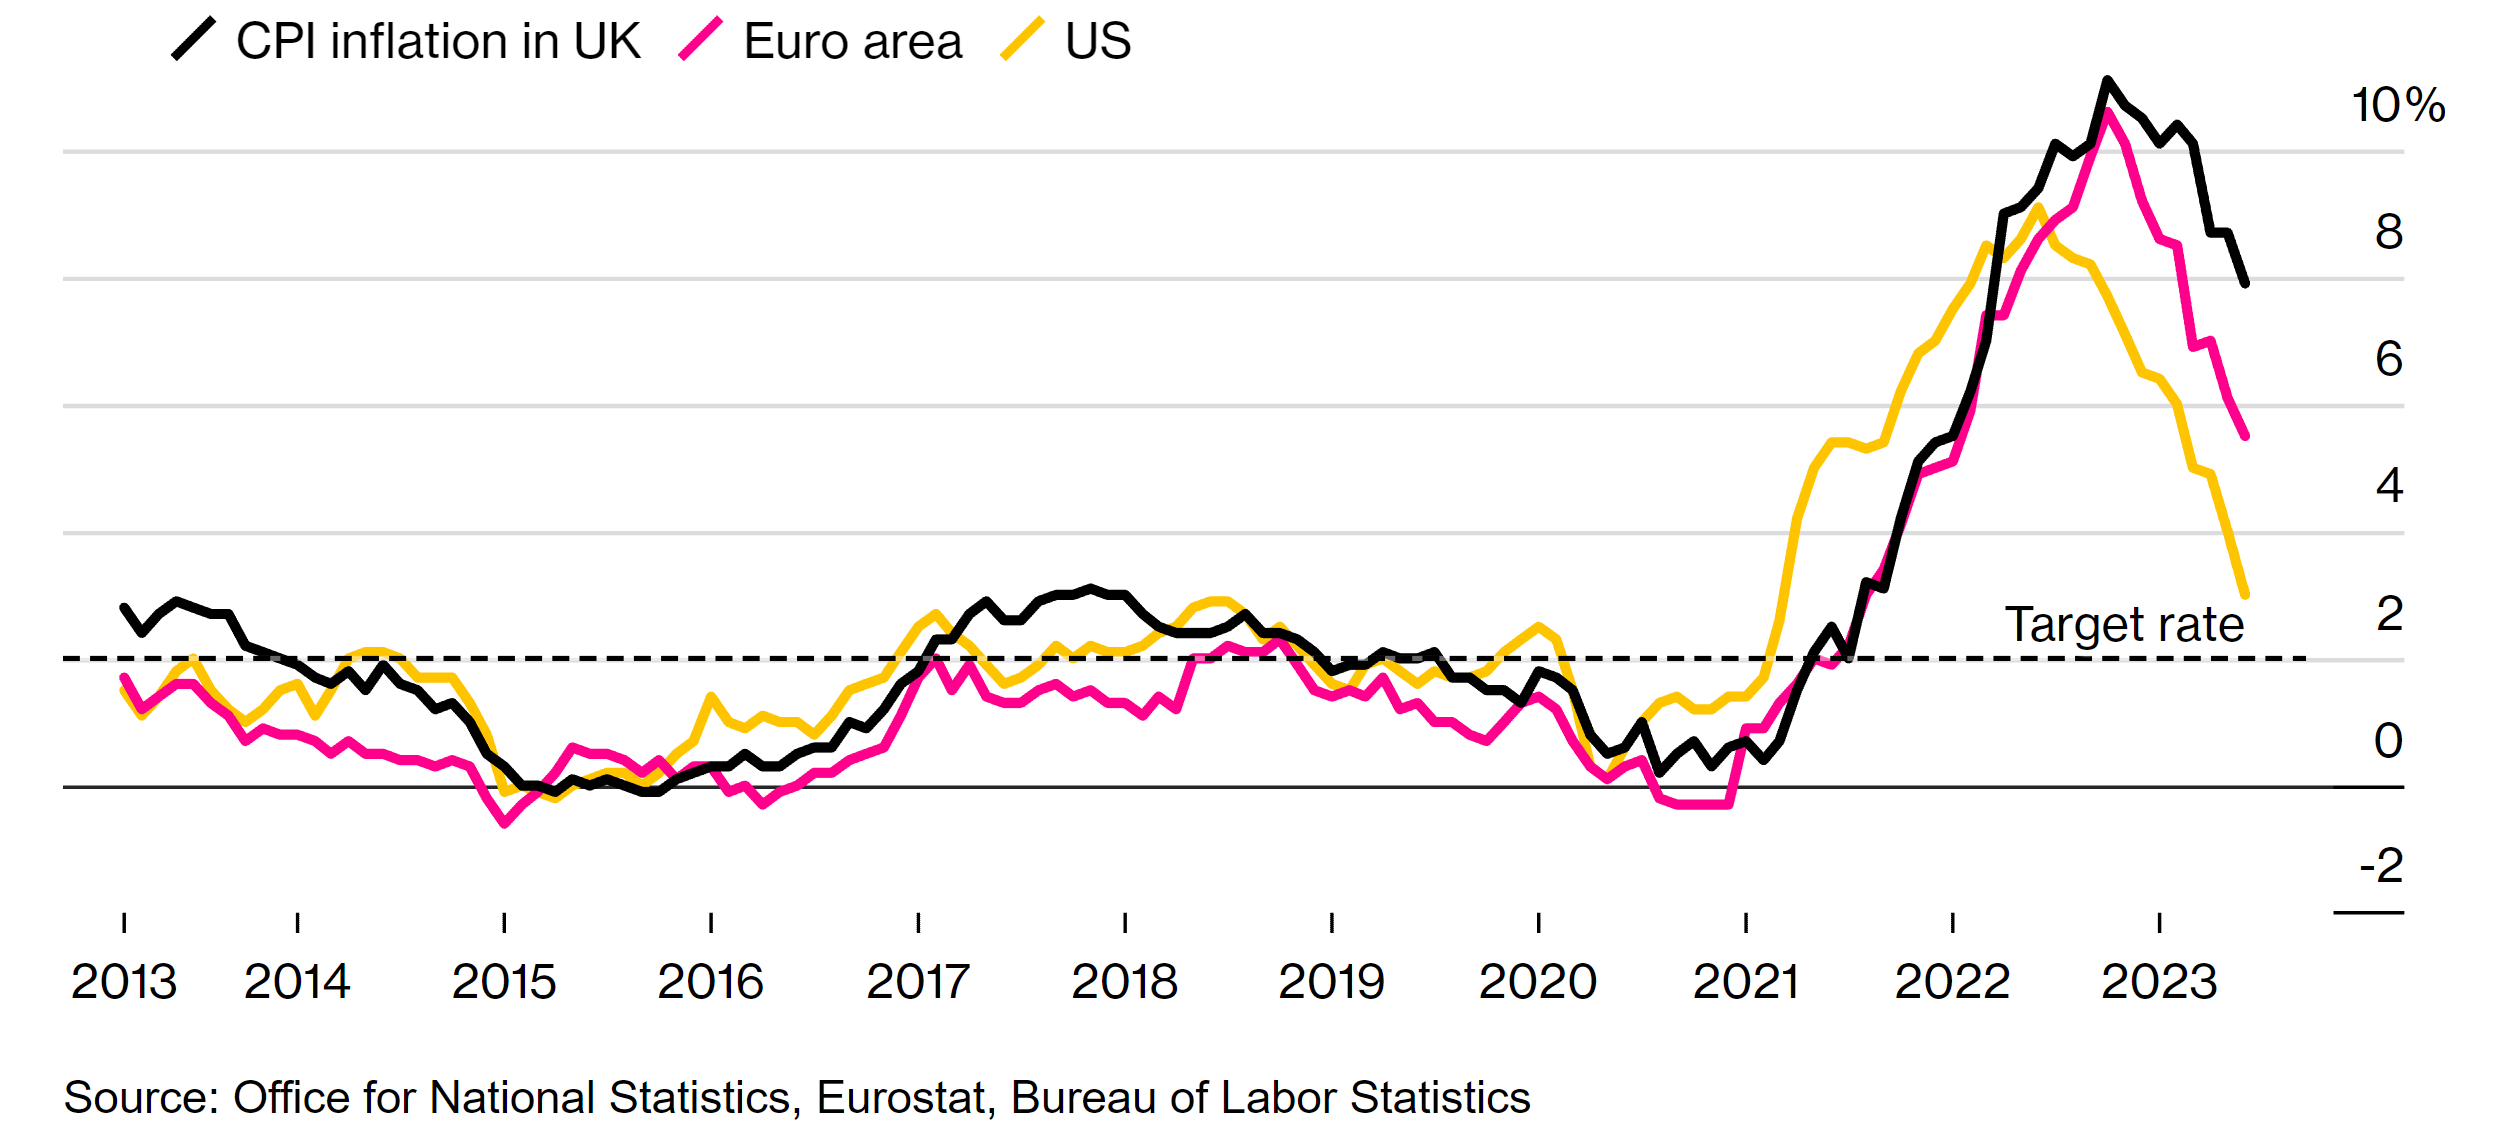
The United Kingdom's inflationary pressures continue to ease, although inflation remains way above the 2% inflation target, and still remains higher than its major G7 peers, as can be seen in the next chart, which is why monetary policy is expected to keep its stance towards ensuring price stability until after inflation reaches target; therefore, this week's Bank of England's interest rate decision is expected to deliver a hike.
Figure 19. The United Kingdom Still Has Higher Inflation Than Its Major Peers.
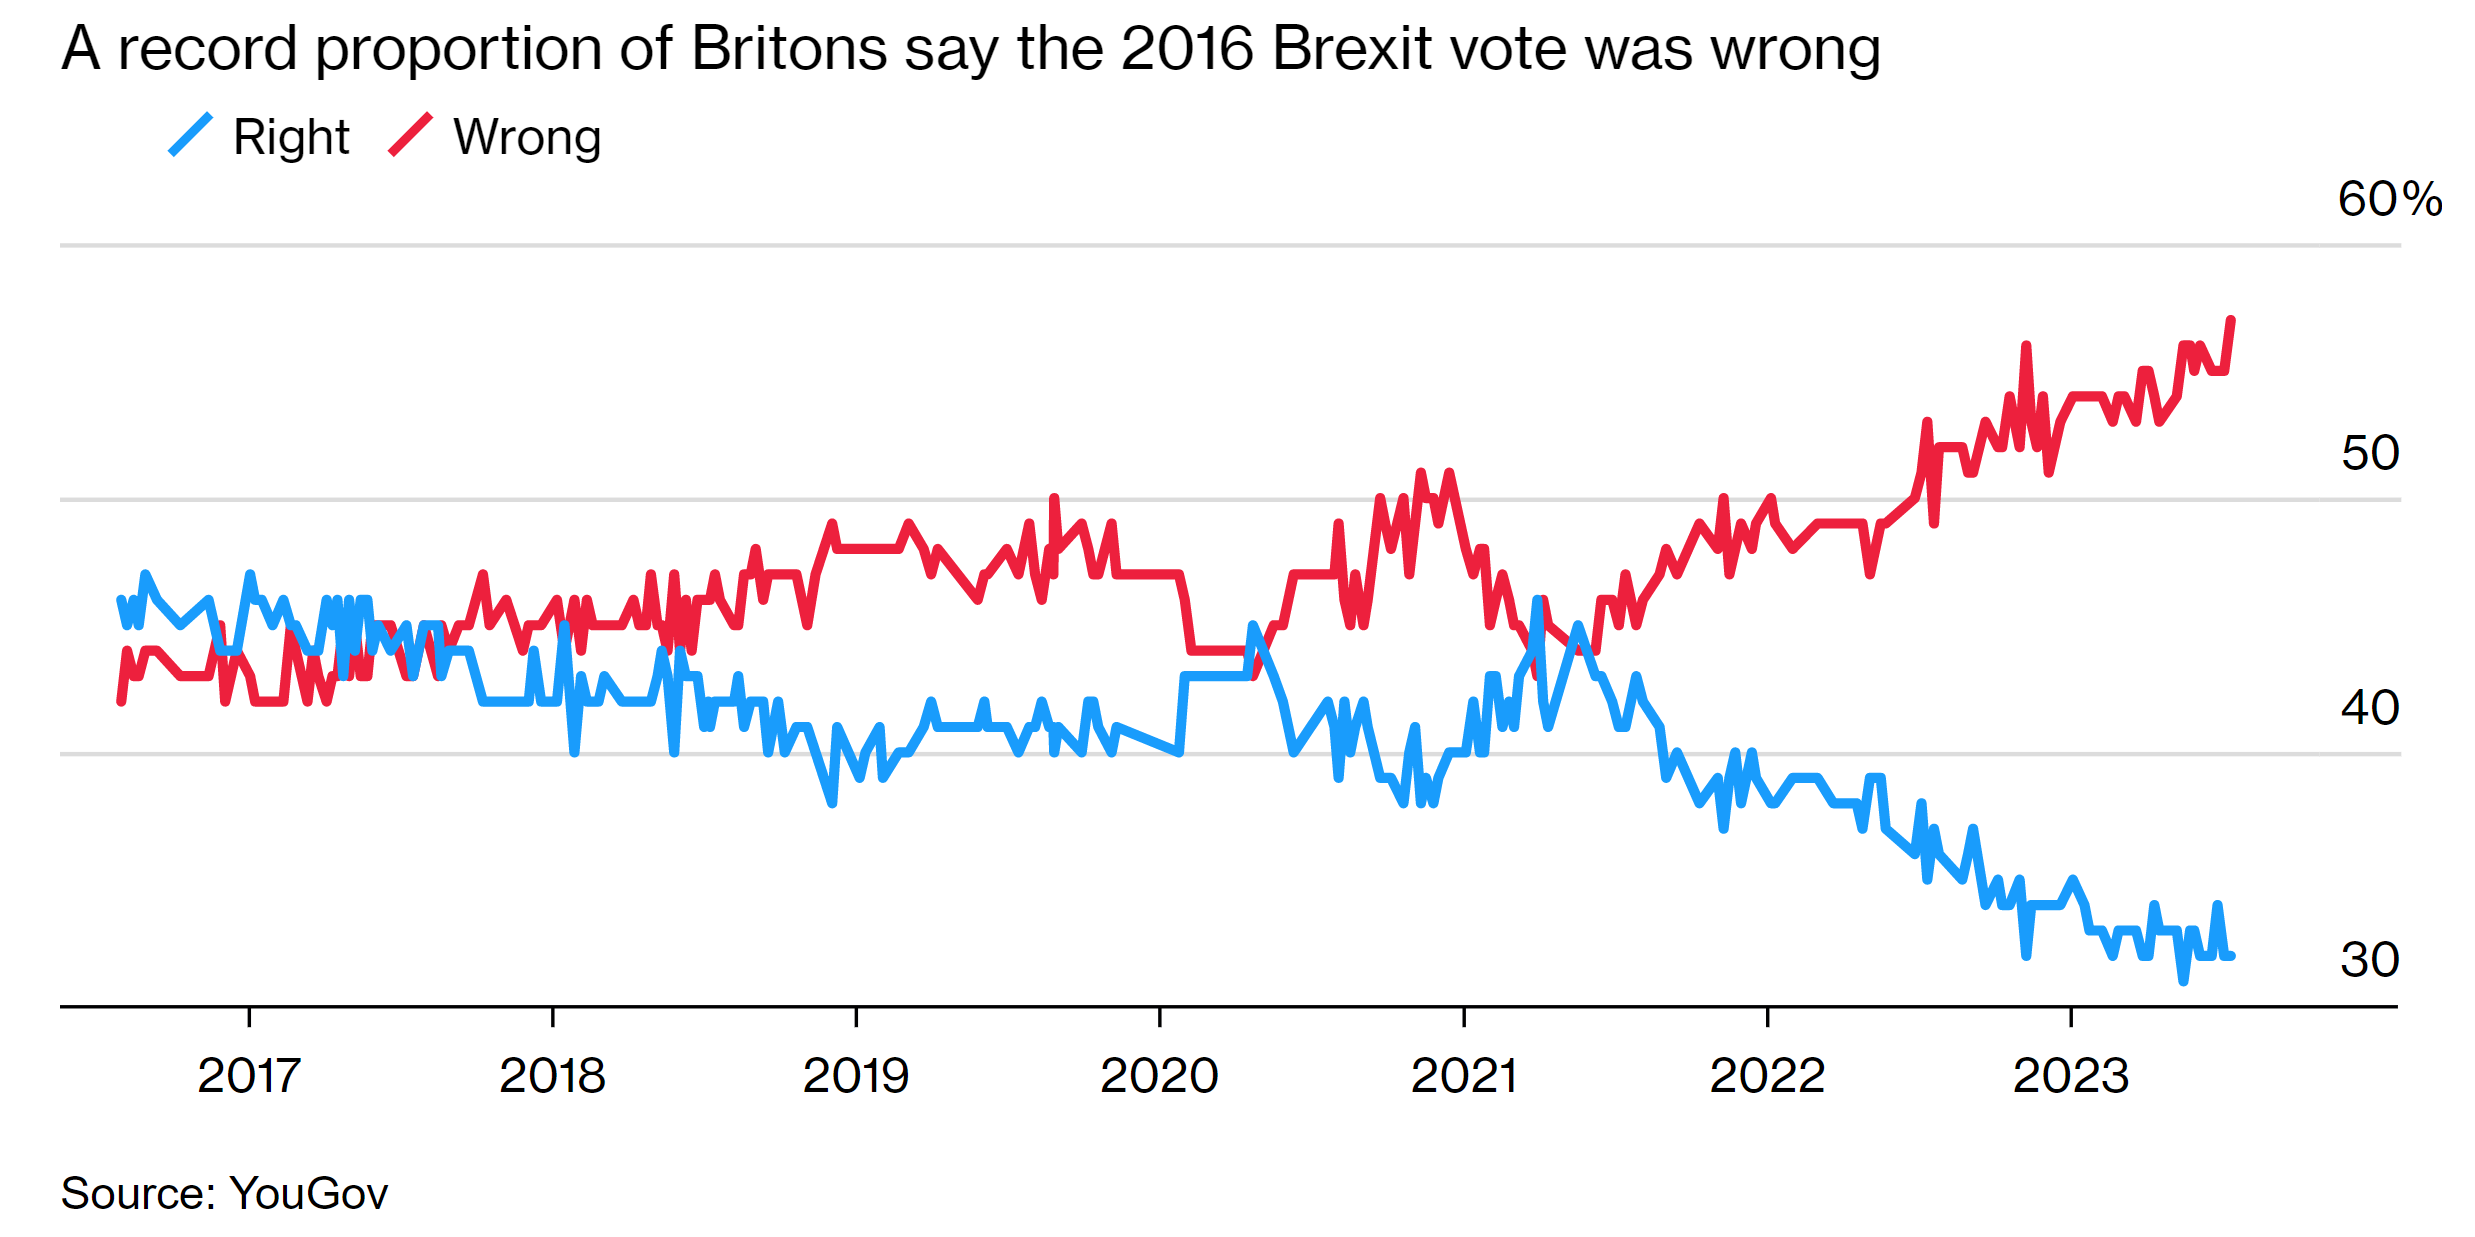
The United Kingdom's government measures are ensuring a stable supply of essential energy sector commodities to the United Kingdom, those measures not only ensure electric grid stability but also reduce supply-side inflationary pressures. Supply-side inflationary pressures due to the post-Brexit effect are expected to remain, although, as mentioned before, government initiatives have lowered those worries.
Figure 20. More than half of Britons ( 57% ) say that the United Kingdom was wrong to vote for Brexit in 2016.
Forward expectations for the United Kingdom's economy remain the same as it performs as expected.
Asia:
China:
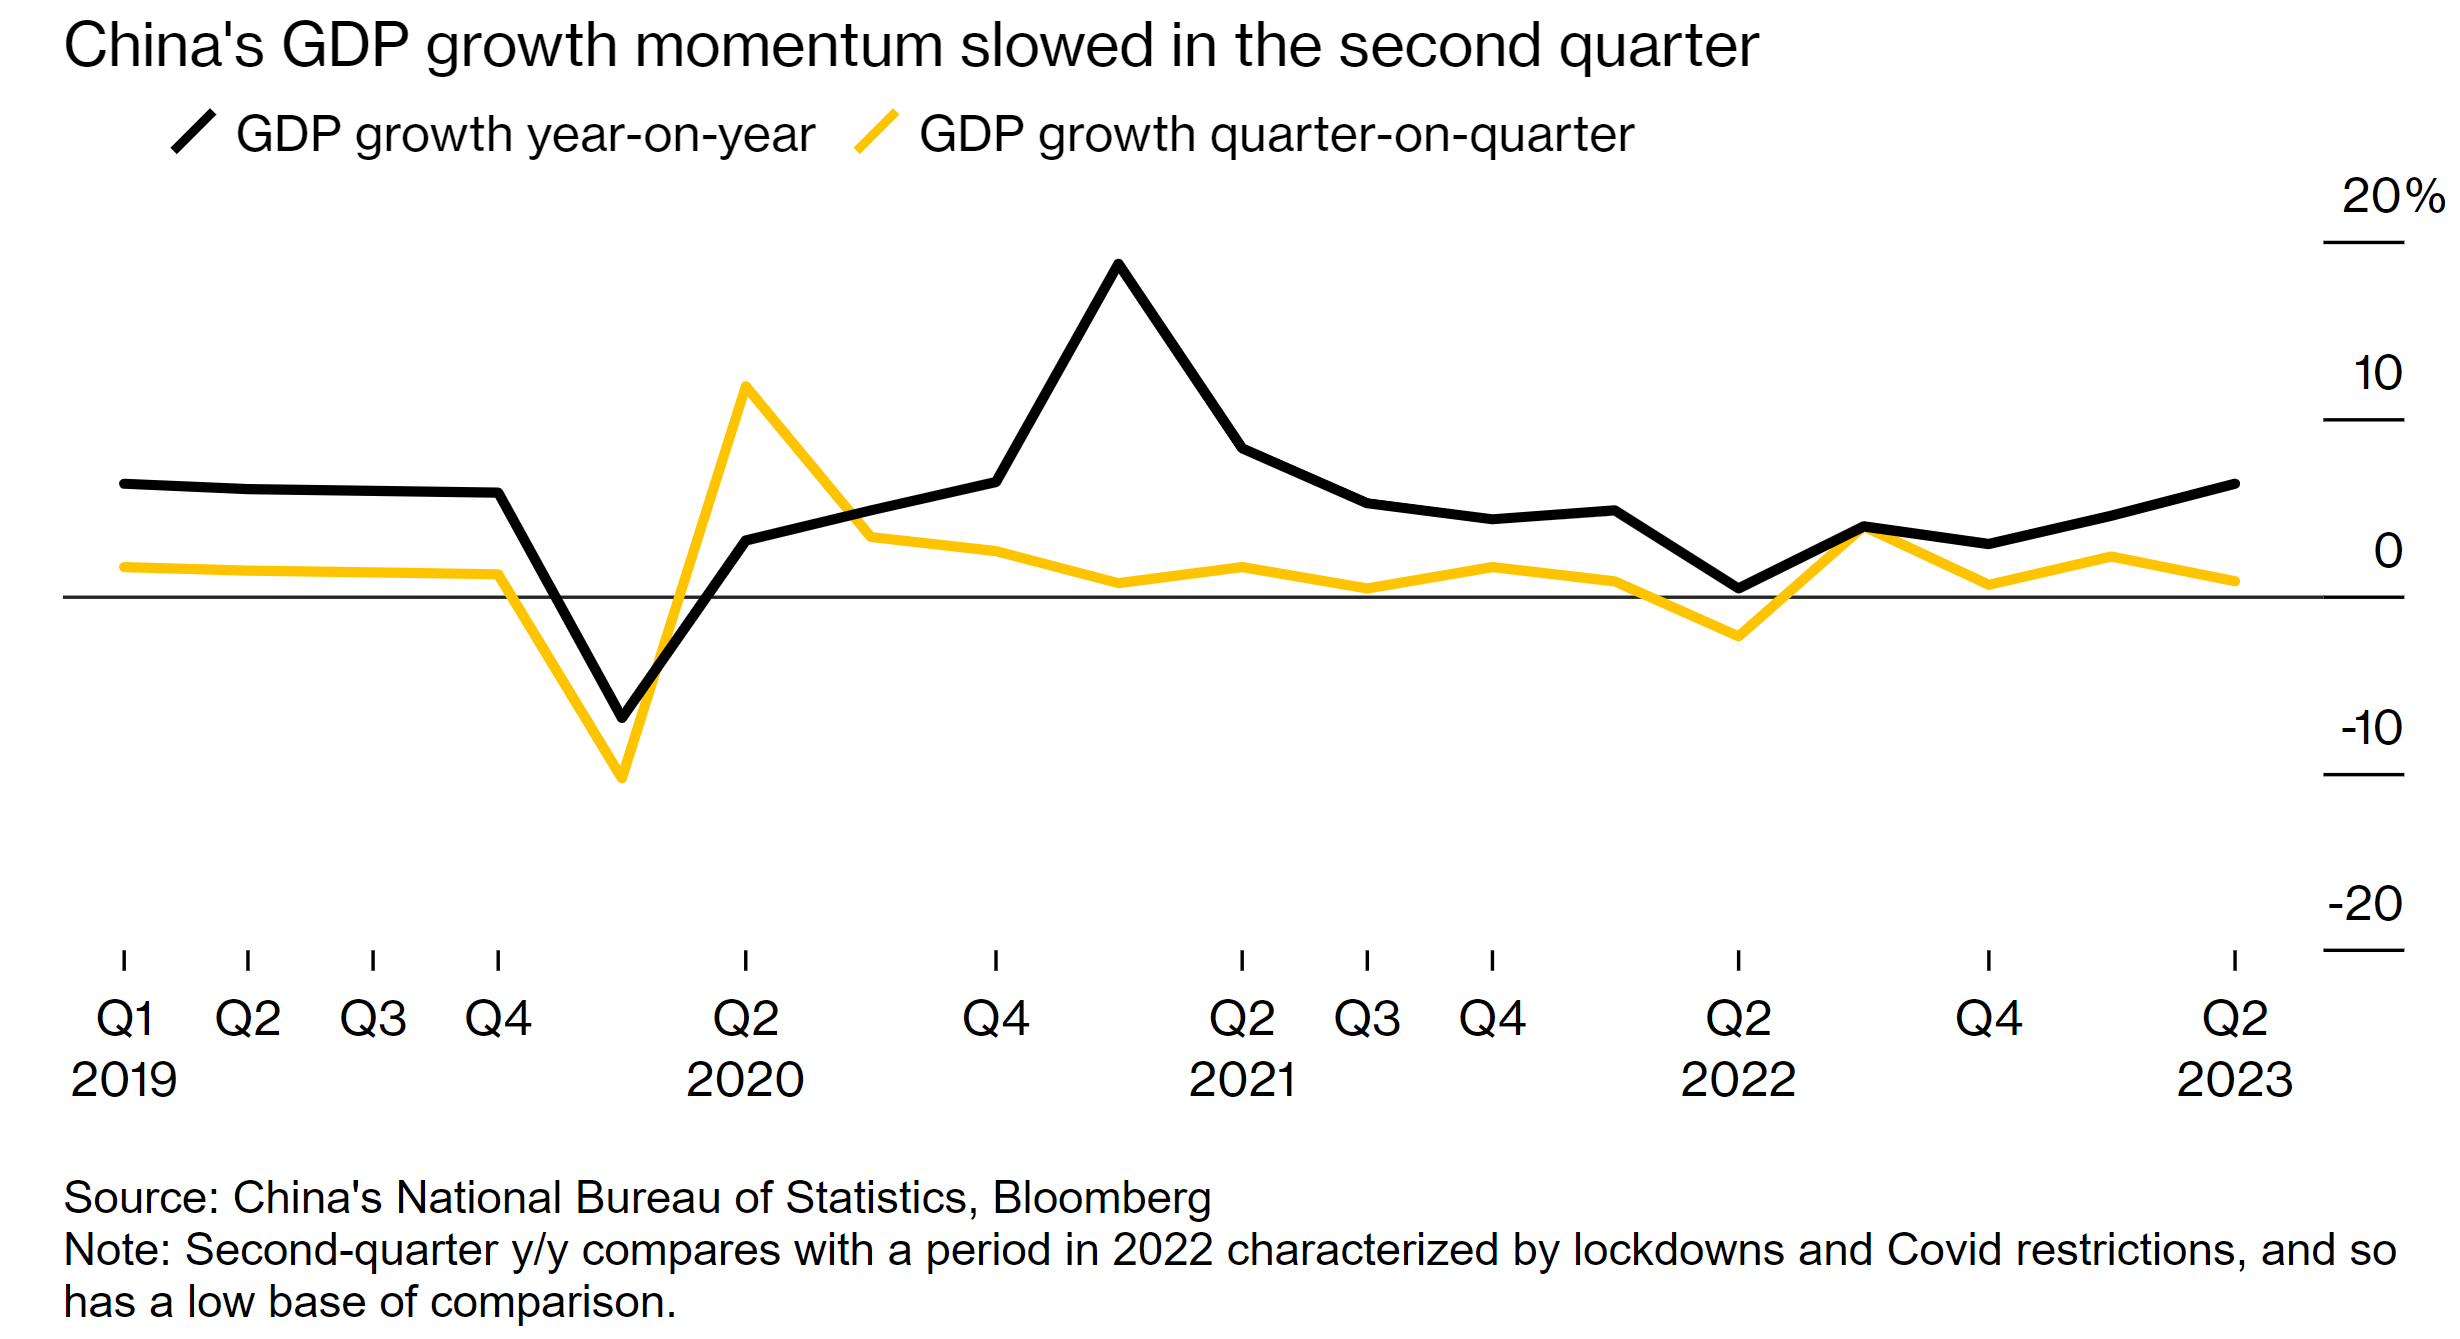
As mentioned before, China's economy grew, and it's expected to continue this trend as the Chinese government ensures that the Chinese economy doesn't enter into recession with the help of the People's Bank of China towards reducing currency devaluation adhered to economic stimulus. Recent Chinese data suggested that China’s overall economic momentum stayed weak at the start of 2H 2023, which the Chinese government is expected to correct.
Figure 21. China's Gross Domestic Product (GDP) Is Slowing Momentum In QoQ Basis But Increasing Momentum In YoY Basis.
China's employment data suggests that the Chinese economy is strong, whereas the manufacturing data suggests the contrary. These mixed signals increase uncertainty that the Chinese government should address.
China's hawkish demonstration of military power over the Taiwan dilemma indicates that China remains focused on regional interests that are justified by the One-China principle. As mentioned earlier in the post, geopolitical tensions remain the same, therefore, forward expectations remain the same. To conclude, China's economy is expected to keep improving as the fiscal and monetary policy measures ensure it; hence, the outlook remains the same.
Japan:
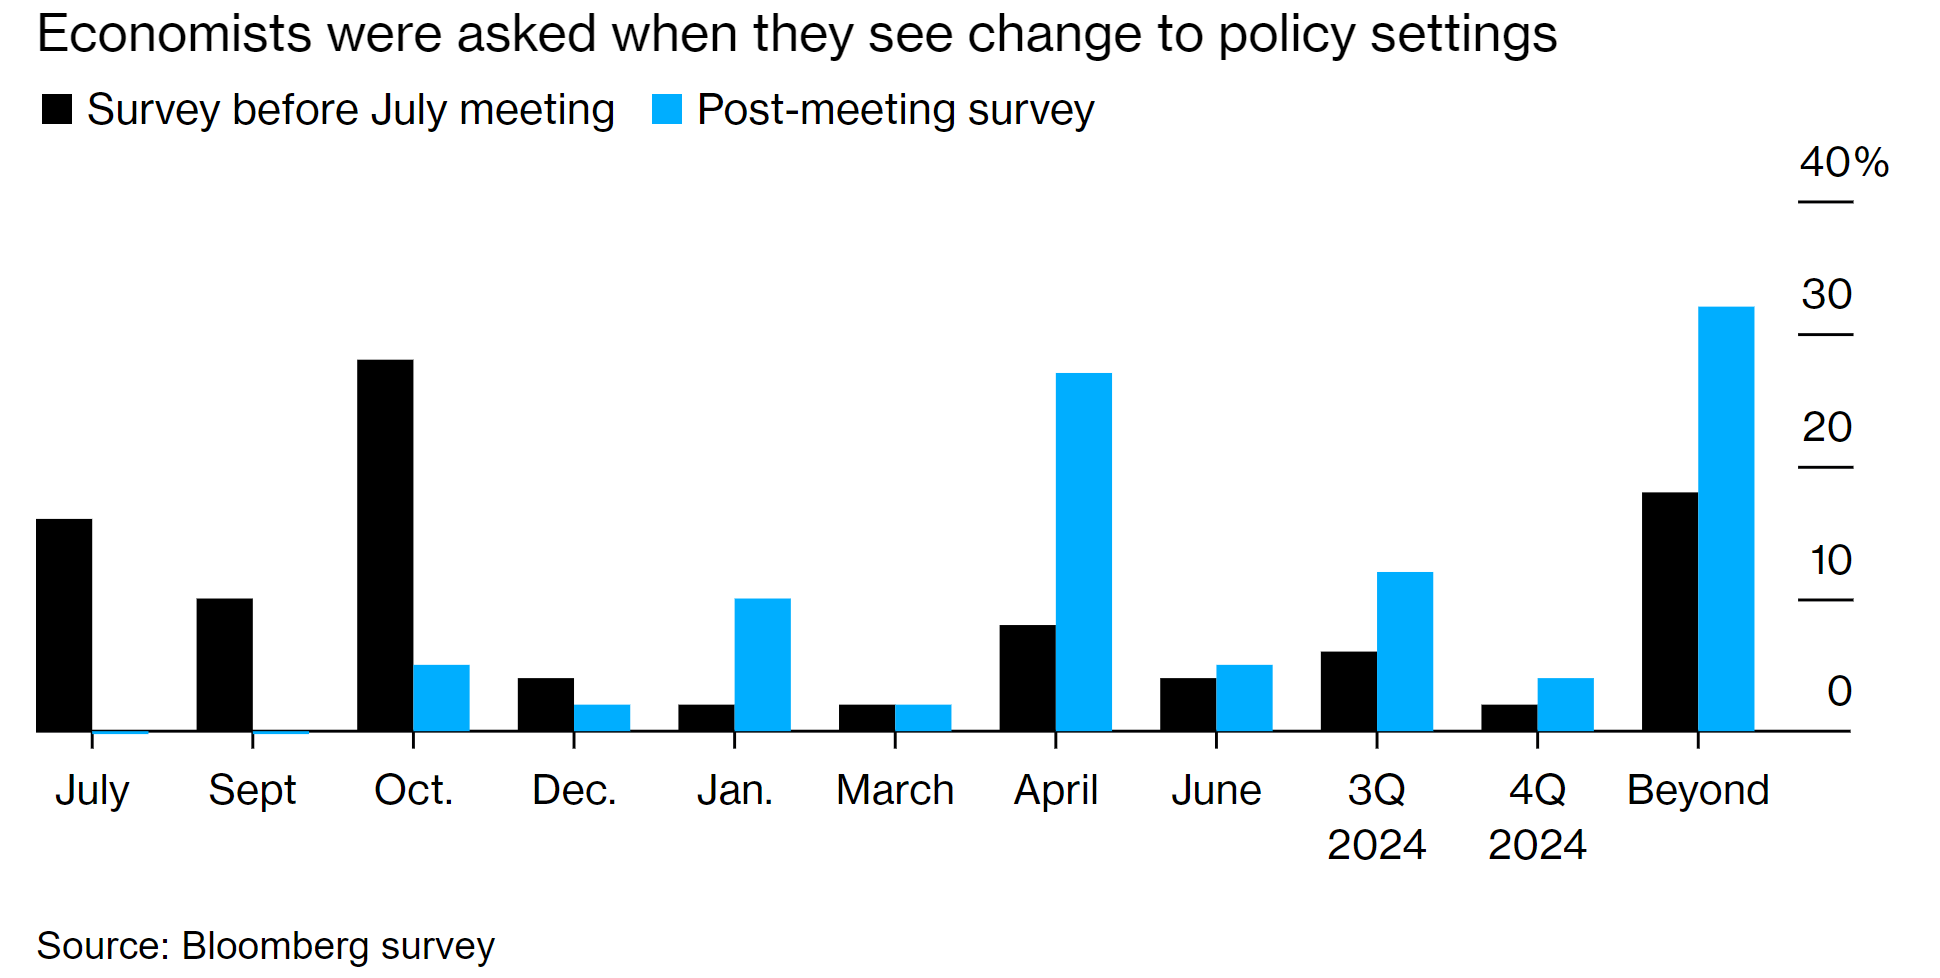
Japan's inflation remains well above the Bank of Japan's 2% target, these inflationary pressures are expected to increase as they are supply-driven, markets are still betting on a shift in monetary policy into 2024 given the fact that demand-side inflationary pressures persist.
Figure 22. No more Bank of Japan changes this year.
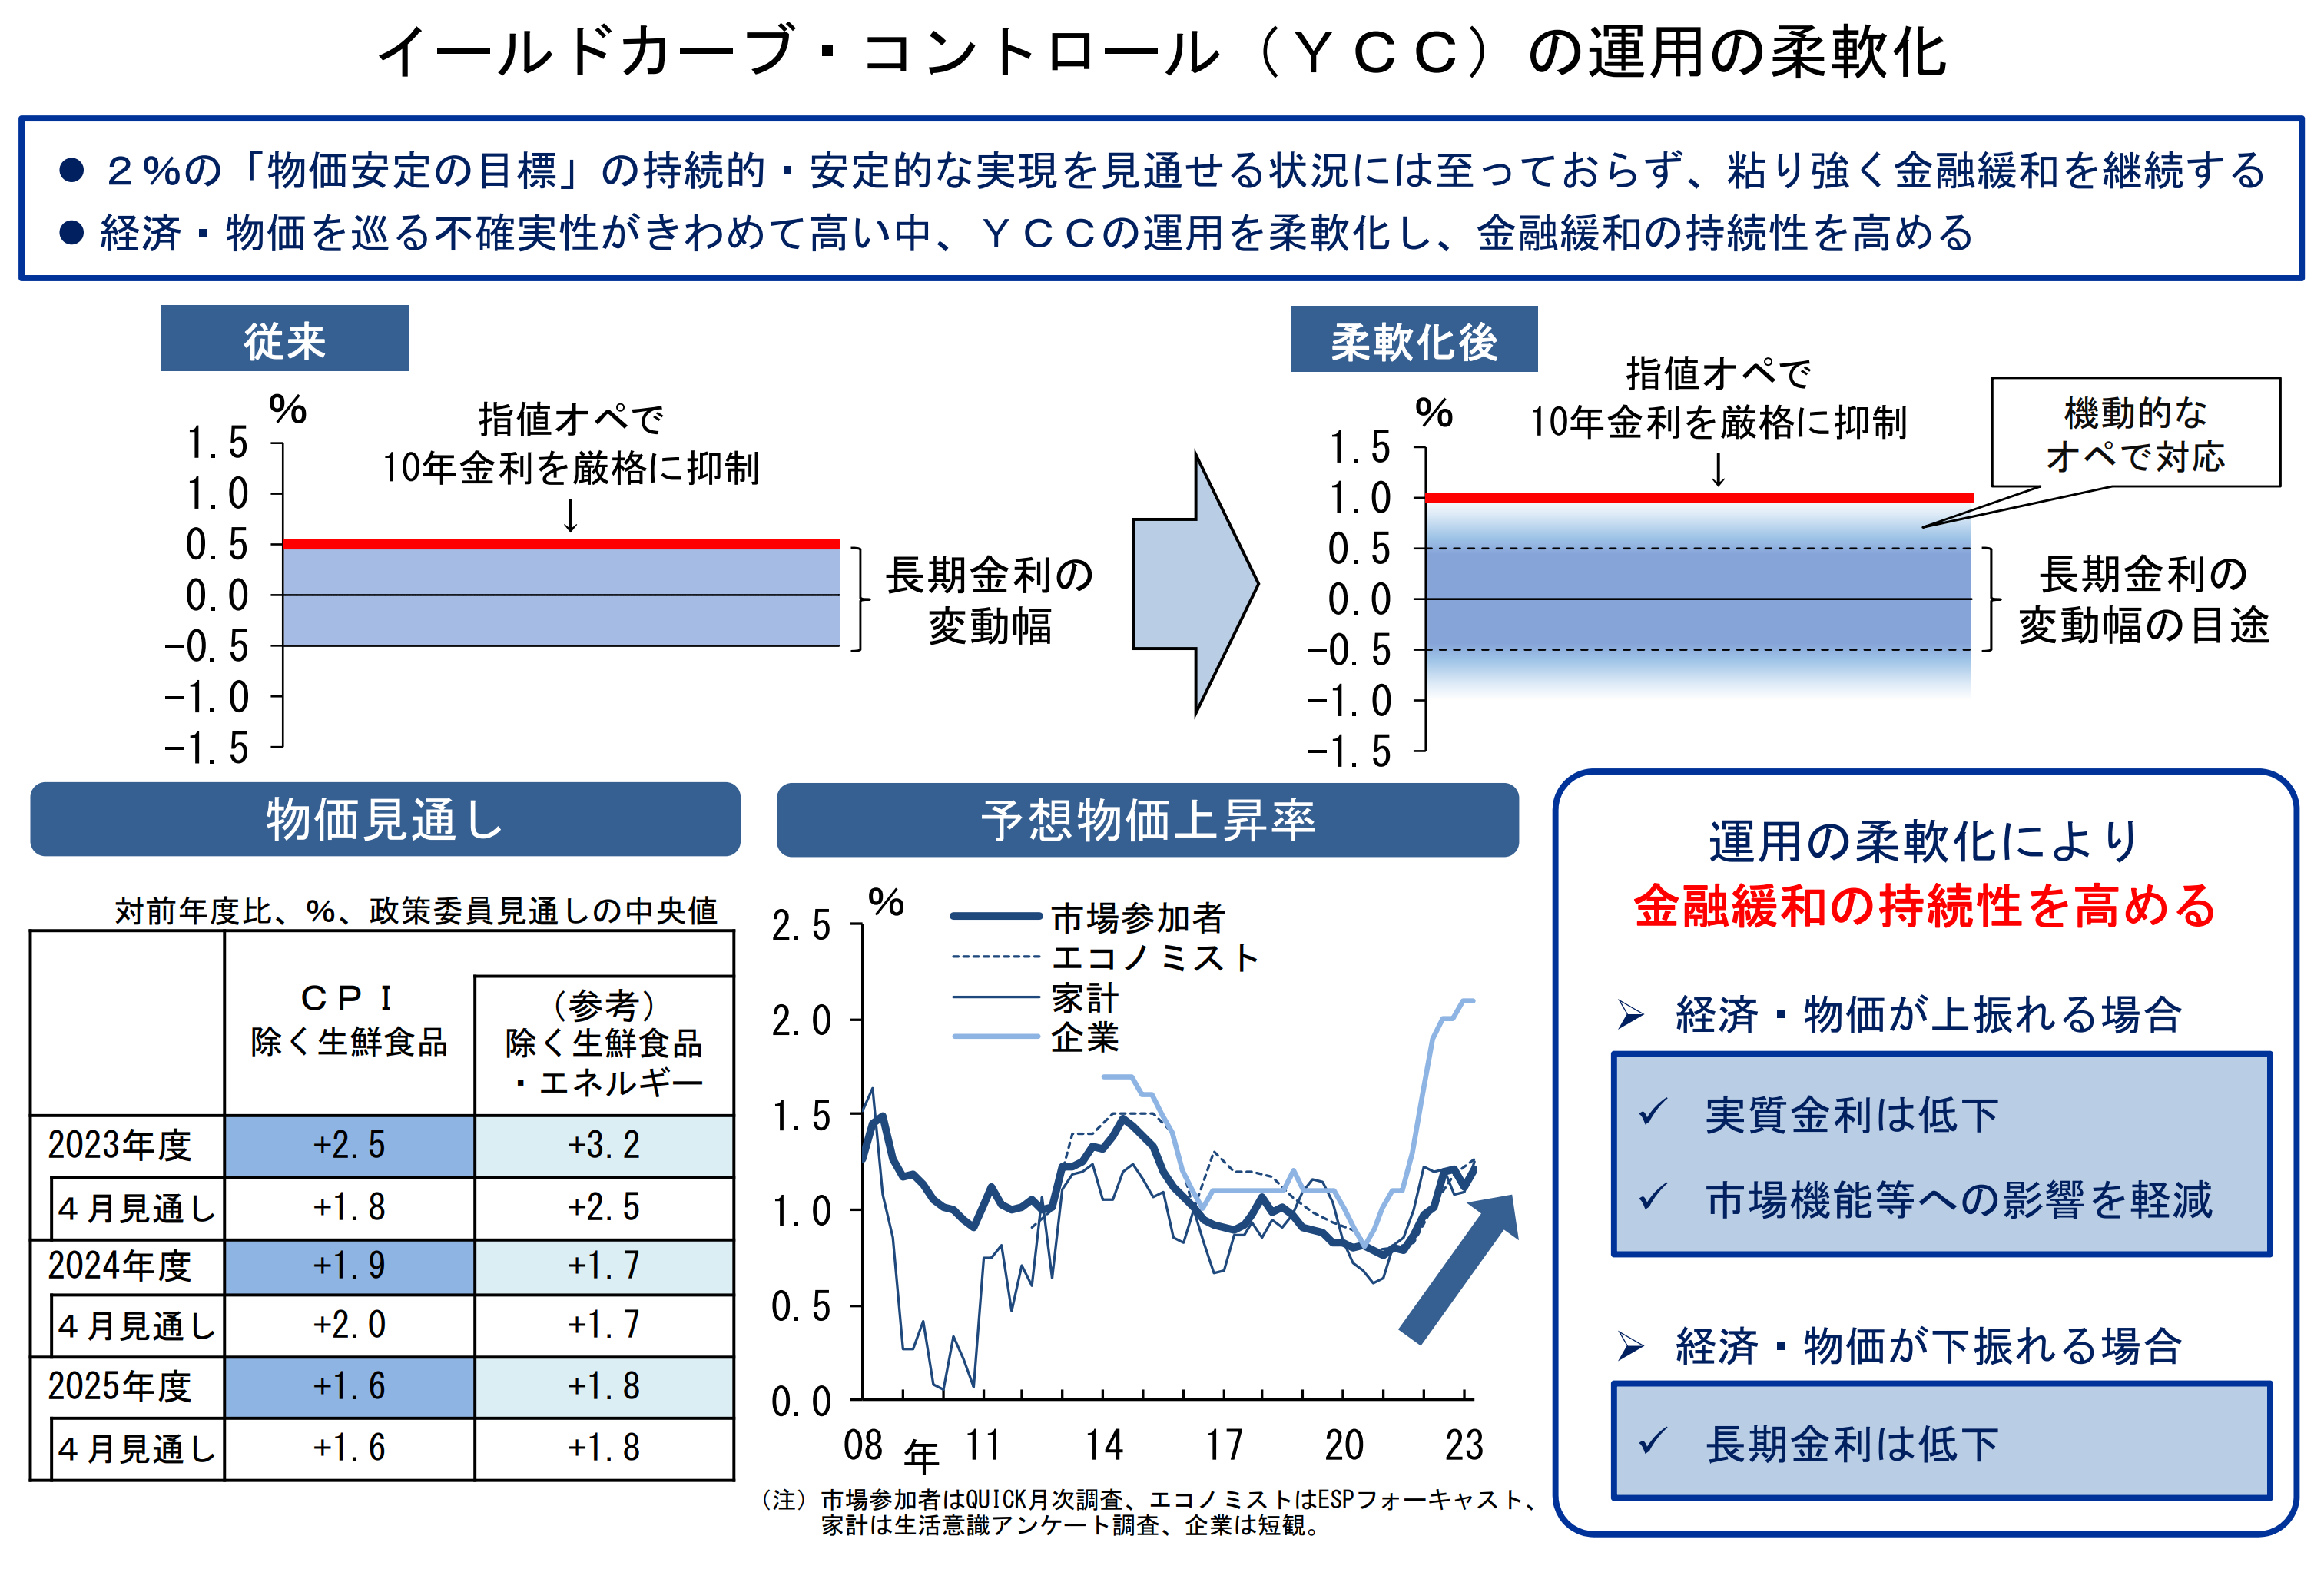
The forward-speculated monetary policy shift expectations given previous remarks from the Bank of Japan's governor Ueda, are priced in; markets have frontloaded the forward shift, which the new changes in the Bank of Japan Yield Curve Controls are absorbing. The next figure shows the new changes in Kuroda's Yield Curve Control.
Figure 23. Bank of Japan’s changes over Kuroda’s yield curve control (YCC).
To conclude, Japan's economy remains on a strong recovery path from the pandemic, recent improvements in Japanese employment data suggest that PM Fumio's measures are improving the Japanese economy, which is also reflected in the markets performance. Outlook remains the same.
Do feel free to share, leave a comment, and subscribe to Quantuan Research Substack if you want, by using the next buttons.
It's not about the money (the research is free); it's about sending a message (delivering alpha to the reader).