


The current scenario.
Analysis of microeconomic data, macroeconomic data, political data, geo-political data, and monetary policy with commentary on it, with the data on how to hedge the current scenario.

United States:
Folks, the United States remains strong in line with previously expected performance. The government's actions have averted a recession due to the Fiscal Responsibility Act of 2023. which made the United States avert government default but prolong a long-term problem, which is a debt bubble. Given the fact that that measure has been a kick the can measure, the dollar has depreciated due to Congressional Budget Office projections over the Fiscal Responsibility Act of 2023. This is the main reason why markets have been allocating into emerging market currencies as long-term risks over dollar stability remain higher than reward.
Figure 1. Ascent Broad Index.
 Left side of the chart index price levels. (USD) || Right side of the chart Volatility of the index. (Red line)")
Legislative measures are ensuring a strong job market, and monetary policy actions are ensuring price stability. The continued strong performance of the United States economy is what is and has been enhancing market valuations. The previously explained bull thesis remains the same, but there is no bear thesis for risk-off markets, just for risk-on sectors.
Figure 2. Deutsche Bank CROCI US 5% Vol. Control Index.
 Left side of the chart index price levels. (USD) || Right side of the chart Volatility of the index. (Red line)")
As deflation is more persistent than disinflation, given government measures that reduce supply-side inflationary pressures in key items of the producer and consumer price indexes and monetary policy measures that reduce demand-side inflationary pressures, inflation remains under deflationary conditions, which is good for the dollar, but given the previously explained reasons, the dollar remains under pressure in the long run. A thing to point out is that recent ISM data has been the main driver of speculative price action to the downside in markets, but job market data has lowered those worries.
Meme about VIX bulls given data.
 Volatility Index ( VIX ) bulls crying meme.")
Unlike other G7 countries, the United States remains on a steady soft-landing path, which is reflected in the markets performance as global speculators bet on the best-case and worst-case scenarios, such as defensive allocation with emerging markets and commodities given long-term expectations over the dollar's stability due to previously mentioned forward expectations and non-defensive allocation in markets in value sectors given forward expectations of the achievement of price stability due to the Federal Reserve's monetary policy measures.
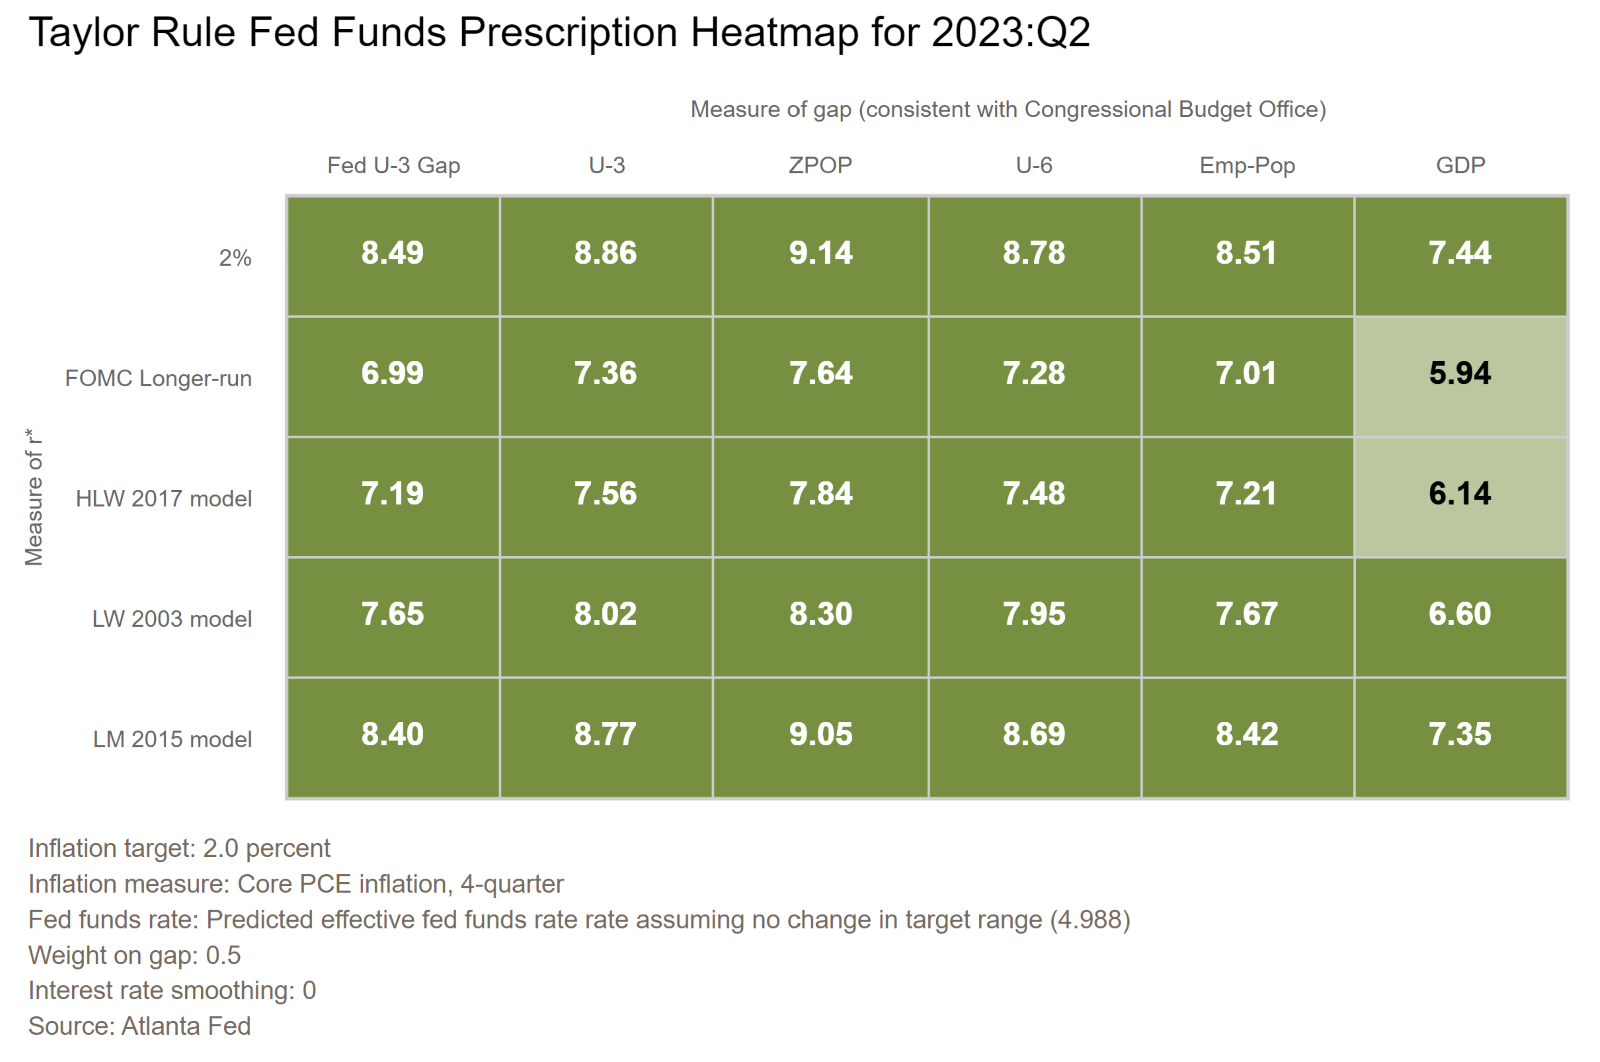
Overall, markets seem to position towards the best-case scenario when it comes to bond and stock markets, given the fact that expectations over monetary policy remain hawkish but nimble in line with FOMC officials’ statements and projections over monetary policy. Ctas positioning in the T-Notes futures market remains skewed towards positioning for a higher for longer monetary policy stance; the next three charts show where interest rates should be using seven simple monetary policy rules, remarking on the Taylor Rule Fed Funds Rate prospects from the seven simple monetary policy rules and what the FOMC officials of the Federal Reserve have projected over the Fed Funds Rates.
Figure 3. Effective Federal Funds Rate (Interest Rates) Projections by the FOMC.
.")
Figure 4. Summary of Federal Funds Rates Based on Seven Simple Policy Rules:

Figure 5. This is where interest rates should be, using John Taylor’s Taylor Rule:
Recent bubbly and highly speculative price action on markets mostly in hyper-beta and tech sectors due to the Artificial Intelligence (AI) mania has been quite concerning, as bubbles never end well. This Artificial Intelligence (AI) mania has enhanced previous positions in the tech sector, but the CFTC statistics show bearish allocations in Nasdaq 100 E-mini futures and SP500 E-mini futures by the market's largest participants, as can be seen in the next two charts.
Figure 6. CFTC Statistics over the Largest 8 or Less Traders Positioning in Nasdaq 100 E-Mini Futures.

Figure 7. CFTC Statistics over the Largest 8 or Less Traders Positioning in SP500 E-mini Futures.

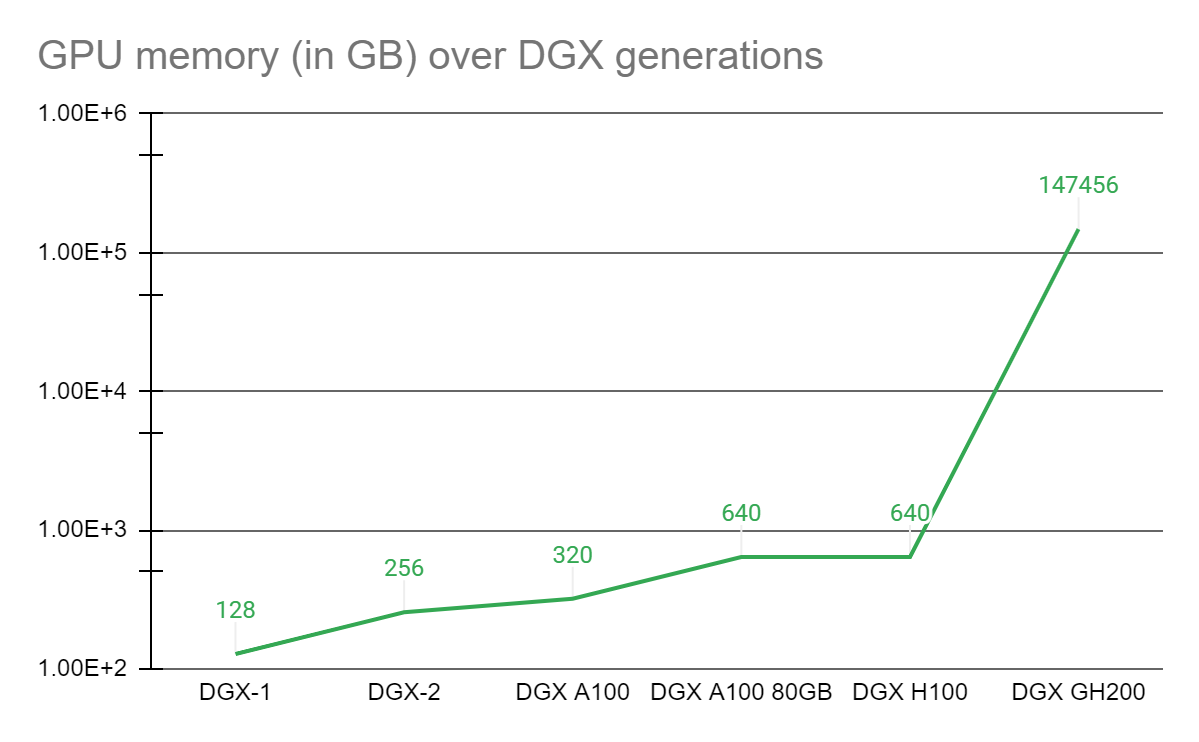
These statistics show a sell the news kind of positioning as everyone is talking about Artificial Intelligence which is a top signal, as pointed out before. This doesn't mean that Artificial Intelligence-related companies won't have growth in the future, but rather is a precautionary signal for markets. Artificial Intelligence is quickly evolving, and with supercomputers advancing at gigantic steps, there is undeniable future growth in this technology, but short-term prospects remain cautious given the previously mentioned reasons. As an example of the evolving AI technology, the next chart shows Nvidia's advancements in AI workloads with the first 100-terabyte GPU memory system.
Nvidia's first 100-terabyte GPU memory system.
Markets are still under mixed signals, as some have pointed out ( Bear signal , Bull signal ), that uncertainty by markets has also contributed to more concentrated speculative price action.
Given the geopolitical environment with a private risk model showing high risks of war/clash which is in line with previously shown scenario-generated war probabilities, both the scenario generator model and war/clash risk models that we use have predicted 100 out of 107 conflicts over the 2010s and 2020s decades, which has allowed to anticipate market shocks and profit from those market shocks when they happen with normally 2 months of anticipation, as explained before.
World War Probabilities:

	· Prob. War starting in Q3-4 2023:
		· War Probabilities:
			| - Probabilities of War starting in Q3-4 2023: 99% (±0.5)
		· Non-War Probabilities:
			| - Probabilities of Non-War starting in Q3-4 2023: 1% (±0.5)
			· Vectors:
				| - Taiwan [~85%(±0.5)], Ukraine [~14% (±0.5)], Else: [~1%(±0.5)].
Source: Private Software under NDA.
Remaining defensive remains a top priority when it comes to hedging the current market conditions in the current scenario; hence, the previously mentioned options strategies and trade optimization models remain the same, as they remain highly profitable, so no change should be made but rather enhancements. For the folks who asked about how to enhance their forecasts, they should implement this time-series prediction machine learning algorithm.
Top risks looking forward into 2023 year-end and forward in time are the World War and consequently supply chain shocks in key sectors such as semiconductors. As explained before in a thread, recession risks are lower than World War risks, whereas hyperinflation risks remain the same as war risks given the logic-implied consequences of the World War, such as a drastic increase in government spending that would result in hyperinflation as there are fewer countries using dollars and fewer countries buying United States Government Treasuries. With China recently selling at a record pace United States Government Treasuries and with the BRICS alliance de-dollarizing, prospects for the dollar's performance remain skewed to the downside, but this doesn’t mean it’s over for the United States.
Forward events are expected to cause an industrialization previously expected for Europe, which means that the United States has strong potential in the long-run. This was previously expected to not be the case, but the United States has proven to show a strong recovery from the pandemic's inflationary and employment shocks, shocks that made the Federal Reserve take action towards ensuring that the Federal Reserve’s dual mandate was being employed. The Federal Reserve has been and is still on a path towards price stability in a United States with strong employment data, as can be seen on the next chart. This has allowed and will continue to allow monetary policy to stay focused on price stability rather than full employment. As Jerome Powell said, "Price stability is the responsibility of the Federal Reserve. Without price stability, the economy does not work for anyone.".
Figure 8. The Employment Situation in the United States.

Therefore, positioning in markets must be approached from a hawkish but nimble stance; thus, ctas positioning is an example of this market approach.
As the presidential term ends on November 5, 2024, and the 2024 elections get closer, each day that passes with seasonality over this event remains a big market speculative event. President Biden’s achievements are notorious, but people seem to dislike the president as the next chart shows.
Figure 9. Joe Biden's Approval and Disapproval Rating Statistics:

Overall, market speculators seem to not care about Joe Biden’s disapproval rating but rather care about and focus on the Biden Administration’s achievements, as market speculation statistics over the 2024 elections show. No matter your political affiliation, you must admit that the United States remains strong, given the measures taken by the government. The United States needs union rather than confrontation, mostly due to forward expected events that require union, given the fact that government division instead of union weakens government. Politicians must never forget that the United States were founded based on union.
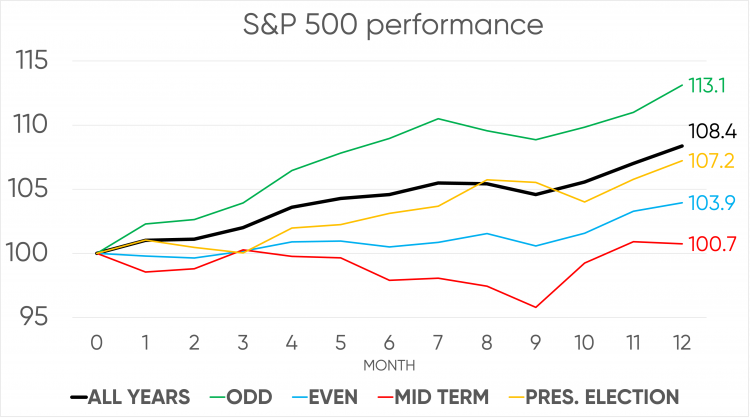
As some have pointed out, the 2024 elections are like the 1960s elections; the seasonality of this event is shown in the next chart.
Figure 10. S&P 500 Performance in Odd, Even, Mid-Term, and Presidential Elections.
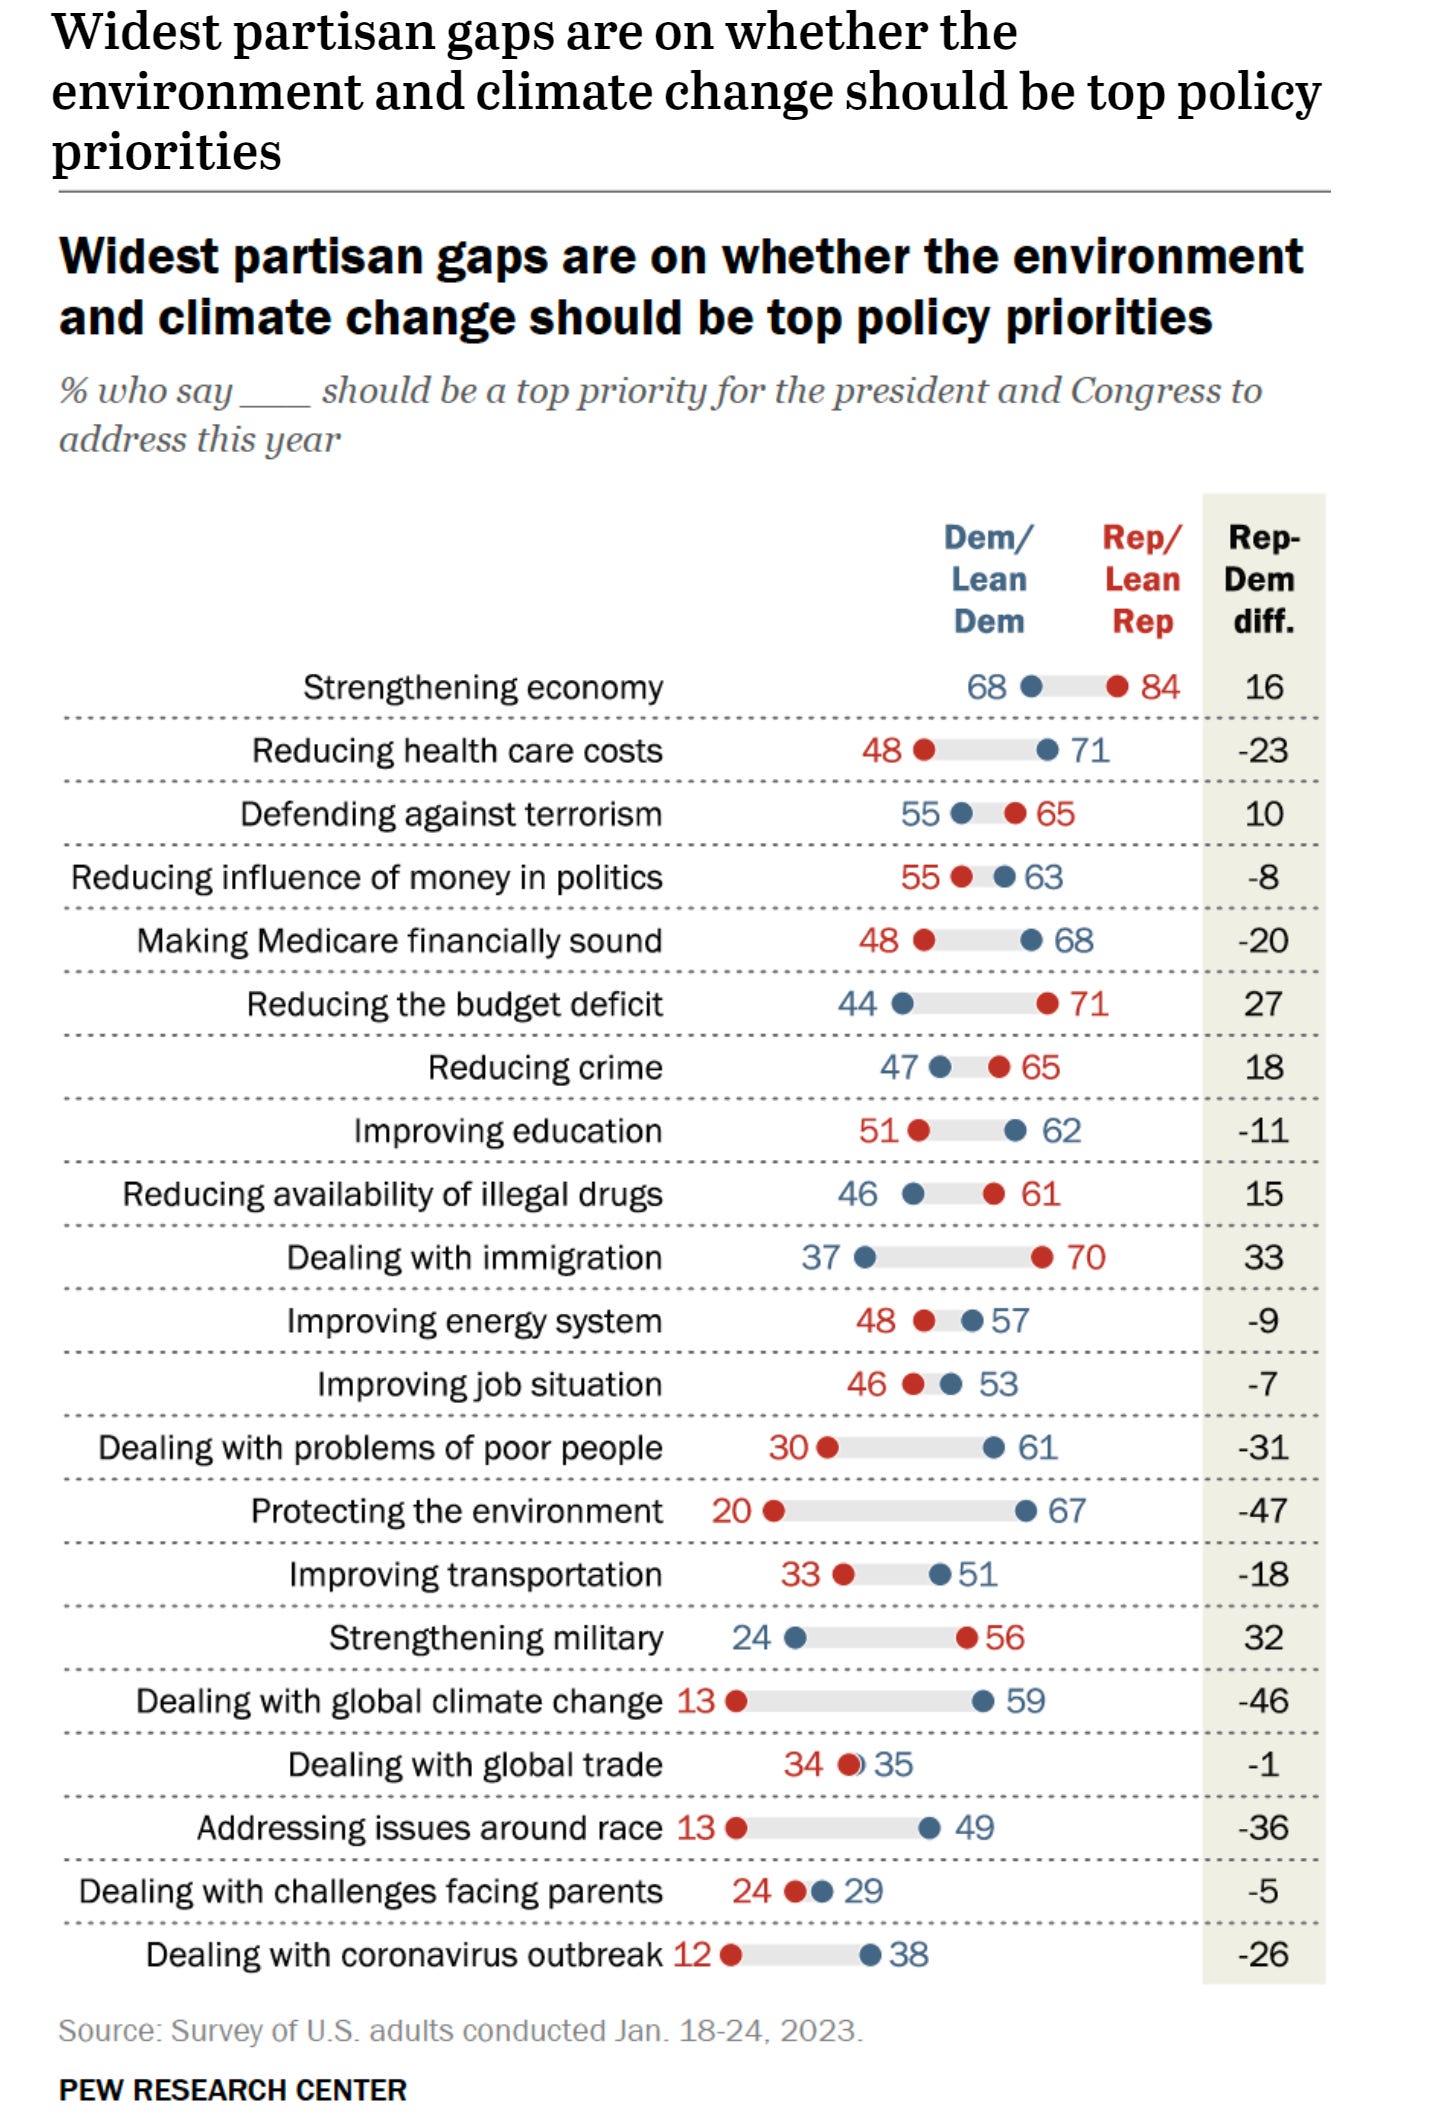
H/T to Pew Research Center for the statistics on Americans’ top concerns, which can correlate with speculators bets over the 2024 elections, as achievements over Americans' worries surpass Joe Biden's disapproval ratings; hence, this is the reason why speculators are betting on Joe Biden's renomination rather than an alternative.
Figure 11. Americans’ Top Policy Priorities by Democrats and Republicans.
Folks, that's all about the United States, do enjoy the summer.
Europe:
The next chart shows the Euro Area labour market remaining strong while Core Inflation statistics show persistent inflationary pressures; therefore, further rate hikes are expected to be implemented as inflation remains way above the European Central Bank's 2% inflation target. Forward rate hike expectations are in line with the European Central Bank’s monetary policy stance.
Figure 12. Euro Area Inflation and Job Market Data:

As inflation lowers given the European Central Bank’s monetary policy measures, European and global market speculators have been betting on the best-case scenario for the Euro Area, which is reflected in the markets performance, which can be seen in the next chart.
Figure 13. Deutsche Bank CROCI Global Dividend Euro TR Index.
 Left side of the chart index price levels. (EUR) || Right side of the chart Volatility of the index. (Red line)")
Previously mentioned events in the United States are still making people move towards emerging markets, such as European markets. The commitment of European Central Bank members towards ensuring price stability has been and still is what has made markets bet big on European markets. Ms. Lagarde's comments remain focused on price stability, with recent statements remarking on the fact that the European Central Bank is data-dependent.
(…) “Our future decisions will ensure that the policy rates will be brought to levels sufficiently restrictive to achieve a timely return of inflation to our 2% medium-term target and will be kept at those levels for as long as necessary.” (…) - European Central Bank's Christine Lagarde
The Euro ctas positioning remains skewed towards approaching the hawkish monetary policy stance of the European Central Bank, similar to the United States ctas positioning but more hawkish given the higher inflation.
Figure 14. Deutsche Bank Eurozone Gross Equity Futures CTA Index.
 Left side of the chart index price levels. (USD) || Right side of the chart Volatility of the index. (Red line)")
Folks, the outlook for Europe hasn’t changed as data releases remain within the range of expectations. Unlike the United States, Europe faces a technical recession, but worries over it are attentive and is expected to be mild given the employment statistics that show a strong Europe in a high inflation environment. Previously expected recession expectations for Europe were graver, which has given breathing room for markets as markets have been expecting a grave recession from the first quarter of 2022 to the end of the fourth quarter of 2022. Strong employment has allowed and still allows the European Central Bank to focus on price stability with monetary policy tools such as interest rates and Quantitative Tightening. Overall, the European Central Bank’s soft-landing path can be achieved given strong statistics that show mixed European economy data with one big obstacle, which is the high inflation.
United Kingdom:
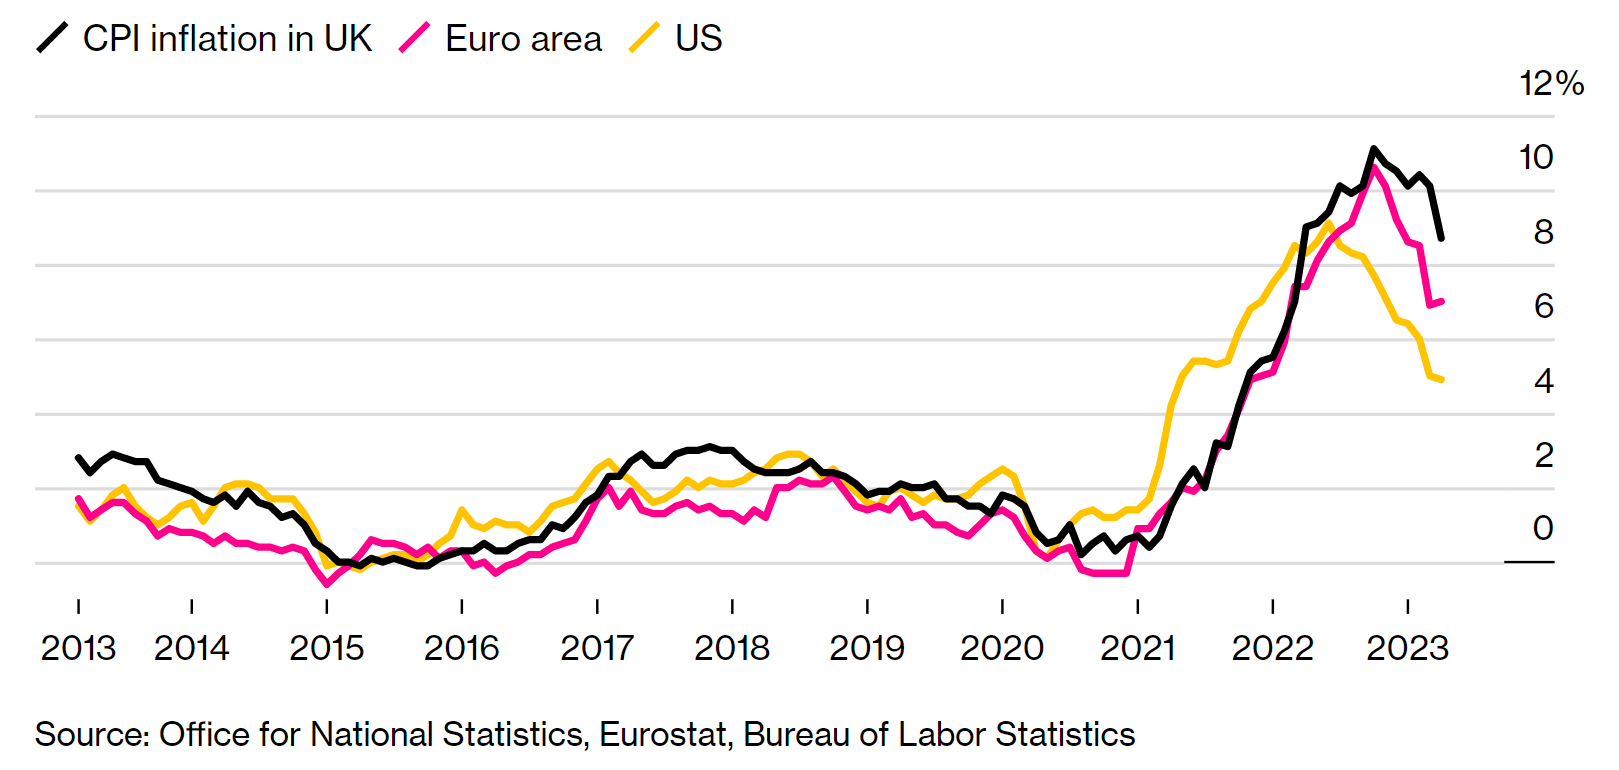
The United Kingdom is facing a quite complicated inflationary environment with food and core goods prices causing concerns to the Bank of England and the United Kingdom’s inflation statistics staying behind the curve of the Euro Area and United States inflation statistics; all this data is shown in the next two charts.
Figure 15. Food Prices and Core Goods Prices Are Causing Concern at the Bank of England.
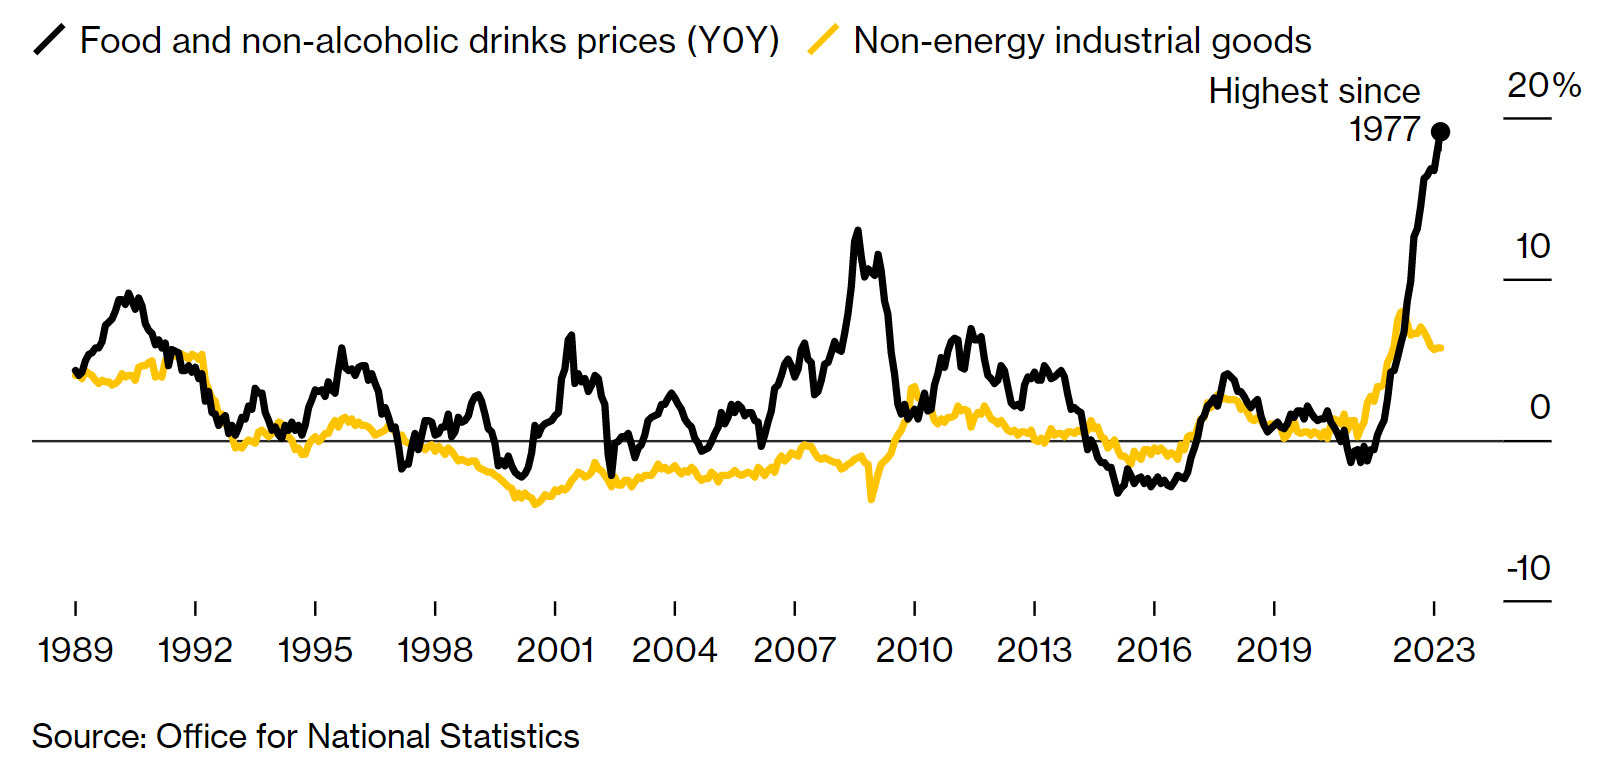
Figure 16. Britain Has a Worse Inflation Problem Than Its Major Peers.
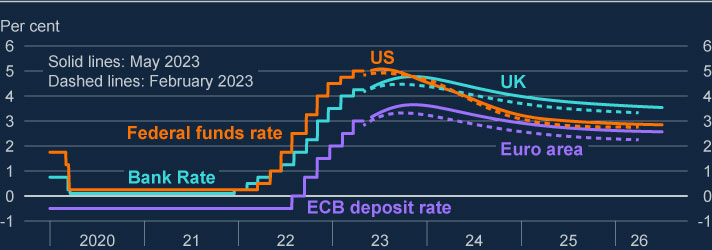
Expectations over a soft-landing path remain the same, but interest rates may need to get higher than what the market expects. This is something that has to be done in order to ensure price stability, but there are paths towards allowing a hawkish monetary policy stance without having to hike more than what the Bank of England’s Monetary Policy Committee members have signaled. The next chart shows market expectations over the United Kingdom’s interest rates compared to those of the United States and the Euro Area.
Figure 17. Market participants think that policy rates are nearing their peak.
Such adjustments would be implemented through changes in the quantitative tightening pace that can equal certain size rate hikes depending on the conditions of the economy. This favorable, plausible change in the Quantitative Tightening pace was mentioned by Bank of England Monetary Policy Committee member Ramsden. The next chart shows the equivalent of Quantitative Tightening pace changes to rate hikes in basis point-denoted measures.
Figure 18. Rate Hikes Equivalent to Quantitative Tightening under normal market conditions or during crisis periods.

Folks, the United Kingdom's prudent fiscal policy measures are lowering the high cost of living of people in the United Kingdom, but some recent legislative measures might increase some inflationary pressures, which might make monetary policy shift more hawkish in the long run as those legislative measures don’t cause an immediate effect on inflation but rather have sequential effects on supply and demand side inflationary pressures. The United Kingdom’s markets have been repricing it for the past 3 months; therefore, the worst is not yet to come, as the International Monetary Fund (IMF) has pointed out. Overall, the Bank of England’s soft-landing path is achievable, but will take longer than its major peers. The Bank of England’s Monetary Policy Committee inflation projections are realistic rather than pessimistic, as can be seen in the next charts.
Figure 19. Bank of England Inflation Projection Changes.
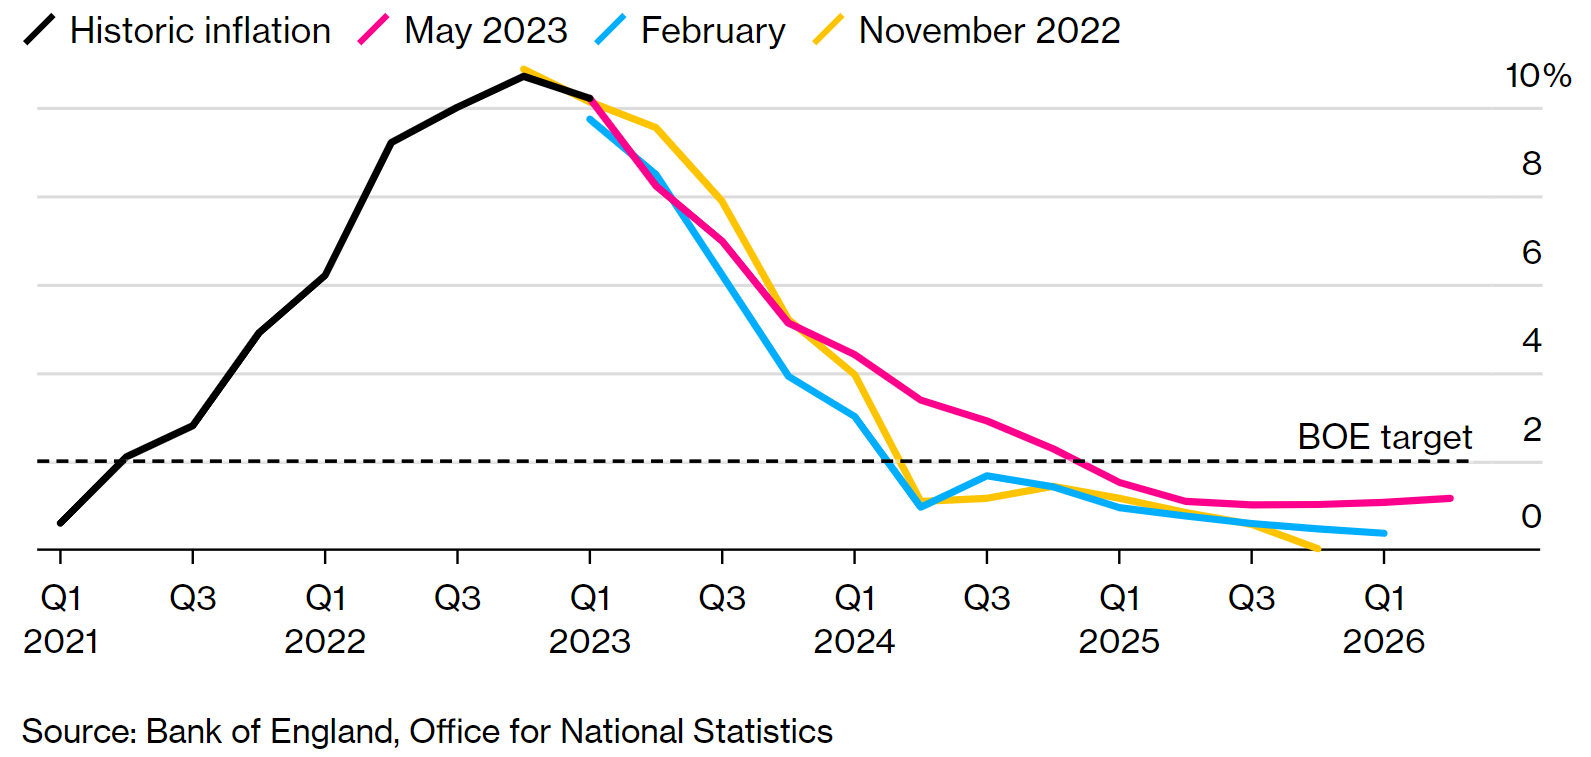
Figure 20. Consumer Price Inflation projection based on market interest rate expectations, other policy measures.

Thus, the outlook hasn’t changed much, as performance of the United Kingdom’s economy remains in the range of expectations.
Asia:
China:
Recent Chinese PMI data lowered worries over China’s recovery rather than reopening. Chinese government measures towards ensuring a strong recovery have also enhanced the forward outlook, but as some have pointed out, China may be headed towards a scenario similar to Japan’s lost decade.
China is facing serious worries over employment. China’s recovery may be losing steam, but recent data releases have shadowed those worries. With previously mentioned geopolitical data and remarkable news headlines such as the United States indirectly threating and warning China and a Taiwanese separatist soldier missing in China who is more than probably dead, China’s Shenzhen, Shanghai, and Hong Kong markets including Taiwan, have been pricing the increases in geopolitical tensions over the past three quarters, now with prospects with high certainty of war/clash as pointed out before.
Folks, the measures taken by the People’s Bank of China are in line with previously mentioned expectations; these measures devalue the Chinese Yuan in the short term but enhance the Chinese economy, which bolsters the Chinese Yuan's value in the long run. Recent comments by People’s Bank of China Governor Yi at the Lujiazui Financial Forum have enhanced the forward outlook for the Chinese economy. Short-term expectations remain grim given the previously mentioned data, but long-term expectations remain optimistic.
Japan:
The geopolitical tensions have made some global speculators flee from Chinese markets to Japanese markets. The Japanese government, guided by PM Fumio's measures along with the Bank of Japan’s measures towards ensuring a steady recovery, has also made global speculators find Japanese markets more attractive; this is reflected in the next two charts. One thing to point out is that Japanese markets in Euro or Dollar valuations are cheap, as pointed out before.
Figure 21. Deutsche Bank Japan Gross Equity Futures CTA Index.
 Left side of the chart index price levels. (USD) || Right side of the chart Volatility of the index. (Red line)")
Figure 22. Deutsche Bank Japan Gross Equity Futures Index.
 Left side of the chart index price levels. || Right side of the chart Volatility of the index. (Red line)")
Recent Japanese data releases suggest that the government should enhance measures towards preventing recession from happening as weak consumption drags the Japanese economy. Market expectations over higher Japanese inflation have made markets increase positioning in Japanese break-even rates. Overall, as pointed out before; the Japanese economy behaves way stronger than market expectations.
Do feel free to share, leave a comment, and subscribe to Quantuan Research Substack if you want, by using the next buttons.