
The Logical View Of The Current Scenario.
Analysis of the current scenario with forward data expectations.

This is not my job ( I'm retired ); this is my hobby because I post research independently for fun and for free, as I explained before. I intend to maintain my posting once every two weeks, but I've been working on something with close friends that keeps reducing the time I have for the posting, so maybe there will be one post once a month. Recent events made me consider if I should start a podcast to give an in-depth explanation of the research I publish, which would allow me to reduce the time of posting, and I'd likely post in text form after publishing my research in audio form to complete the analysis with charts, or simply keep writing and posting in text form, which takes me more time. Either way, enjoy the read, folks.
United States:
The United States’ economy keeps performing within the range of expectations; statistics continue to prove the resilience of consumers and businesses, which is reflected in markets’ performance.
Figure 1. Deutsche Bank CROCI US Plus Index Total Return.
[ Left Y-axis: Index data. (🟦) | Right Y-axis: Volatility of the index. (🟥) ]
![[ Left X-axis: Index data. (🟦) | Right X-axis: Volatility of the index. (🟥) ] | Data as of 03/01/2024 market close. |](https://substackcdn.com/image/fetch/$s_!4E6C!,f_auto,q_auto:good,fl_progressive:steep/https%3A%2F%2Fsubstack-post-media.s3.amazonaws.com%2Fpublic%2Fimages%2F76717007-968f-4d51-90a4-768f2480b8be_3803x1918.png "[ Left X-axis: Index data. (🟦) | Right X-axis: Volatility of the index. (🟥) ] | Data as of 03/01/2024 market close. |")
Figure 2. Deutsche Bank CROCI US 5% Vol. Control Index.
[ Left Y-axis: Index data. (🟦) | Right Y-axis: Volatility of the index. (🟥) ]
![[ Left X-axis: Index data. (🟦) | Right X-axis: Volatility of the index. (🟥) ] | Data as of 03/01/2024 market close. |](https://substackcdn.com/image/fetch/$s_!oz_e!,f_auto,q_auto:good,fl_progressive:steep/https%3A%2F%2Fsubstack-post-media.s3.amazonaws.com%2Fpublic%2Fimages%2Fcb4430c7-26e5-49d2-804a-cba45f20ad73_3802x1920.png "[ Left X-axis: Index data. (🟦) | Right X-axis: Volatility of the index. (🟥) ] | Data as of 03/01/2024 market close. |")
The artificial intelligence mania continues, and Nvidia (NVDA 0.00%↑) continues to lead it, given the fact that Nvidia (NVDA 0.00%↑) has become the first chip maker to join the $2Trillion club (which was expected), which only Apple (AAPL 0.00%↑), Microsoft (MSFT 0.00%↑) and Saudi Aramco held.
Figure 3. Nvidia (NVDA 0.00%↑) Becomes Part Of The $2Trillion Club Which Previously Just Apple (AAPL 0.00%↑), Microsoft (MSFT 0.00%↑) & Saudi Aramco Held.

Figure 4. Nvidia’s (NVDA 0.00%↑) Reported & Estimated Annual Revenue Per FY.
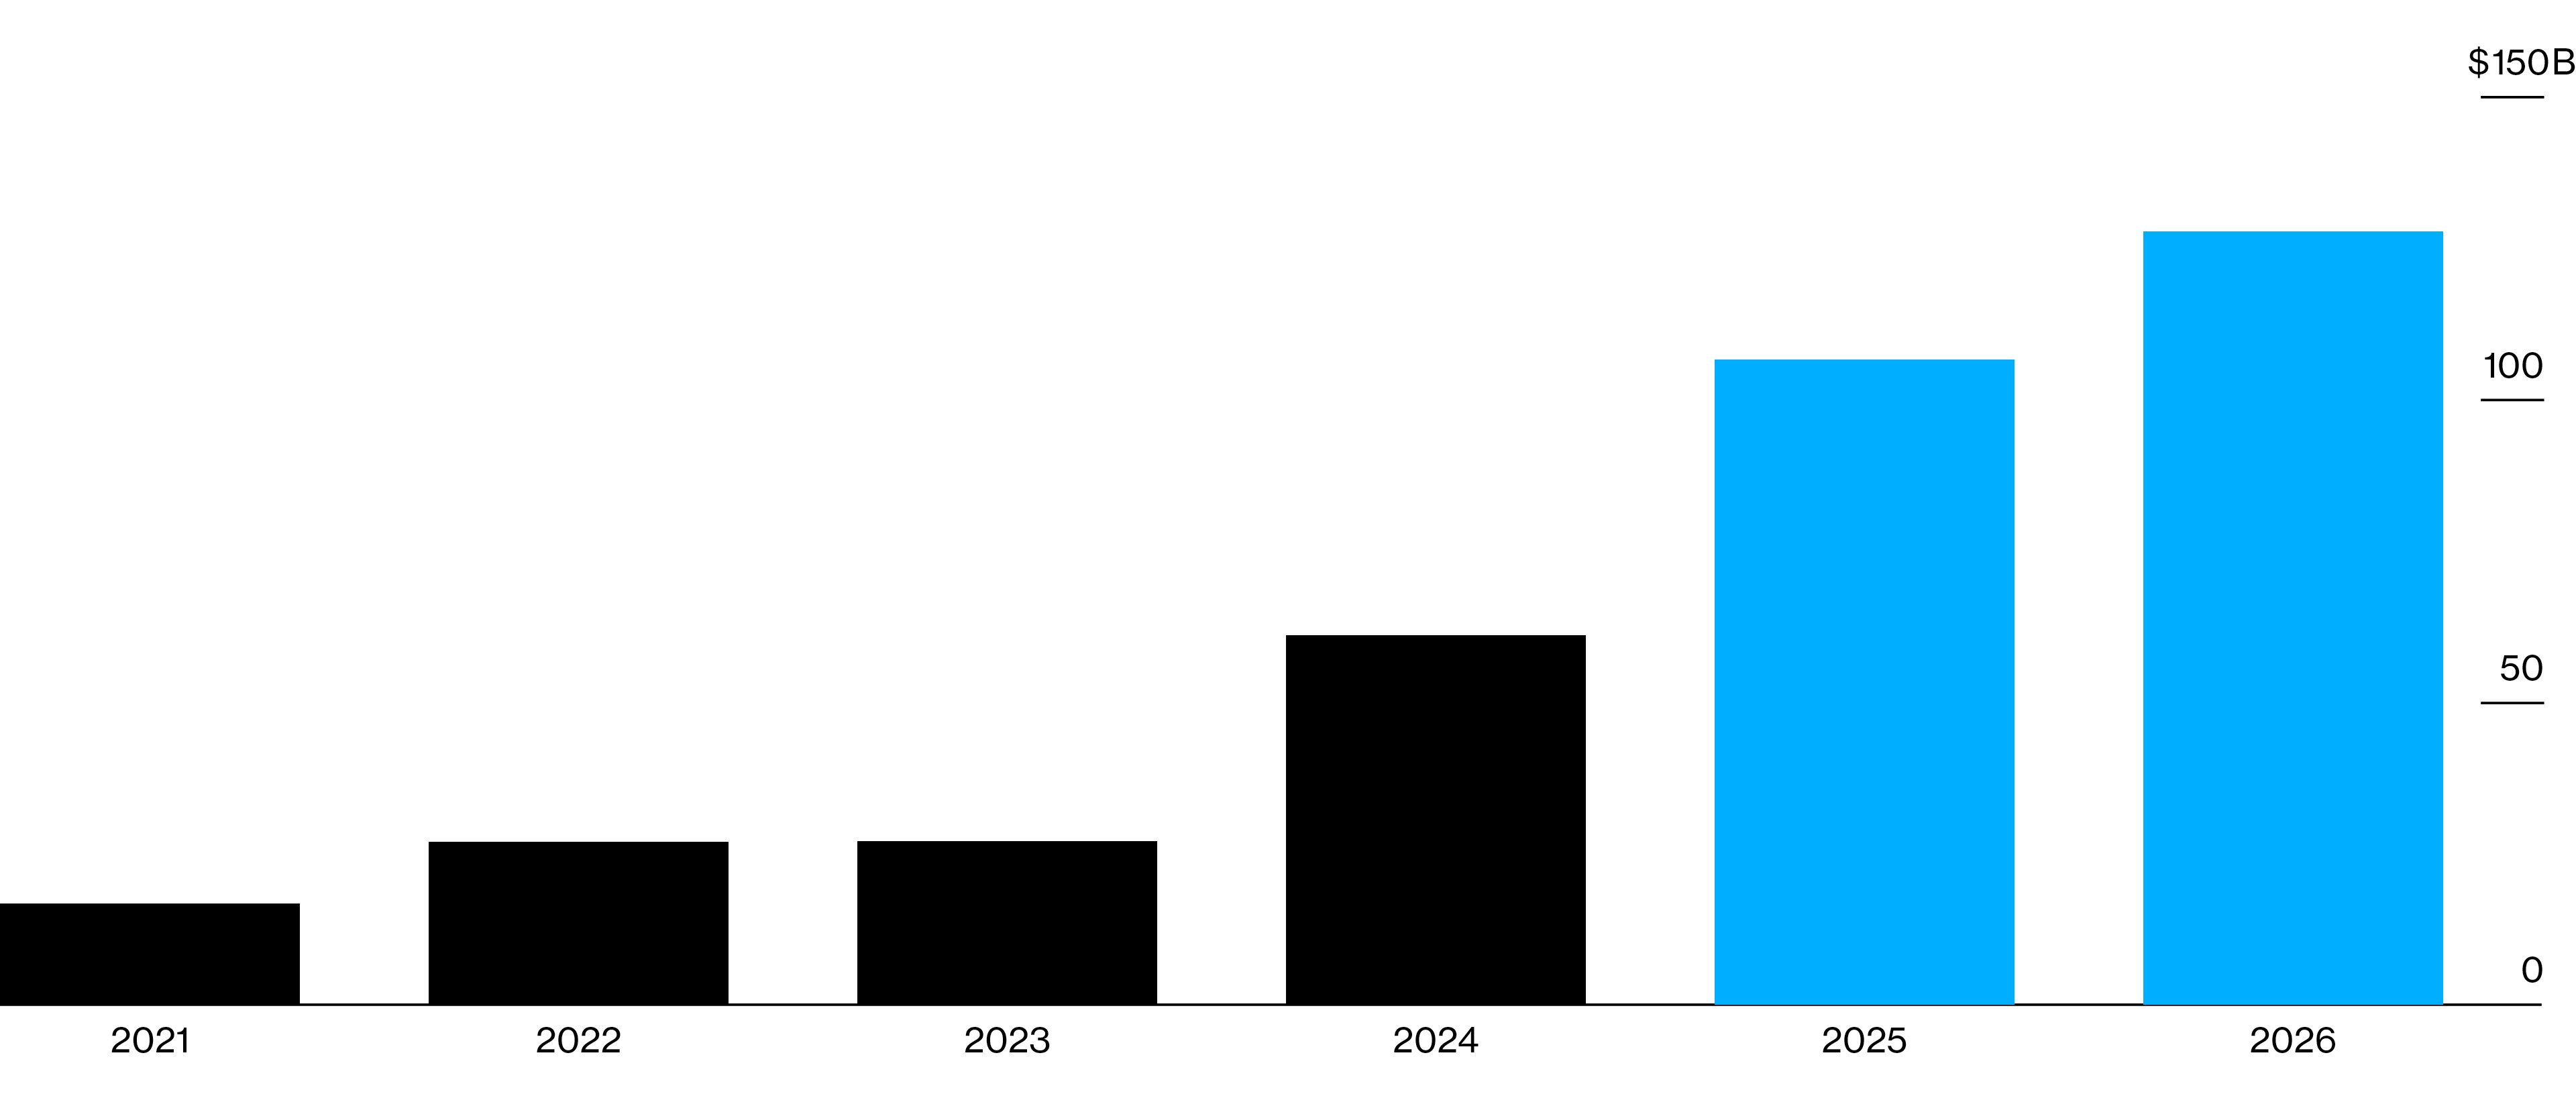
Figure 5. Nvidia’s (NVDA 0.00%↑) Data Center Revenue Is Elevated Given The Artificial Intelligence Mania.
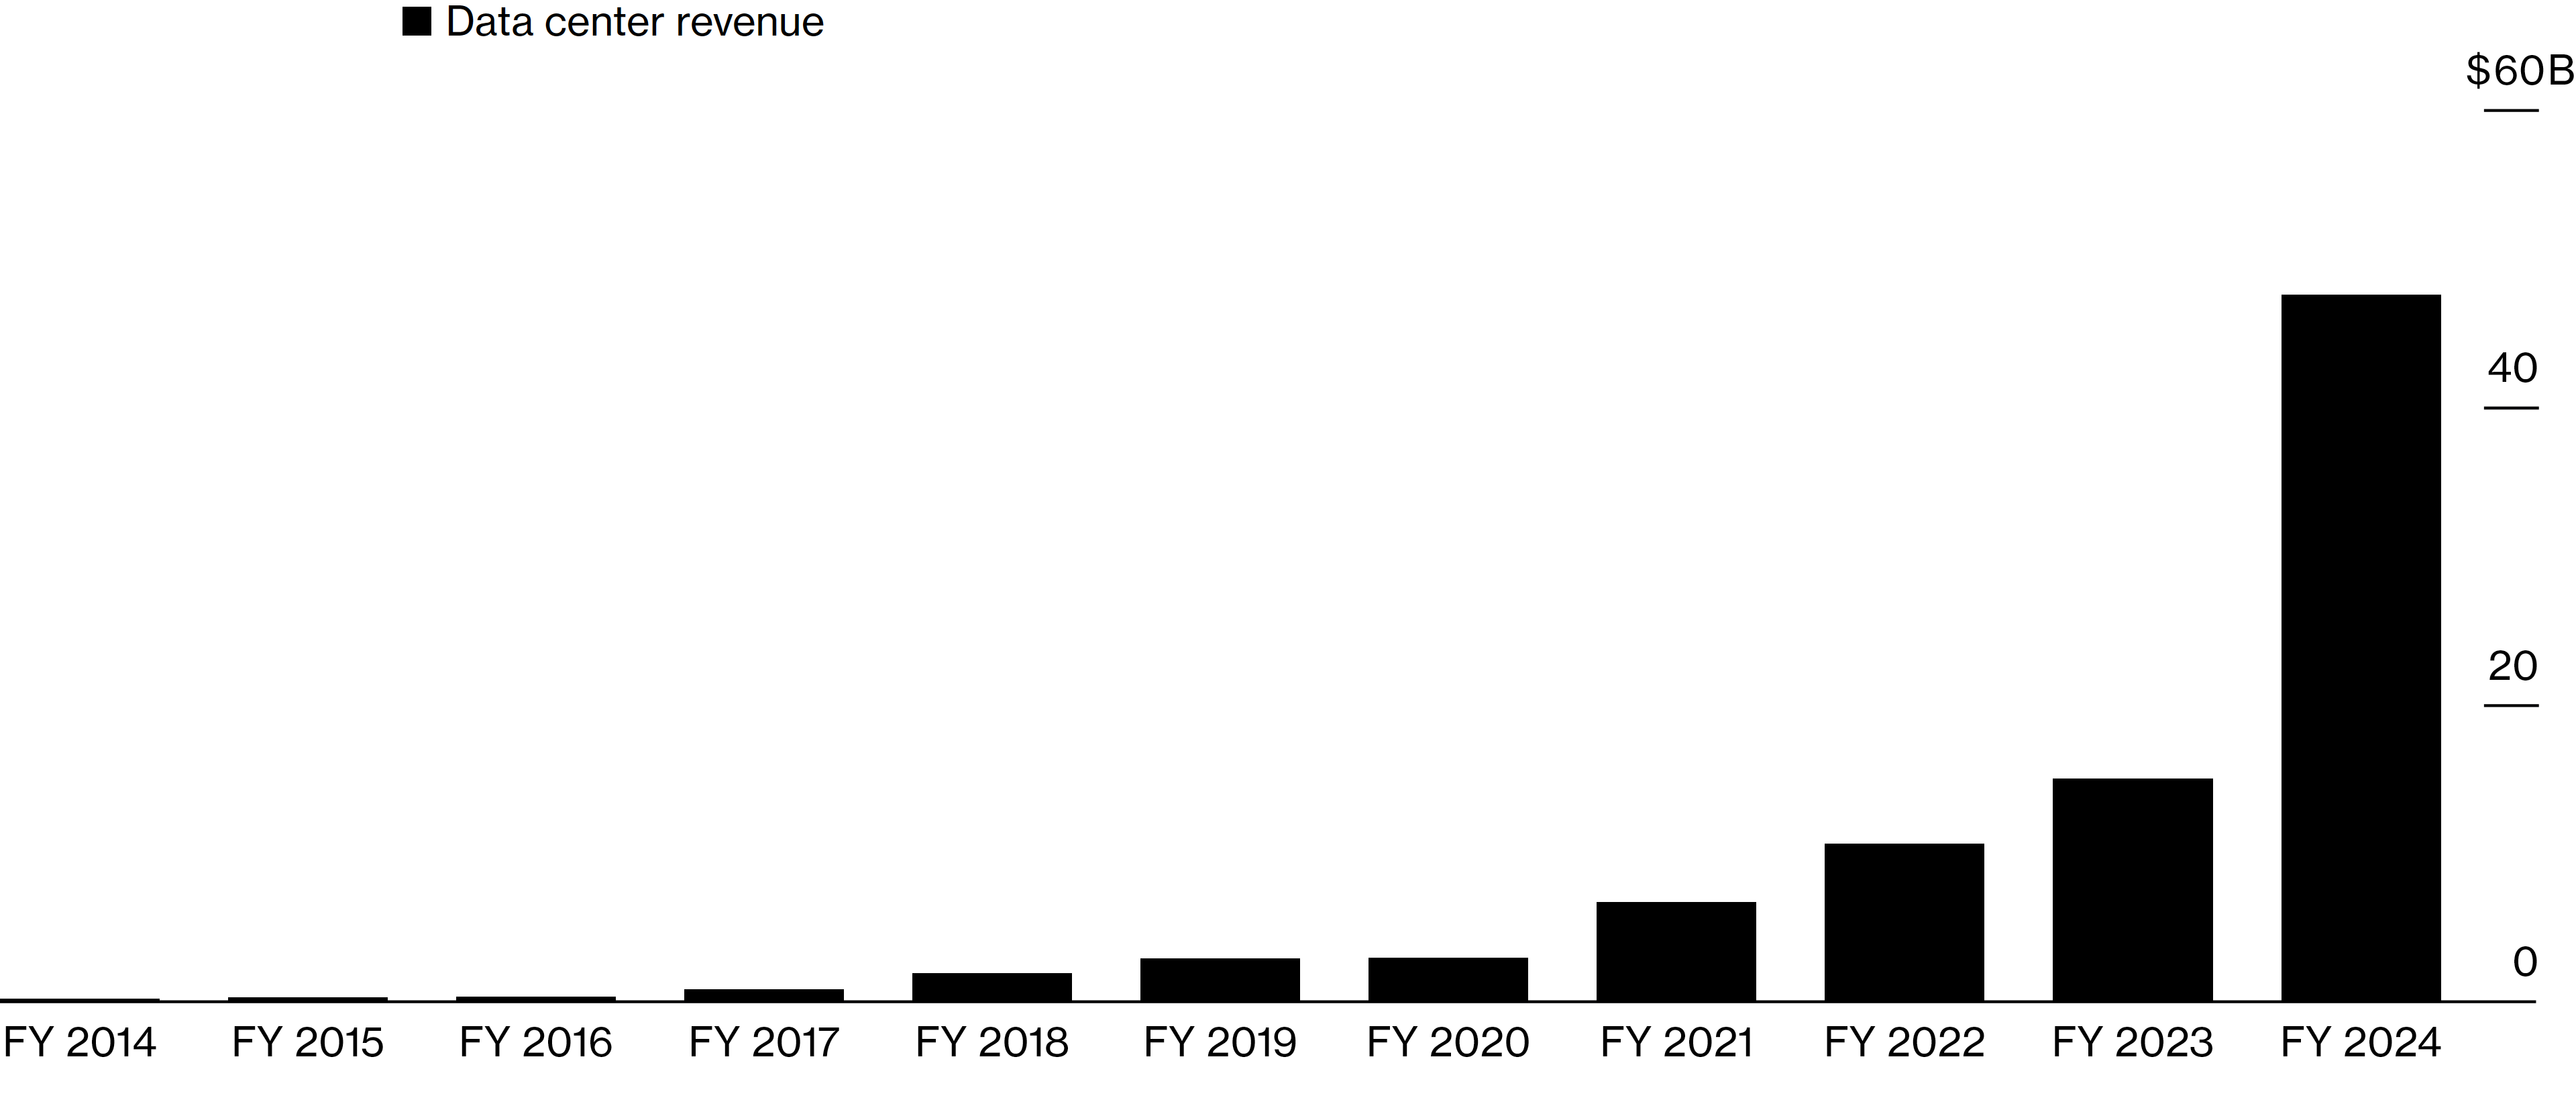
Figure 6. DB Gross US Tech Equity Futures ER Index.
[ Left Y-axis: Index data. (🟦) | Right Y-axis: Volatility of the index. (🟥) ]
![[ Left X-axis: Index data. (🟦) | Right X-axis: Volatility of the index. (🟥) ] | Data as of 03/01/2024 market close. |](https://substackcdn.com/image/fetch/$s_!2WWx!,f_auto,q_auto:good,fl_progressive:steep/https%3A%2F%2Fsubstack-post-media.s3.amazonaws.com%2Fpublic%2Fimages%2F0f1b3ba4-29e6-4d30-8b20-cde13b2f3304_3800x1929.png "[ Left X-axis: Index data. (🟦) | Right X-axis: Volatility of the index. (🟥) ] | Data as of 03/01/2024 market close. |")
Nvidia Is The Main Hardware Seller Of The Current AI Mania/Rush. ( Nvidia’s Hardware Monopoly Can Be Compared To The Shovel Sellers Of The 1820s Gold Rush )
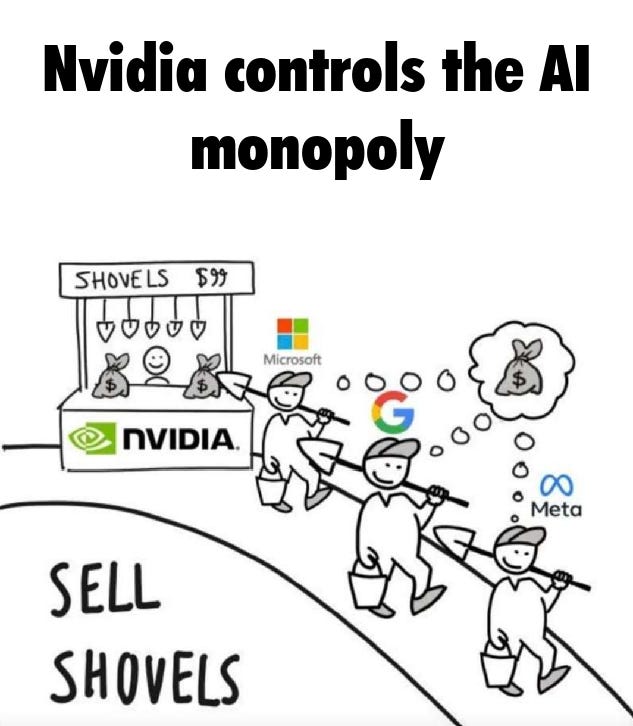
Figure 7. The Projected Energy Usage By Data Centers By Dominion Energy (D 0.00%↑) Portraits The Artificial Intelligence Mania.

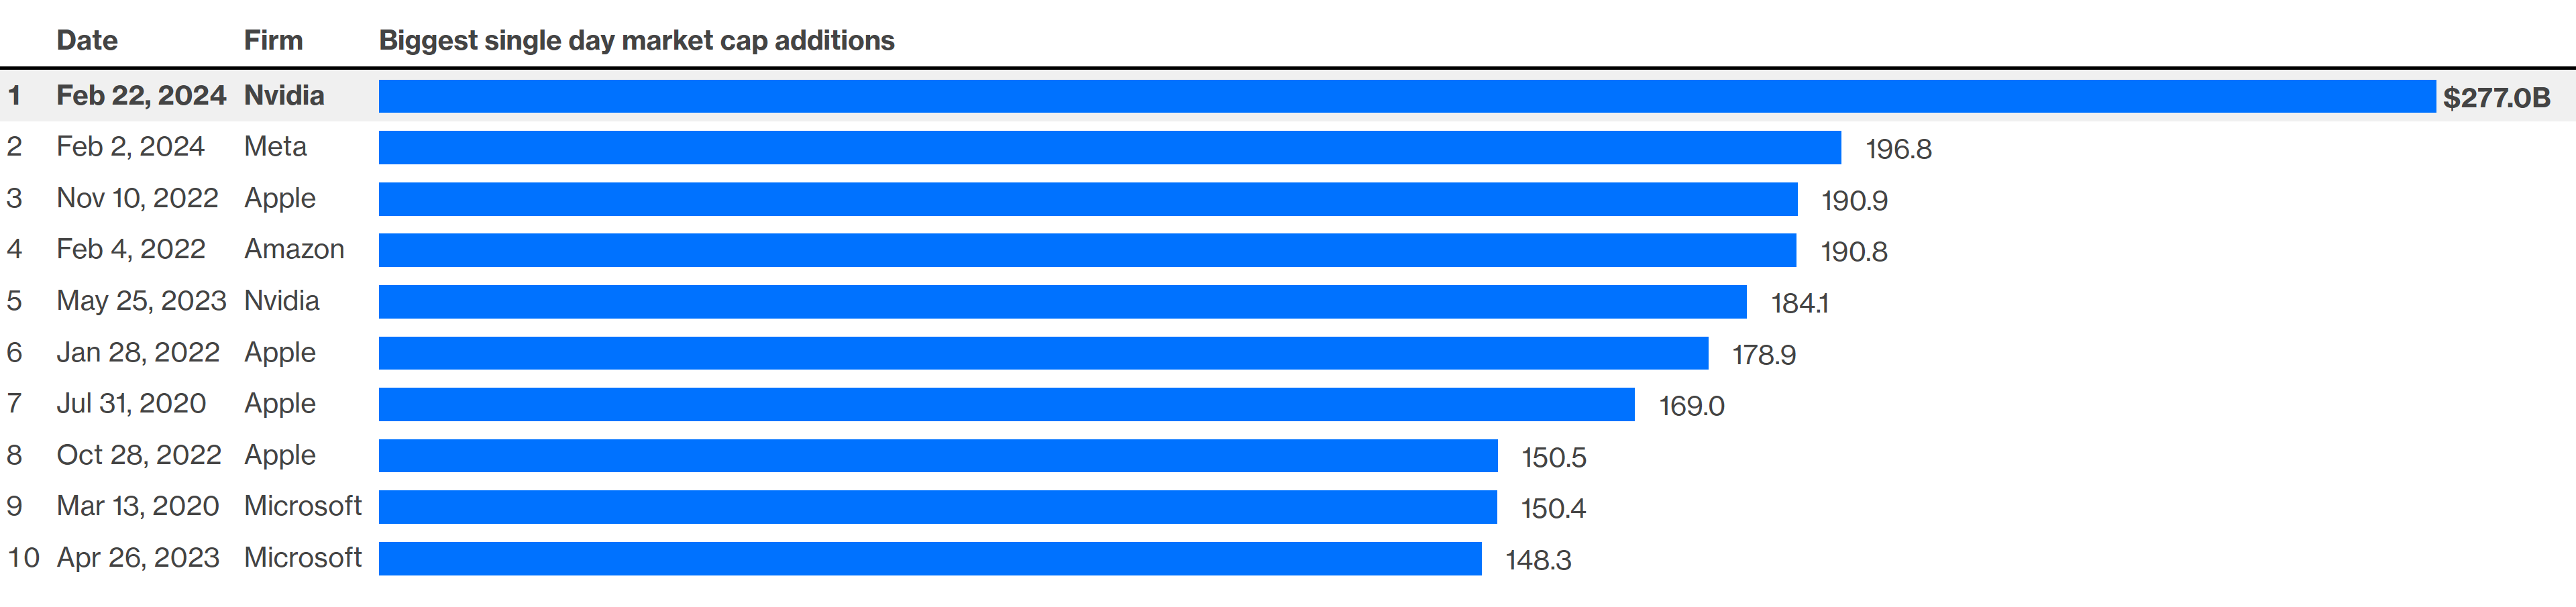
Figure 8. The Stock Of Nvidia (NVDA 0.00%↑) Holds Markets’ Biggest Single-Day Market Capital Increase.
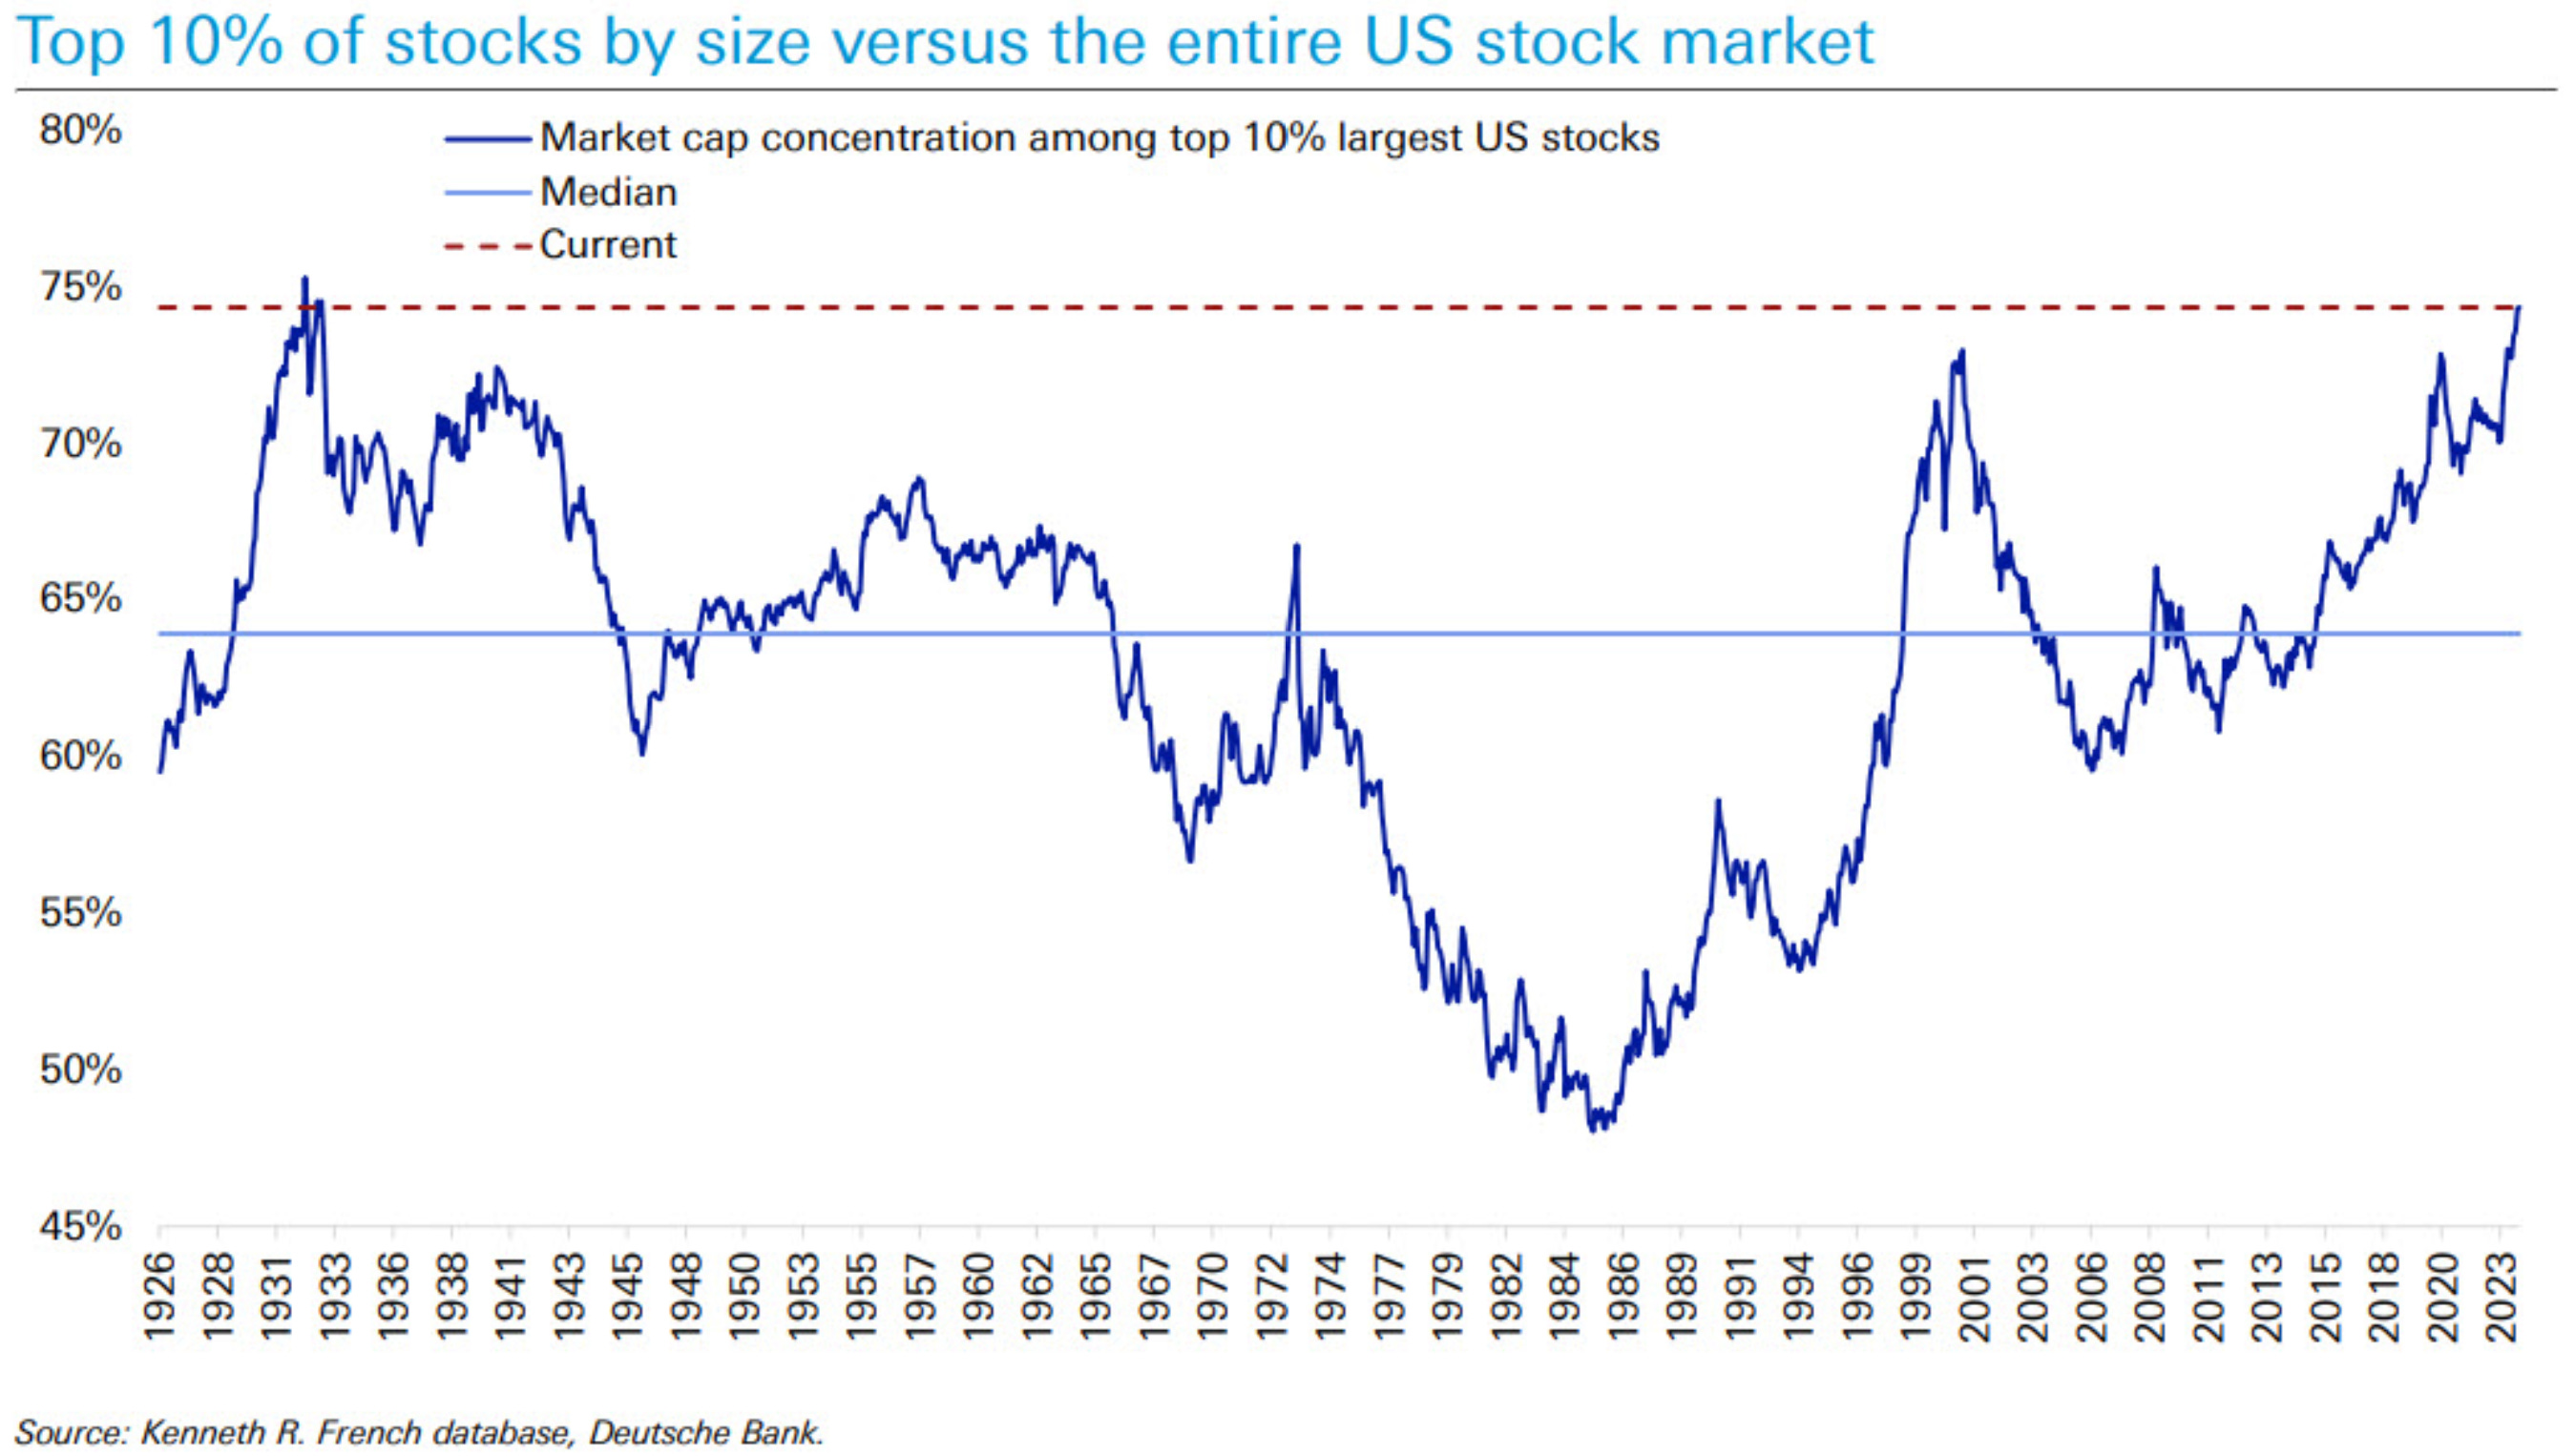
The projected increases in energy usage should enhance the energy sector’s (XLE 0.00%↑) earnings in the long run. Markets are literally at 1929 levels of hedging concentration, as shown before, but the next chart illustrates it better.
Figure 9. Markets’ Hedging Concentration Almost Surpasses 1929 Highs.
Economists have lowered recession forecasts given the job market growth that keeps surprising economists given the recent spike in the previously shown layoff statistics led by the tech sector. Others have discarded recession forecasts.
Figure 10. Economists Lift United States’ Growth & Spending Projections.
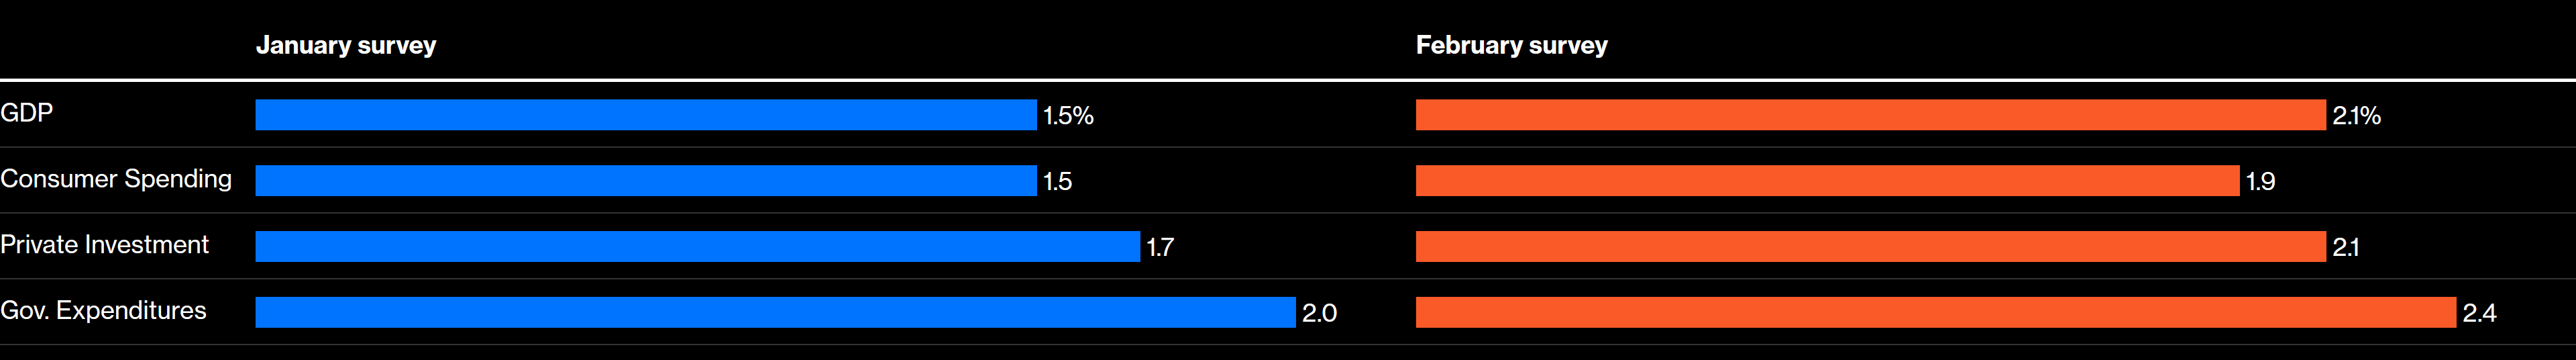
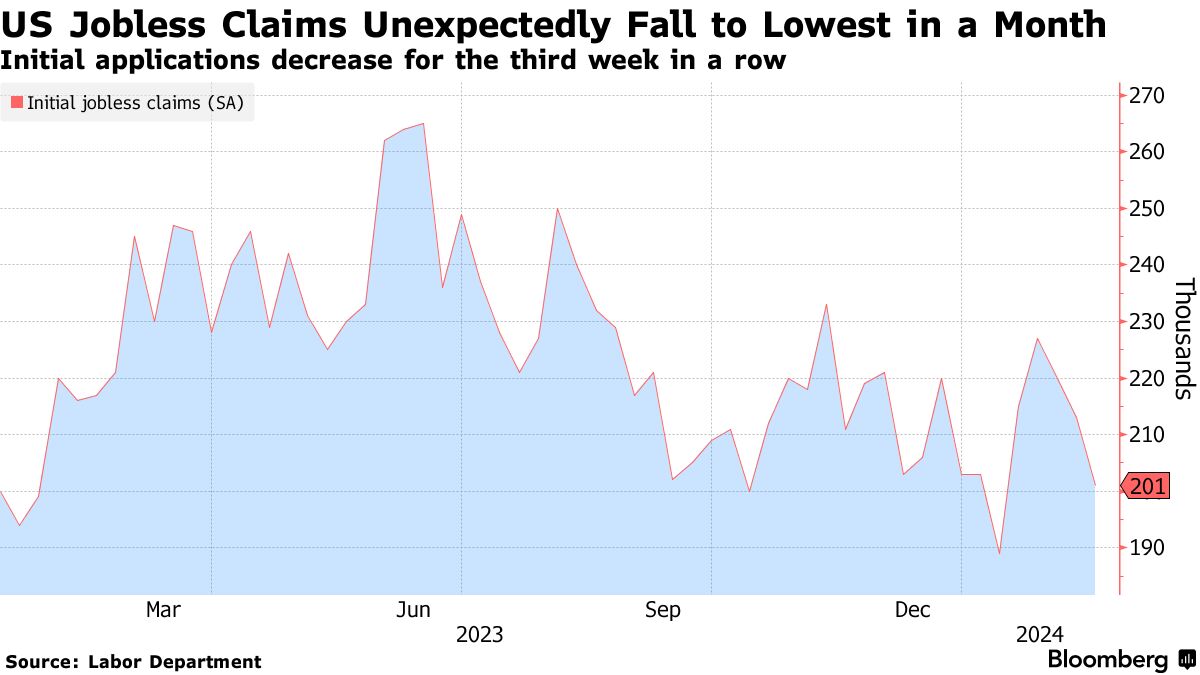
Figure 11. Jobless Claims Fall Despite The Recent Spike In Tech Sector (QQQ 0.00%↑XLK 0.00%↑) Layoffs.
Figure 12. Strong Labor Market Sets Monetary Policy To Be Focused On Price Stability.
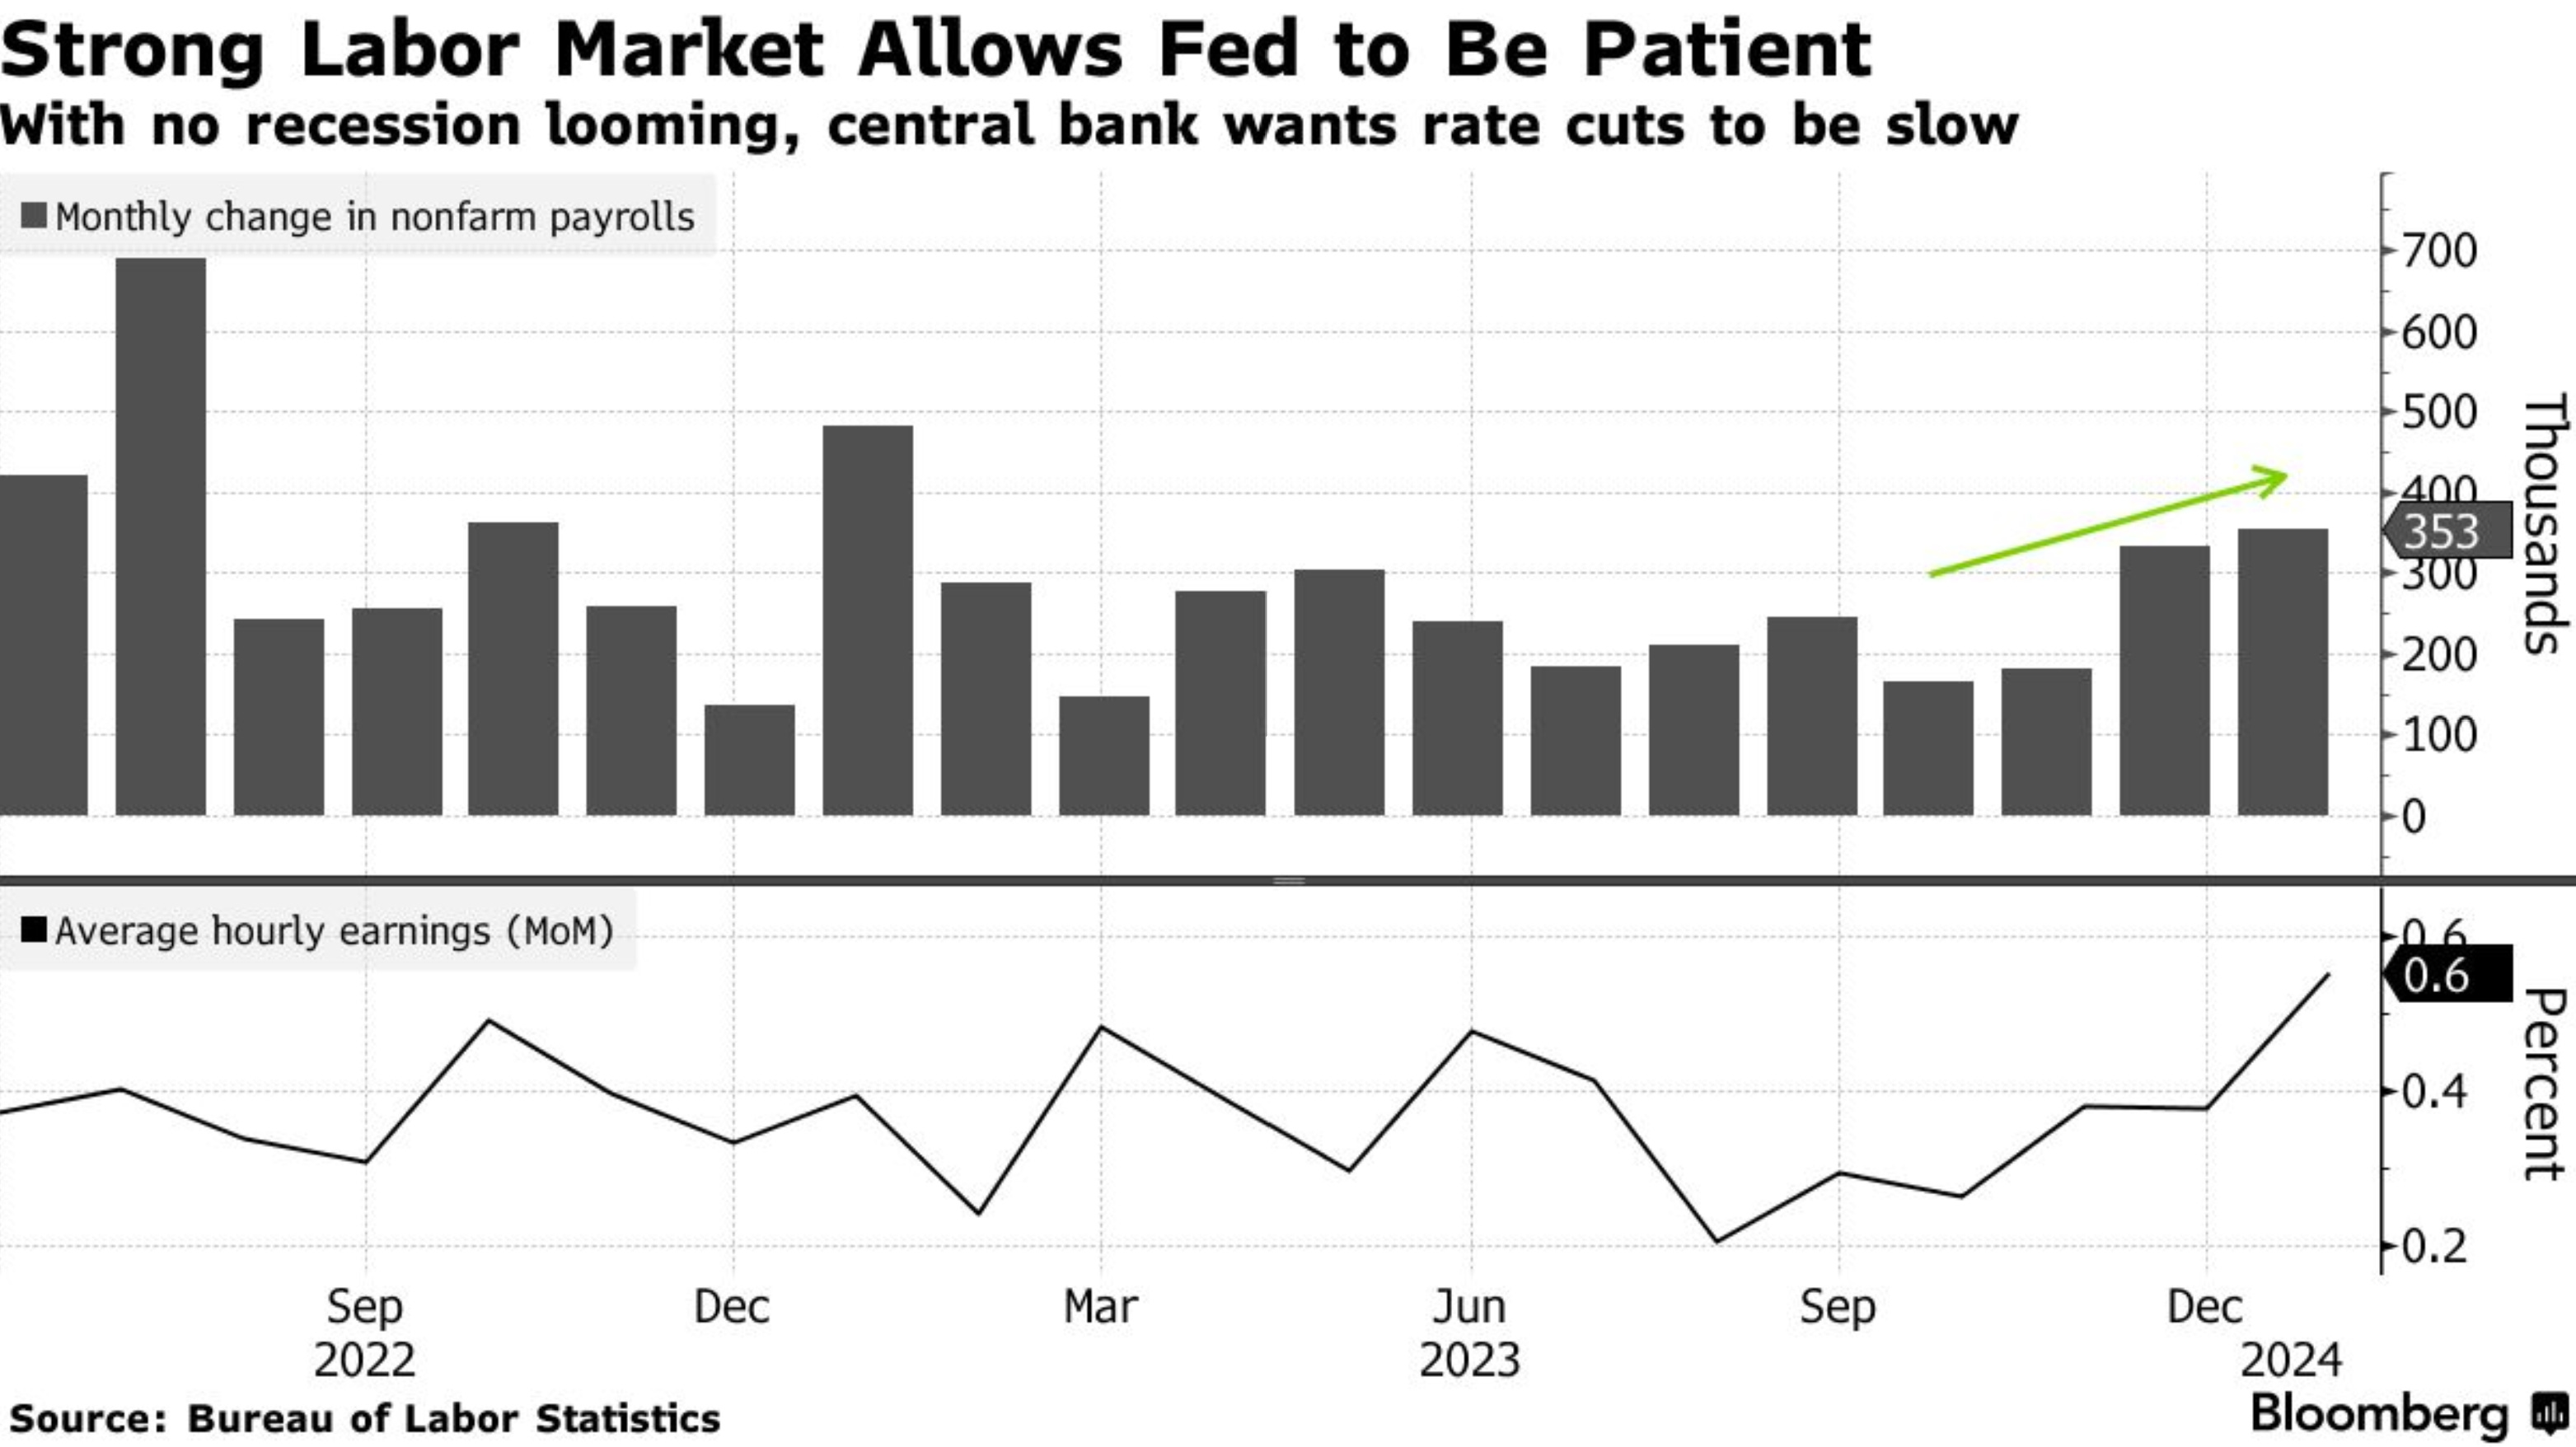
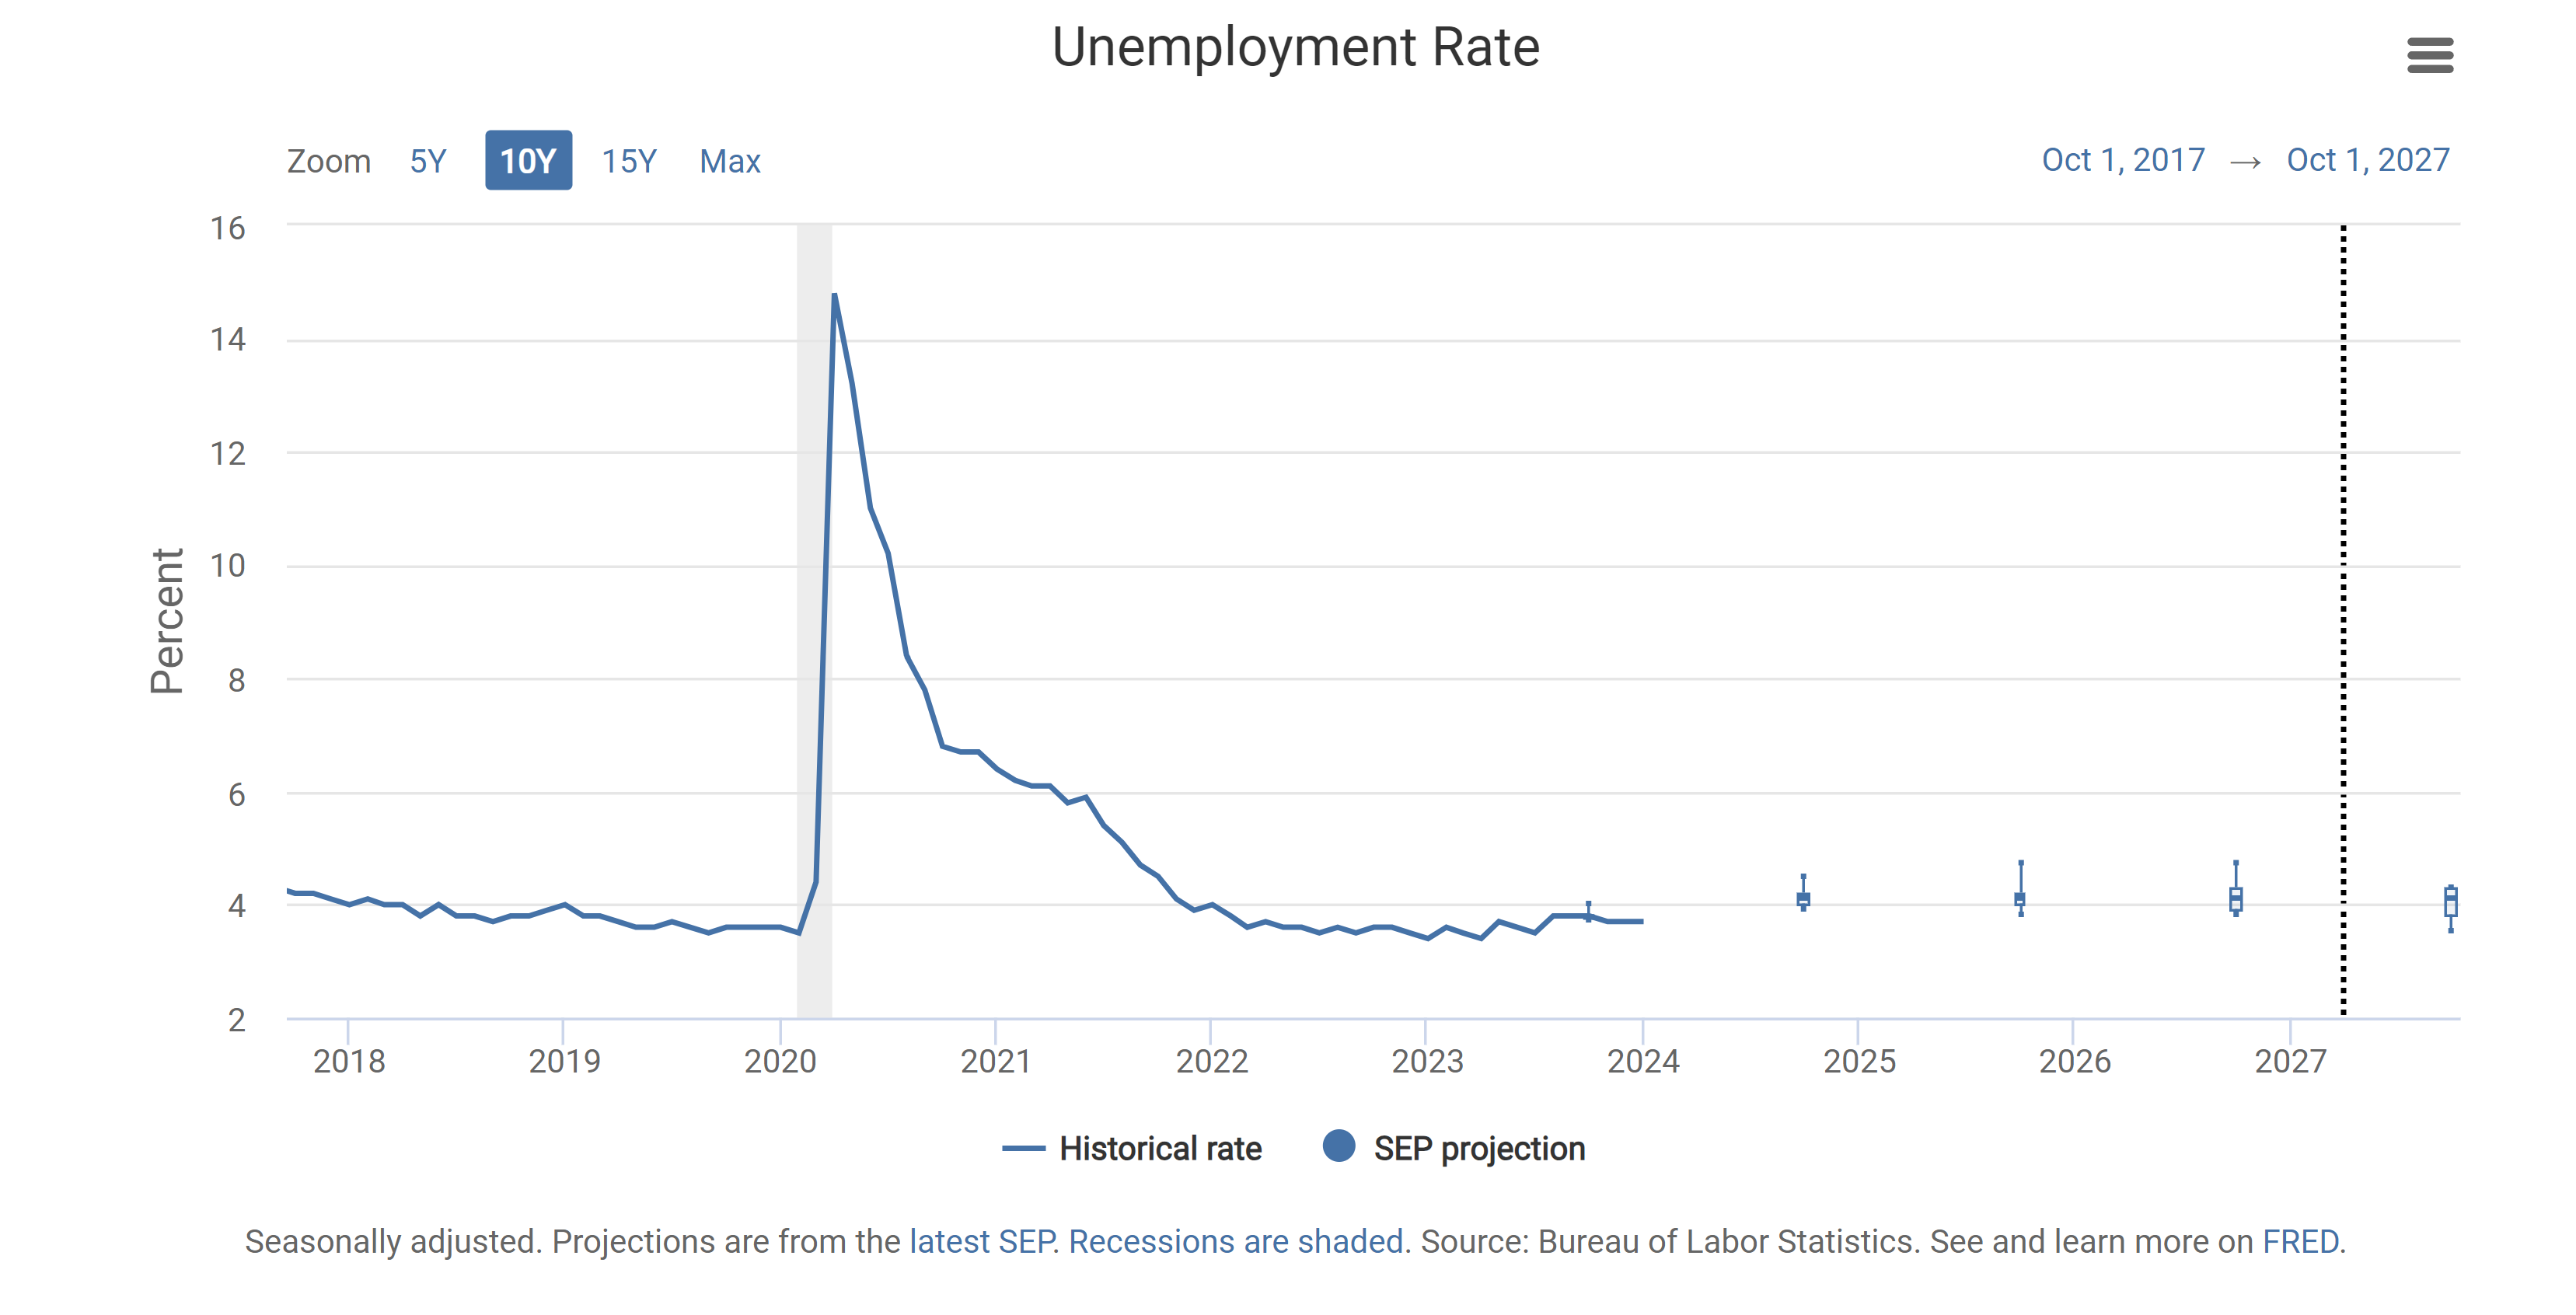
Figure 13. FOMC Officials’ Projections Over United States’ Unemployment Rate.
The United States’ job market remains resilient even with the previously mentioned and shown uptick in tech sector (QQQ 0.00%↑XLK 0.00%↑) layoff statistics; although consumer spending keeps shifting, but consumers’ spending is performing as expected in September of last year, the plausible shift of consumers’ spending has been and keeps materializing. Consumers have been and keep shifting discretionary spending towards utilities and services, which pushes these goods and services prices higher, as reflected in the inflation statistics.
Figure 14. United States’ Supercore Consumer Price Index Statistics.
 | Not Seasonally Adjusted")
Figure 15. United States’ Core & Non-Core Consumer Price Index Statistics.
 | Not Seasonally Adjusted")
It’s quite remarkable that core and supercore inflation statistics have upticked more than non-core inflation statistics, which is something that FOMC officials should be attentive to. Reflation remains something to which markets should be attentive; as explained in the Twitter account in a thread, reflation may stop rate cuts from happening, which will likely BTFD markets, mainly sectors that have been front-running the market-priced rate path in the SOFR market.
Figure 16. Markets Expect Six Rate Cuts By July 2025.

Figure 16. Economists’ Expectations Are For Rate Cuts Starting In June.
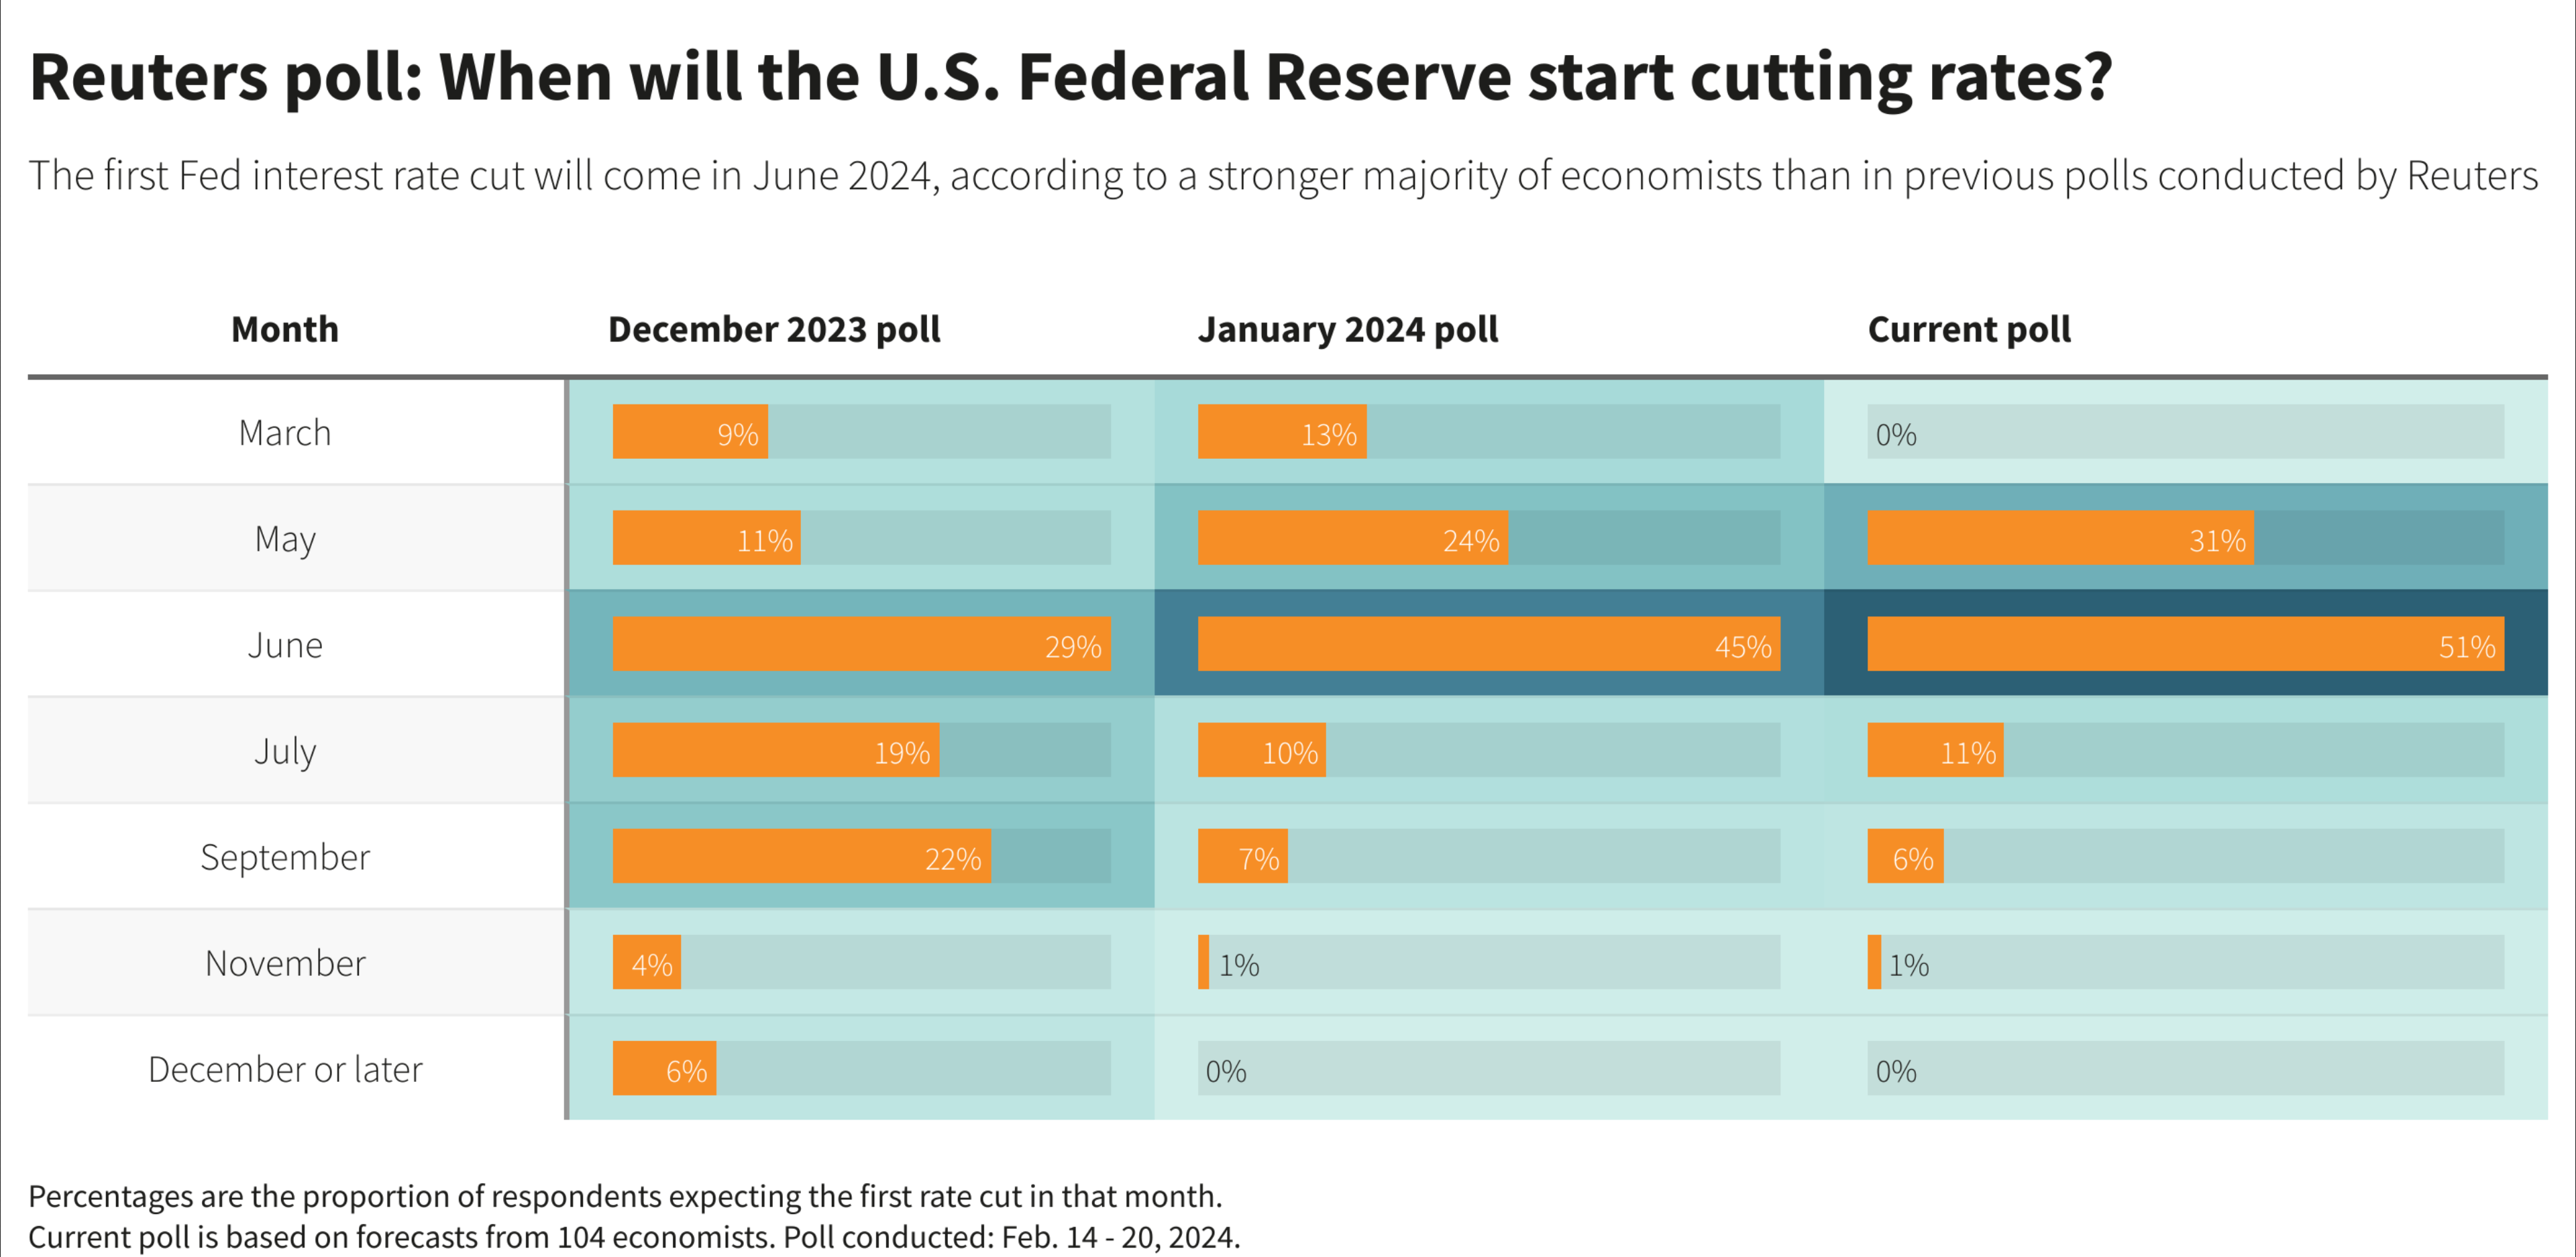
Every 50bps rate cut ( every 1% decline in TSY (TTT 0.00%↑) yields would increase oil prices by 10% at the most optimistic rate ) represents roughly a five to six percent increase in oil prices ( USL 0.00%↑); energy price reflation, given demand-driven inflationary pressures due to rate cuts, is something that markets (DIA 0.00%↑SPY 0.00%↑QQQ 0.00%↑IWM 0.00%↑) should be attentive to as energy prices drive the rest of the goods’ prices. Another factor to keep in mind is that the ongoing supply-chain disruptions haven’t yet been reflected in inflation statistics.
Figure 17. Global Supply Chain Disruption Map.

Figure 18. Vessels Continue To Not Pass Through The Suez Canal.

Figure 19. Vessels Continue To Not Pass Through Bab El-Mandeb Strait.

Figure 20. Vessels Continue To Re-Route Through Cape Of Good Hope.

Figure 21. As Shown Before, The Supply Chain Disruptions' Effect In Shipping Costs Have A Long Term Impact In Inflation Statistics.

As explained before, current inflationary pressures remain demand-driven and can be controlled with a 25 basis point hike; forward supply-driven inflationary pressures, given the supply-chain disruptions, will likely send inflation way higher than the FOMC’s price stability target, although the probability of a Volcker-like scenario is lower than a Greenspan-like scenario. Markets are far more dovish than FOMC officials are; the last FOMC minutes were hawkish, somewhat dovish given the comment over plausible changes in Quantitative Tightening; in my opinion, it wouldn’t be a surprise that the FOMC keeps rates at current levels given current and forward inflationary pressures.
Figure 22. FOMC Officials’ Rate Projections.
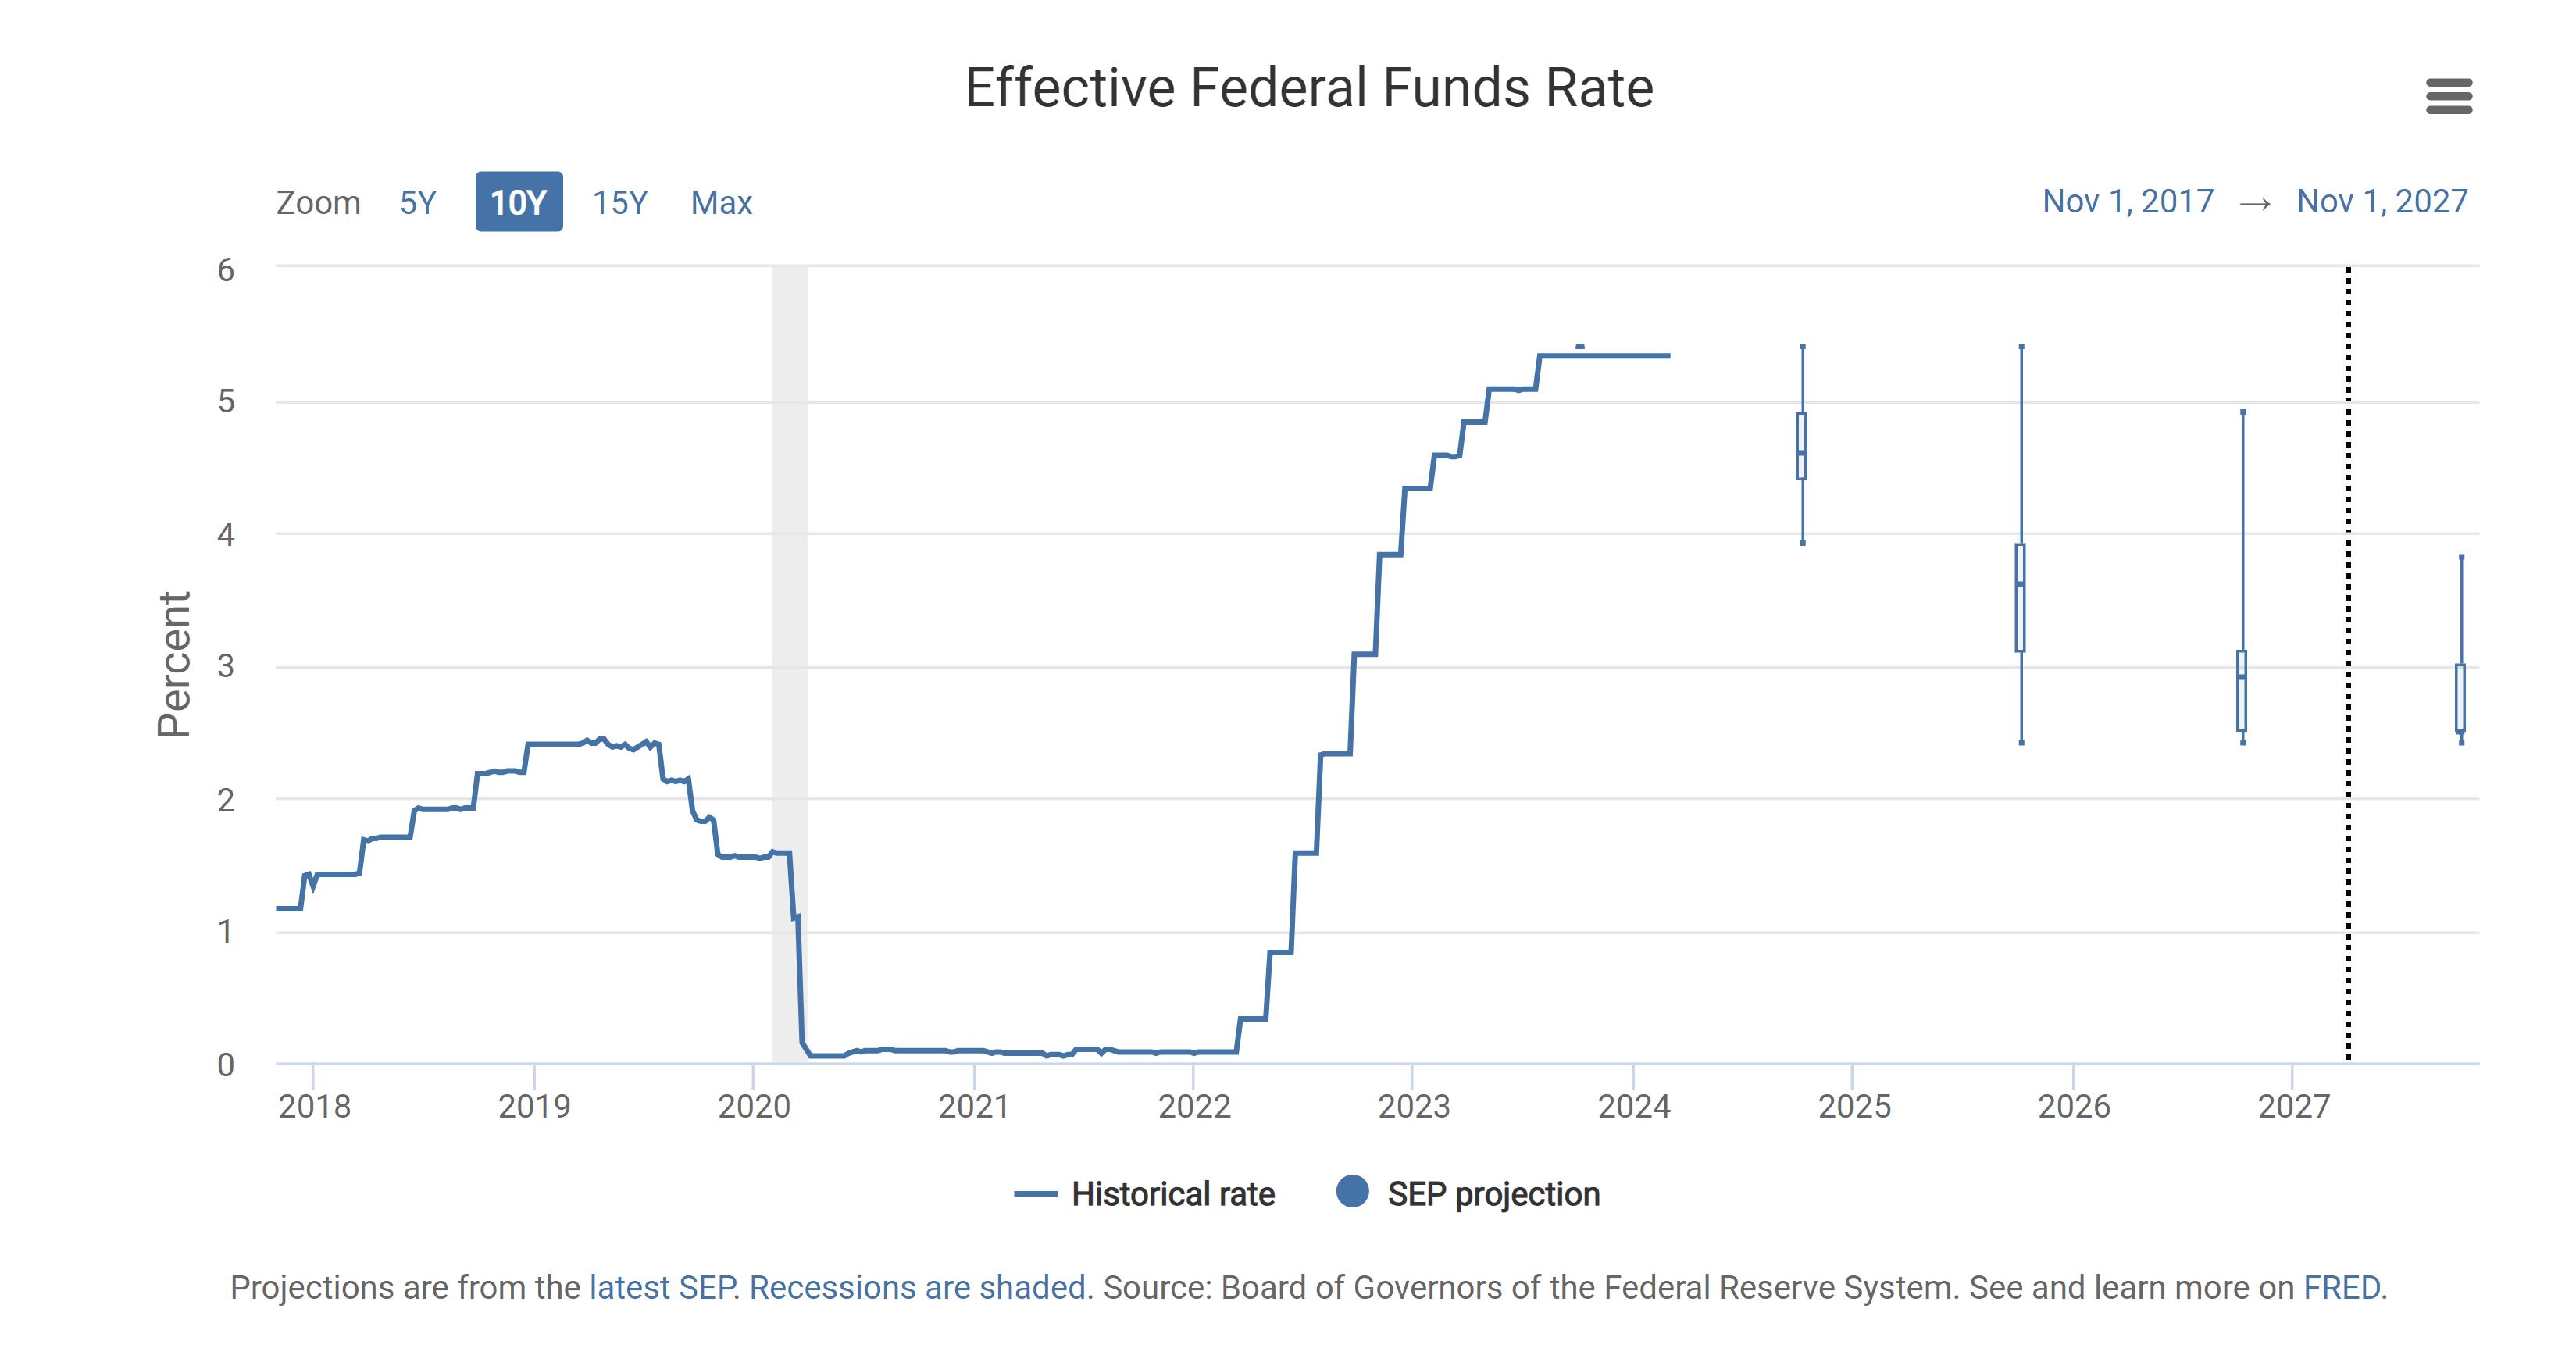
Figure 23. Hawkishness Remains Among FOMC Officials.
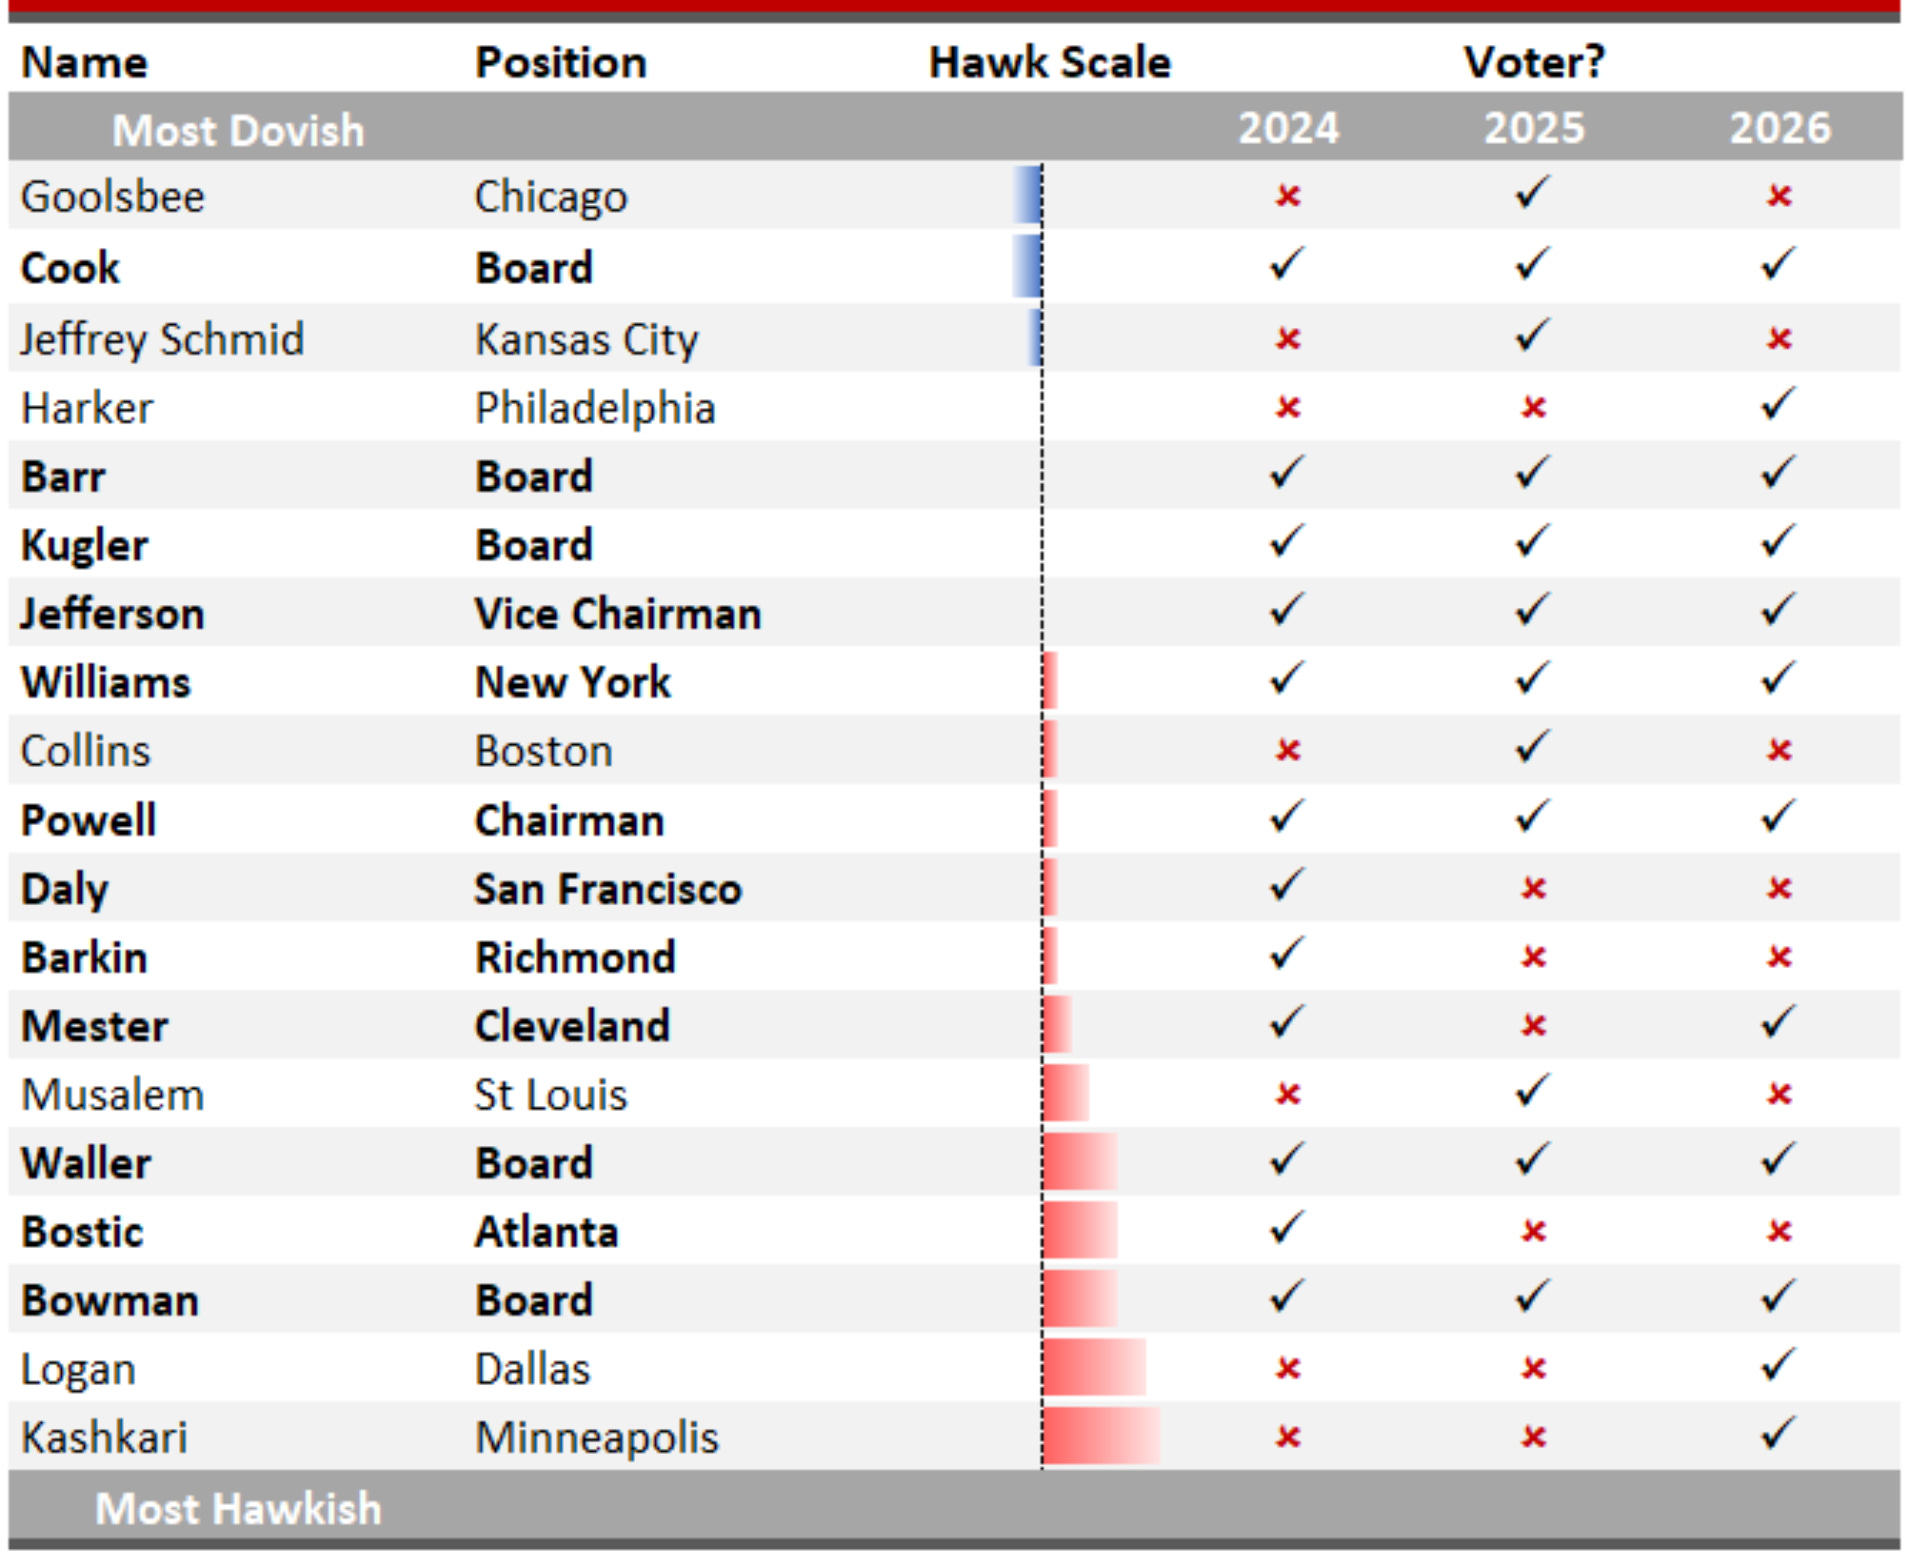
FOMC Bostic sees good evidence that inflation is trending downward and is keen on averting unnecessary damage to the labor market.
FOMC Harker was an early advocate of a pause, and his warnings against overtightening policy mark him as more sensitive to the risks to the labor market than some of his colleagues.
Chairman Powell does not want to be remembered as the Fed chair who failed to bring down inflation; now that he’s seeing clearer signs he won’t, he has pivoted to a more centrist position, emphasizing the need to move “carefully” and to minimize the economic damage from the inflation fight.
FOMC Waller was an early skeptic of the idea that inflation would be “transitory” and a supporter of frontloading interest-rate hikes, marking him a hawk. In recent months, as inflation has cooled, he has supported moving more carefully, in line with Powell.
FOMC Williams as vice chair of the Fed’s policy-setting committee, Williams helped Powell lead the most aggressive round of rate hikes in 40 years. Of late he has said the Fed may have hiked rates enough, but with inflation still high, is not about to cut them.
FOMC Jefferson appears to weigh the risks of over- and under-tightening increasingly equally.
Vice Chair of Supervision Barr’s writ is primarily financial regulation. When he does speak about monetary policy he has increasingly signaled he feels the Fed’s rate hikes are done, or nearly so.
FOMC Cook sees risks to both the Fed’s price stability mandate and its mandate to foster full employment.
FOMC Kugler joined the Fed in September 2023 and gave her first policy speech in February 2024, at which she demurred when asked her view on rate cuts this year. Her sharp focus on inflation suggests she may lean hawkish, but for now we put her in the same centrist camp as Fed Chair Powell and the majority of her colleagues.
FOMC Daly: A labor economist by training, Daly has repeatedly called for fighting inflation, but as gently as possible.
FOMC Collins has continued to focus on the need for more rate hikes to bring down inflation, but sees risks lately nearer to balanced.
FOMC Austan Goolsbee says inflation is coming down faster than expected, allowing the Fed to pay more attention to its mandate to foster maximum employment.
FOMC Mester has said she sees somewhat more persistent inflation than most of her fellow Fed policymakers, but of late has edged away from her previous insistence that more tightening will be needed.
FOMC Barkin remarks continue to show he is worried about high inflation.
FOMC Kashkari swung from being the Fed’s most dovish policymaker in 2021 to its most hawkish a year later. He no longer appears to be the most hawkish, but he has not retreated much.
FOMC Logan says the Fed needs to take financial conditions into account as it sets rates, and her worries about excess inflation remain palpable.
FOMC Bowman has backed away from her previously held view that another rate hike will likely be needed, and now says falling inflation will eventually necessitate a reduction in the policy rate.
Source: Reuters
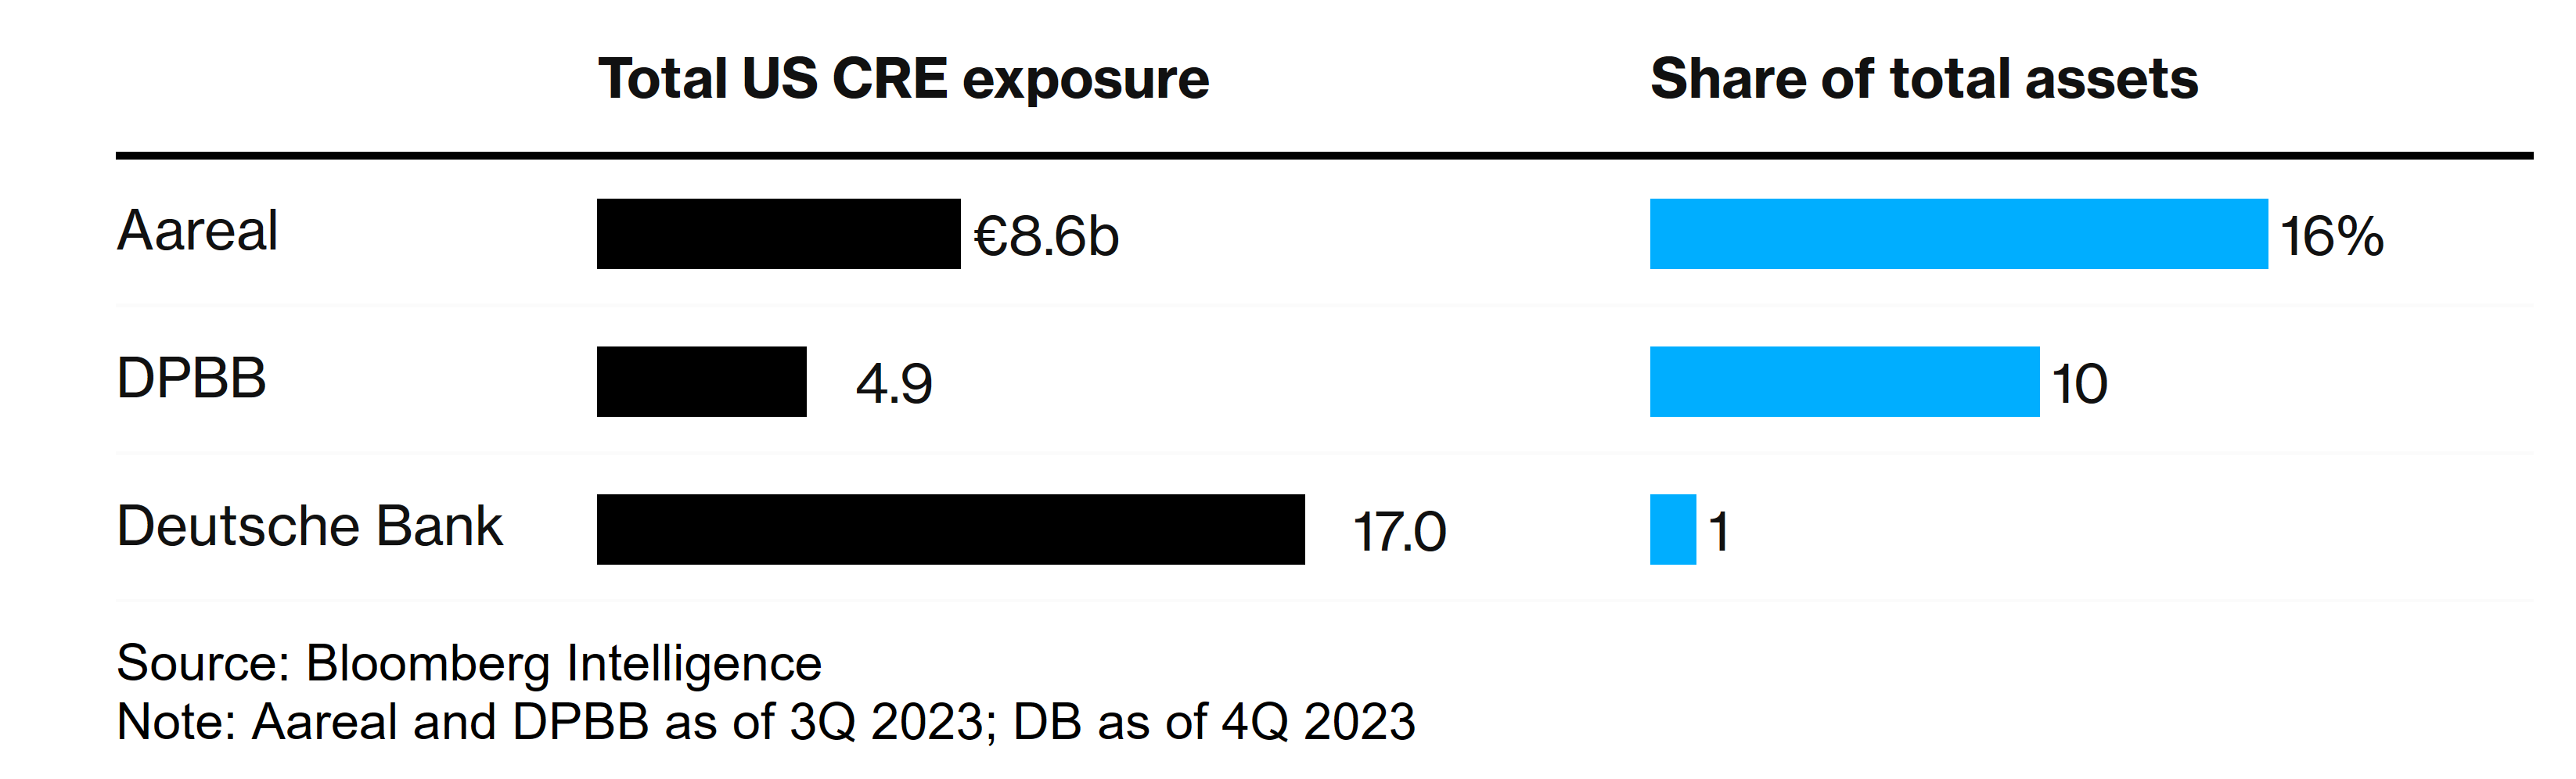
The soon-ending emergency measures by the Federal Reserve will likely cause turmoil in the United States’ TSY (TLT 0.00%↑) market and, consequently, the United States’ financial sector (XLF 0.00%↑), given their correlation. Emerging markets’ financial sector remains a bull niche given emerging markets’ financial institutions’ higher excess savings compared to the United States’ financial institutions and given emerging markets’ financial sector’s low exposure to the United States’ CRE market. There are exceptions, but Europe’s biggest bank’s (DB 0.00%↑) exposure to the United States’ CRE market is 1% of total assets; markets’ malinformation and misinformation between DPBB and Deutsche Bank generated turmoil in Europe’s biggest bank’s shares, which Deutsche Bank has nothing to do with DPBB. Deutsche Bank’s dividend increase after a strong earnings report should really give perspective on the factual situation.
Figure 24. Europe’s Biggest Bank (DB 0.00%↑) Exposure To United States’ CRE Market Represents 1% Of Total Assets.
The United States’ RE market keeps being afloat by low supply, but the United States’ CRE market keeps going lower on excess supply, the United States’ financial institutions’ (BAC 0.00%↑C 0.00%↑GS 0.00%↑JPM 0.00%↑MS 0.00%↑WFC 0.00%↑) CRE market losses keep being elevated, and the United States’ regional banks (FAZ 0.00%↑) are far more vulnerable than major financial institutions.
Figure 25. Major United States' Financial Institutions (BAC 0.00%↑C 0.00%↑GS 0.00%↑JPM 0.00%↑MS 0.00%↑WFC 0.00%↑) Are Low On Reserves For Delinquent CRE Loans.
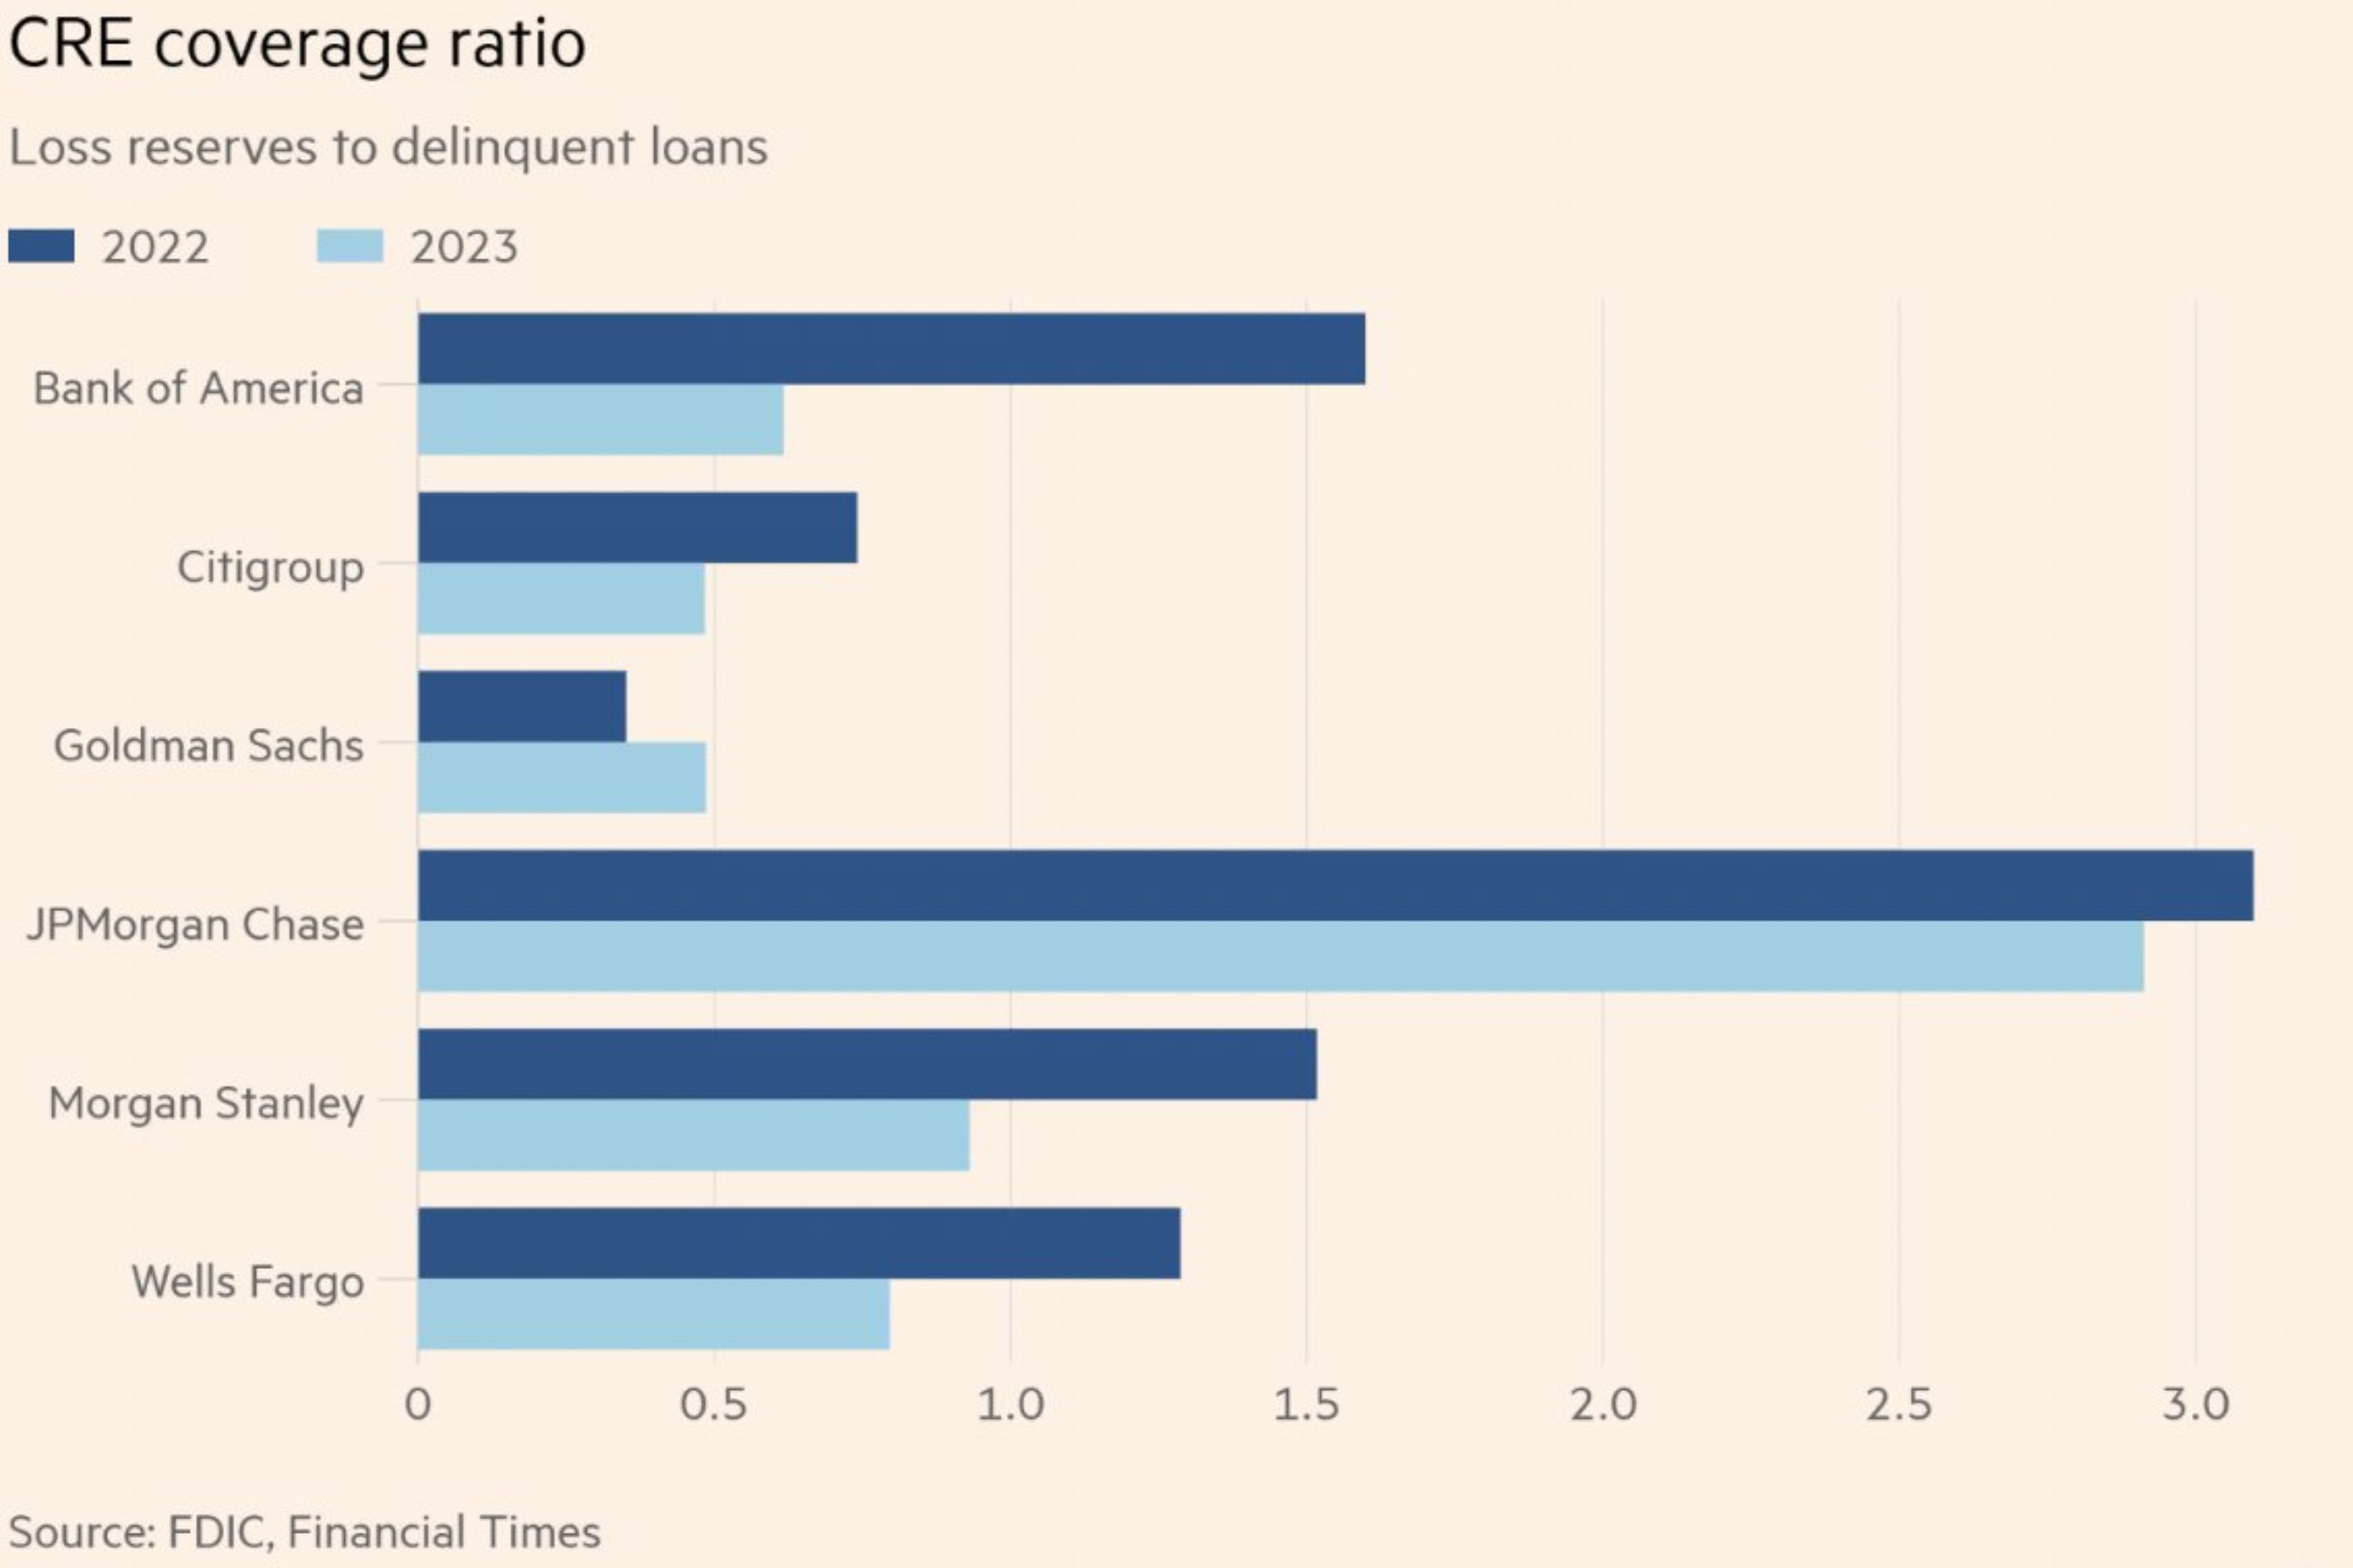
There were people saying "those financial institutions are too big to fail." to me in the past quinquennial, and I was right ( and I'm glad they said "you were right again" in the end ) about Evergrande and Credit Suisse, and I believe Brookfield is the next one to BTFD, as the CRE/CLO market continues to melt down as I expected. It wouldn't be a surprise if a major United States' financial institution (WFC 0.00%↑C 0.00%↑SCHW 0.00%↑) failed along with Brookfield, but markets and the economy would continue the same way as when Credit Suisse collapsed. These factors aren't recession vectors; new Bank of International Settlements Basel III regulation implementation will likely reduce risks in the long run given tighter capital requirements, but major United States' financial institutions (BAC 0.00%↑C 0.00%↑GS 0.00%↑JPM 0.00%↑MS 0.00%↑WFC 0.00%↑) will still face the same. The main recession vector keeps being adhered to warfare risk given the inevitable Taiwan war.
Figure 26. I Once Again Remind You Folks That Taiwan War's Global Gross Domestic Product (GDP) Impact Is Bigger Than The Global Financial Crisis Of 2008. Bigger Than The Impact Of The 2020 Pandemic & Bigger Than Current & Recent Geopolitical Conflicts/Events.
 Impact Is Bigger Than The Global Financial Crisis Of 2008. Bigger Than The Impact Of The 2020 Pandemic & Bigger Than Current & Recent Geopolitical Conflicts/Events.")
In summary, the current scenario is just optimistic in the short-term, given the compelling statistics that support the soft landing narrative, but the long-term forecast is still skewed towards recession and reflation due to factors related to current geopolitical developments and inevitable warfare. In other words, the current scenario is like fire and ice, given that a soft landing continues to be likely in the near term but unlikely in the long run.
--------------------------------------------------------------------------------------------------------------------------------------------------------------
World War Probabilities:
-------------------------------------------------------------------------------
    · Prob. War (2024) :
-------------------------------------------------------------------------------

// >
        · War Probabilities:
            / | - Probabilities of War in 2024: [ ~ 100% (±0.5) ] | \

            · Vectors:
                / | - | + Taiwan [ ~ 75% (±0.5) ] | + Ukraine [ ~ 24% (±0.5) ] | + Israel [ ~ 0.5% (±0.5) ] | + Else: [ ~ 0.5% (±0.5) ] | \

< //

-------------------------------------------------------------------------------

// >
        · Non-War Probabilities:
           / | - Probabilities of Non-War in 2024: [ ~ 0% (±0.5) ] | \

< //
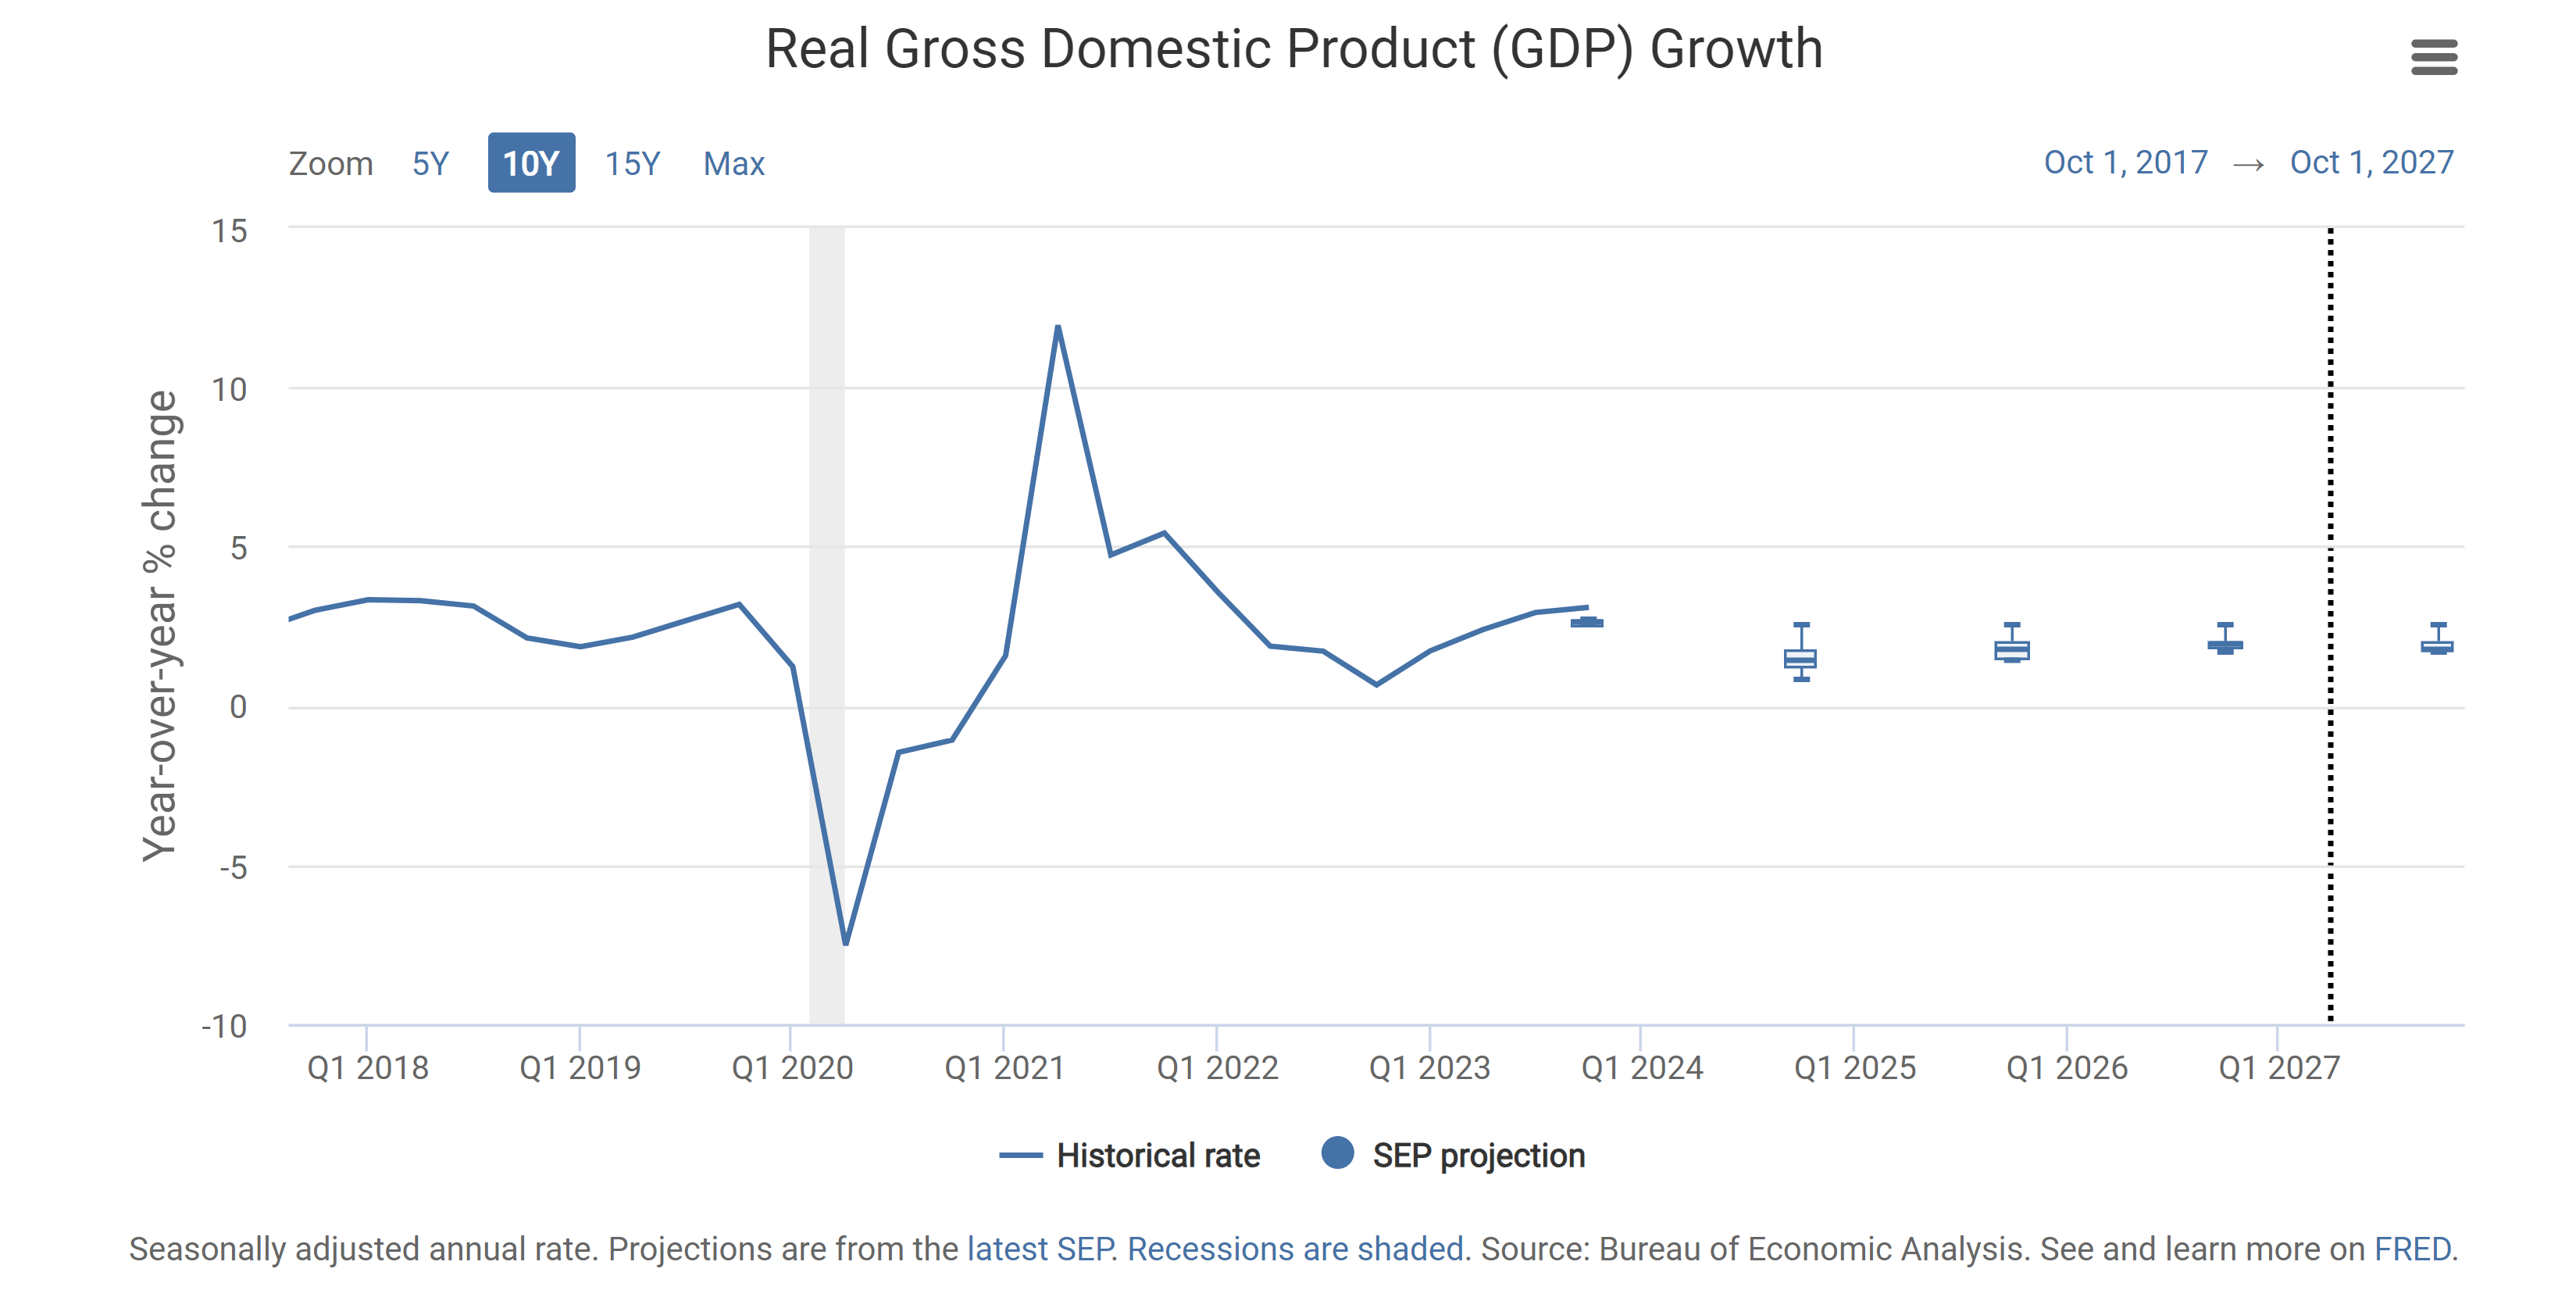
--------------------------------------------------------------------------------------------------------------------------------------------------------------This week’s Gross Domestic Product (GDP) data releases showed that growth in the United States increased at a slower but still respectable pace, in the range of FOMC officials’ projections. Gross Domestic Product (GDP) growth was mainly driven by consumers’ services spending; non-durable goods’ spending decreased, remarking the consumer spending shift from discretionary spending to utilities and services explained early in the post.
Figure 27. United States’ Gross Domestic Product (GDP) Growth Slowed But Grew At A Respectable Pace.

Figure 28. Gross Domestic Product Growth Driven By Consumers’ Services Spending.

Figure 29. FOMC Officials’ Projections Over United States’ Real Gross Domestic Product (GDP) Growth.
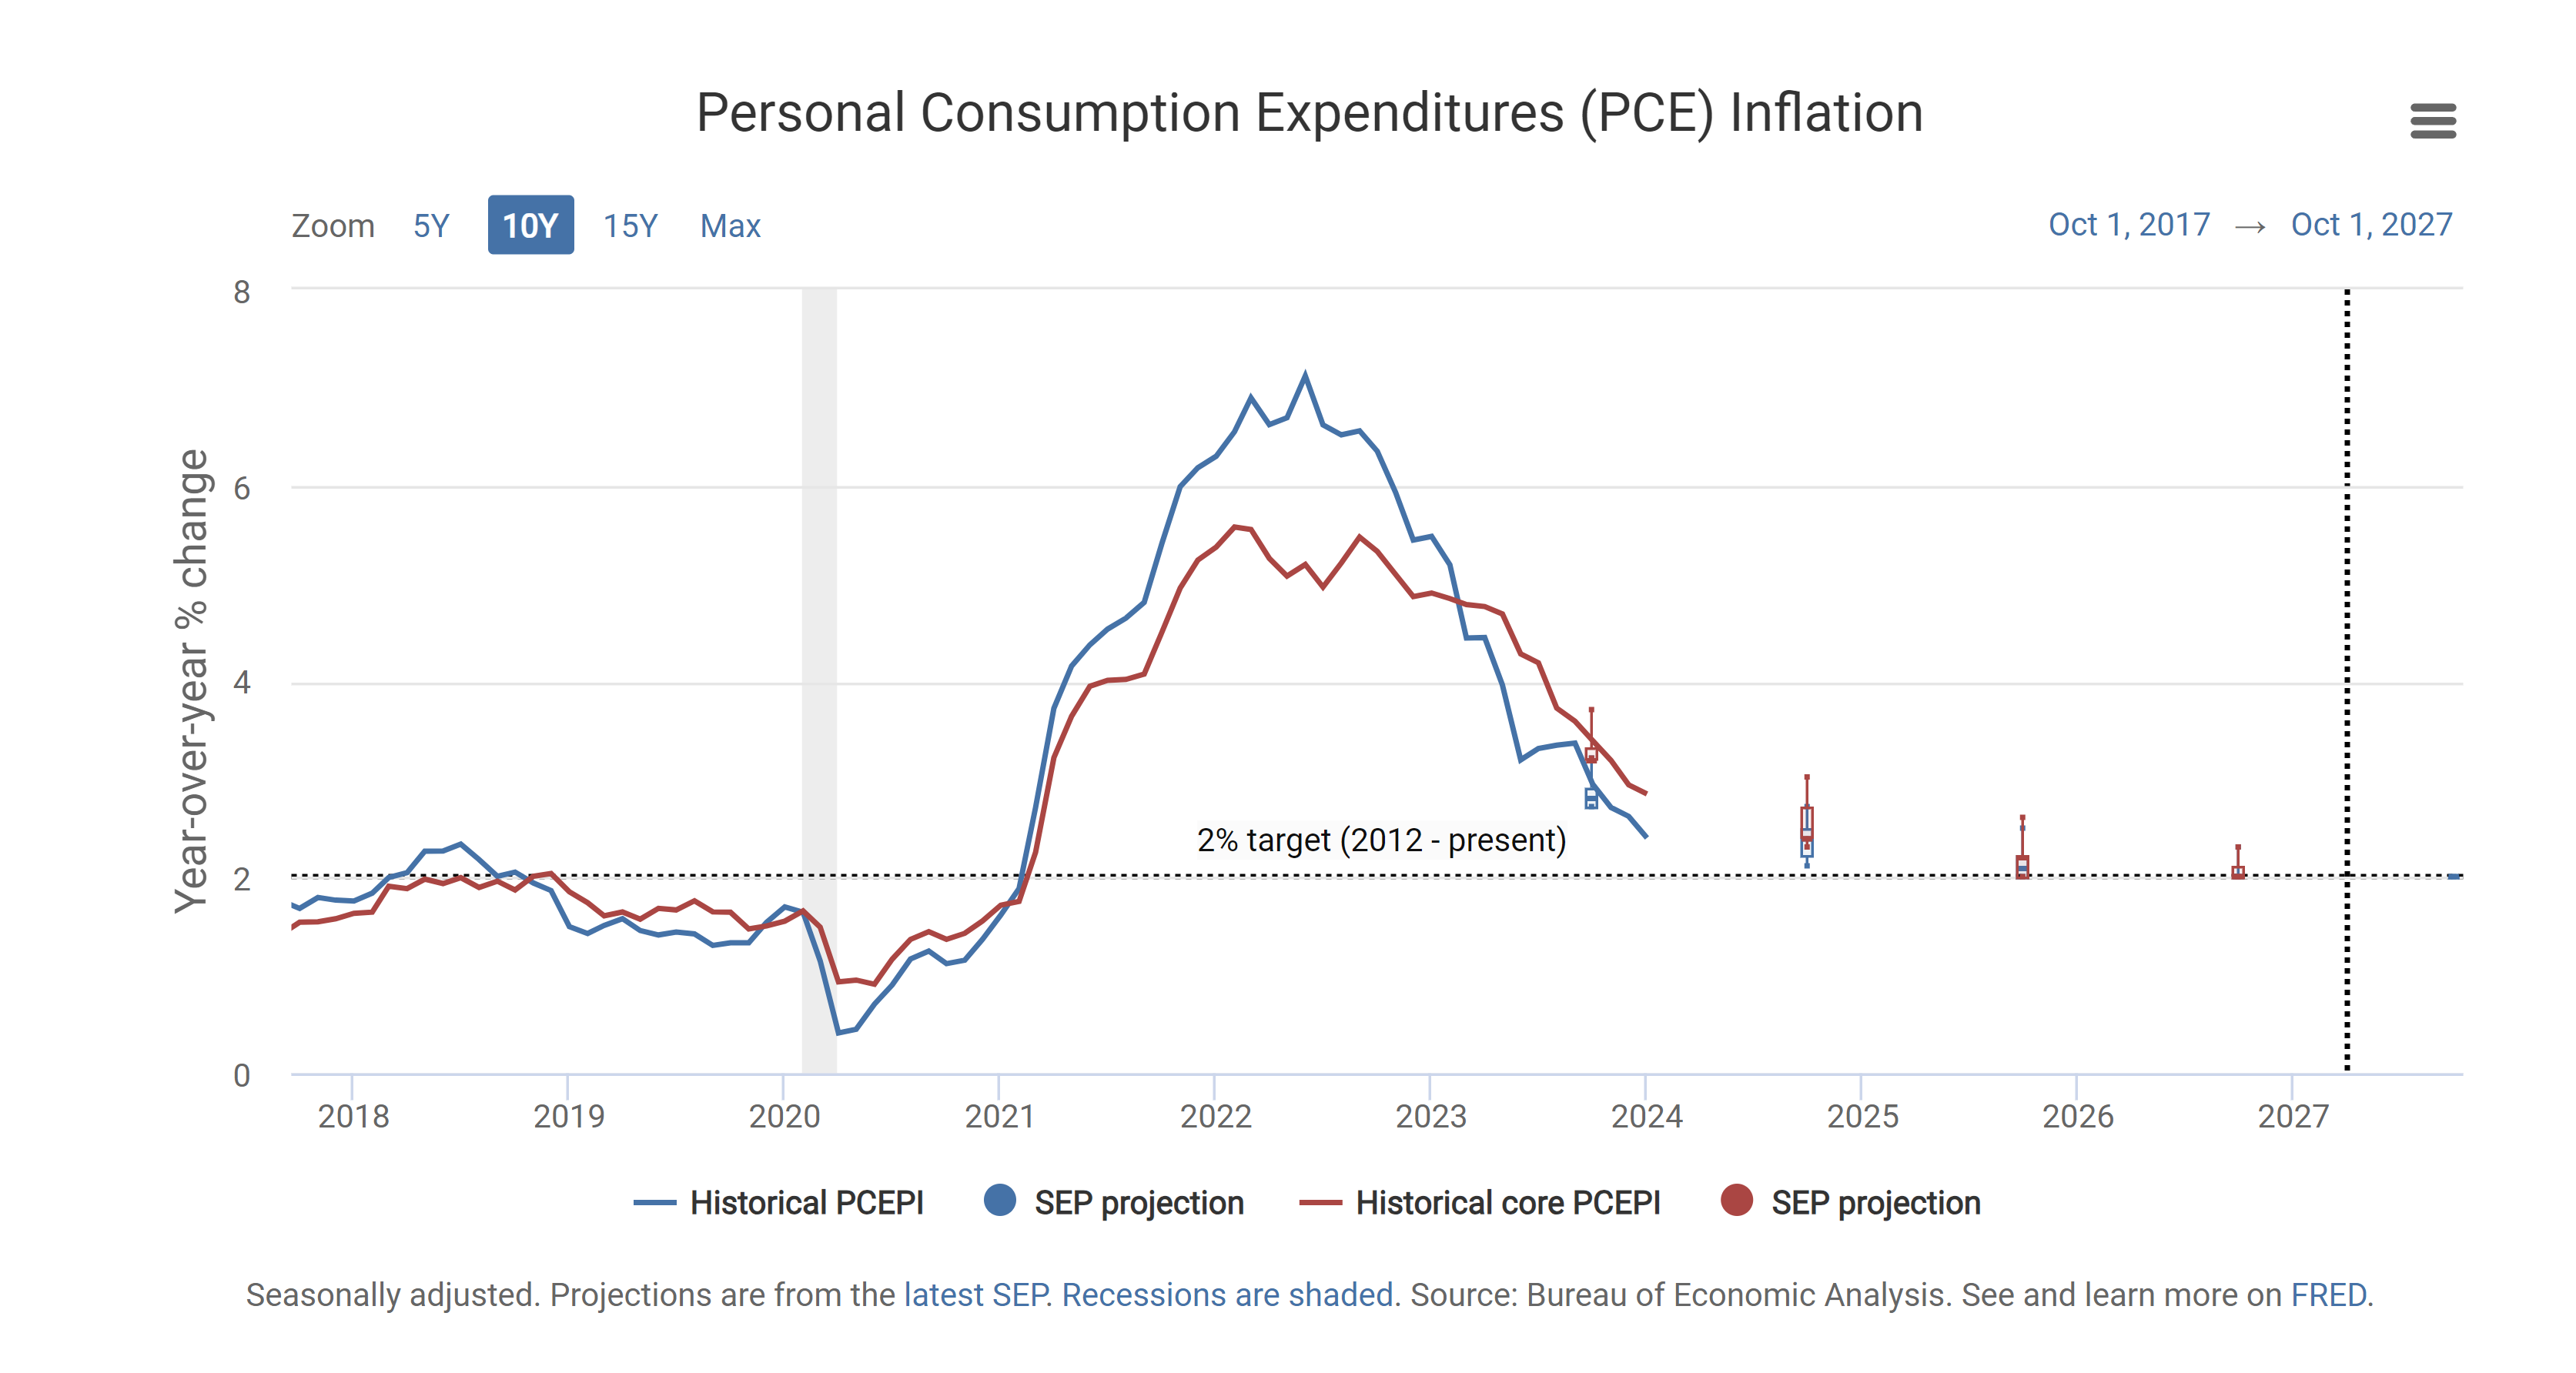
The Personal Consumption Expenditures (PCE) inflation data releases suggested that the recent increase in the previously-released consumer price index inflation was an early indicator of the impending Personal Consumption Expenditures (PCE) inflation data. The Month-over-Month (MoM) Supercore Personal Consumption Expenditures (PCE) and Core Personal Consumption Expenditures (PCE) inflation statistics have risen the most since 2021; this is a negative indication that FOMC officials should be attentive.
Figure 30. Supercore Personal Consumption Expenditures (PCE) Inflation. Month-over-Month (MoM).
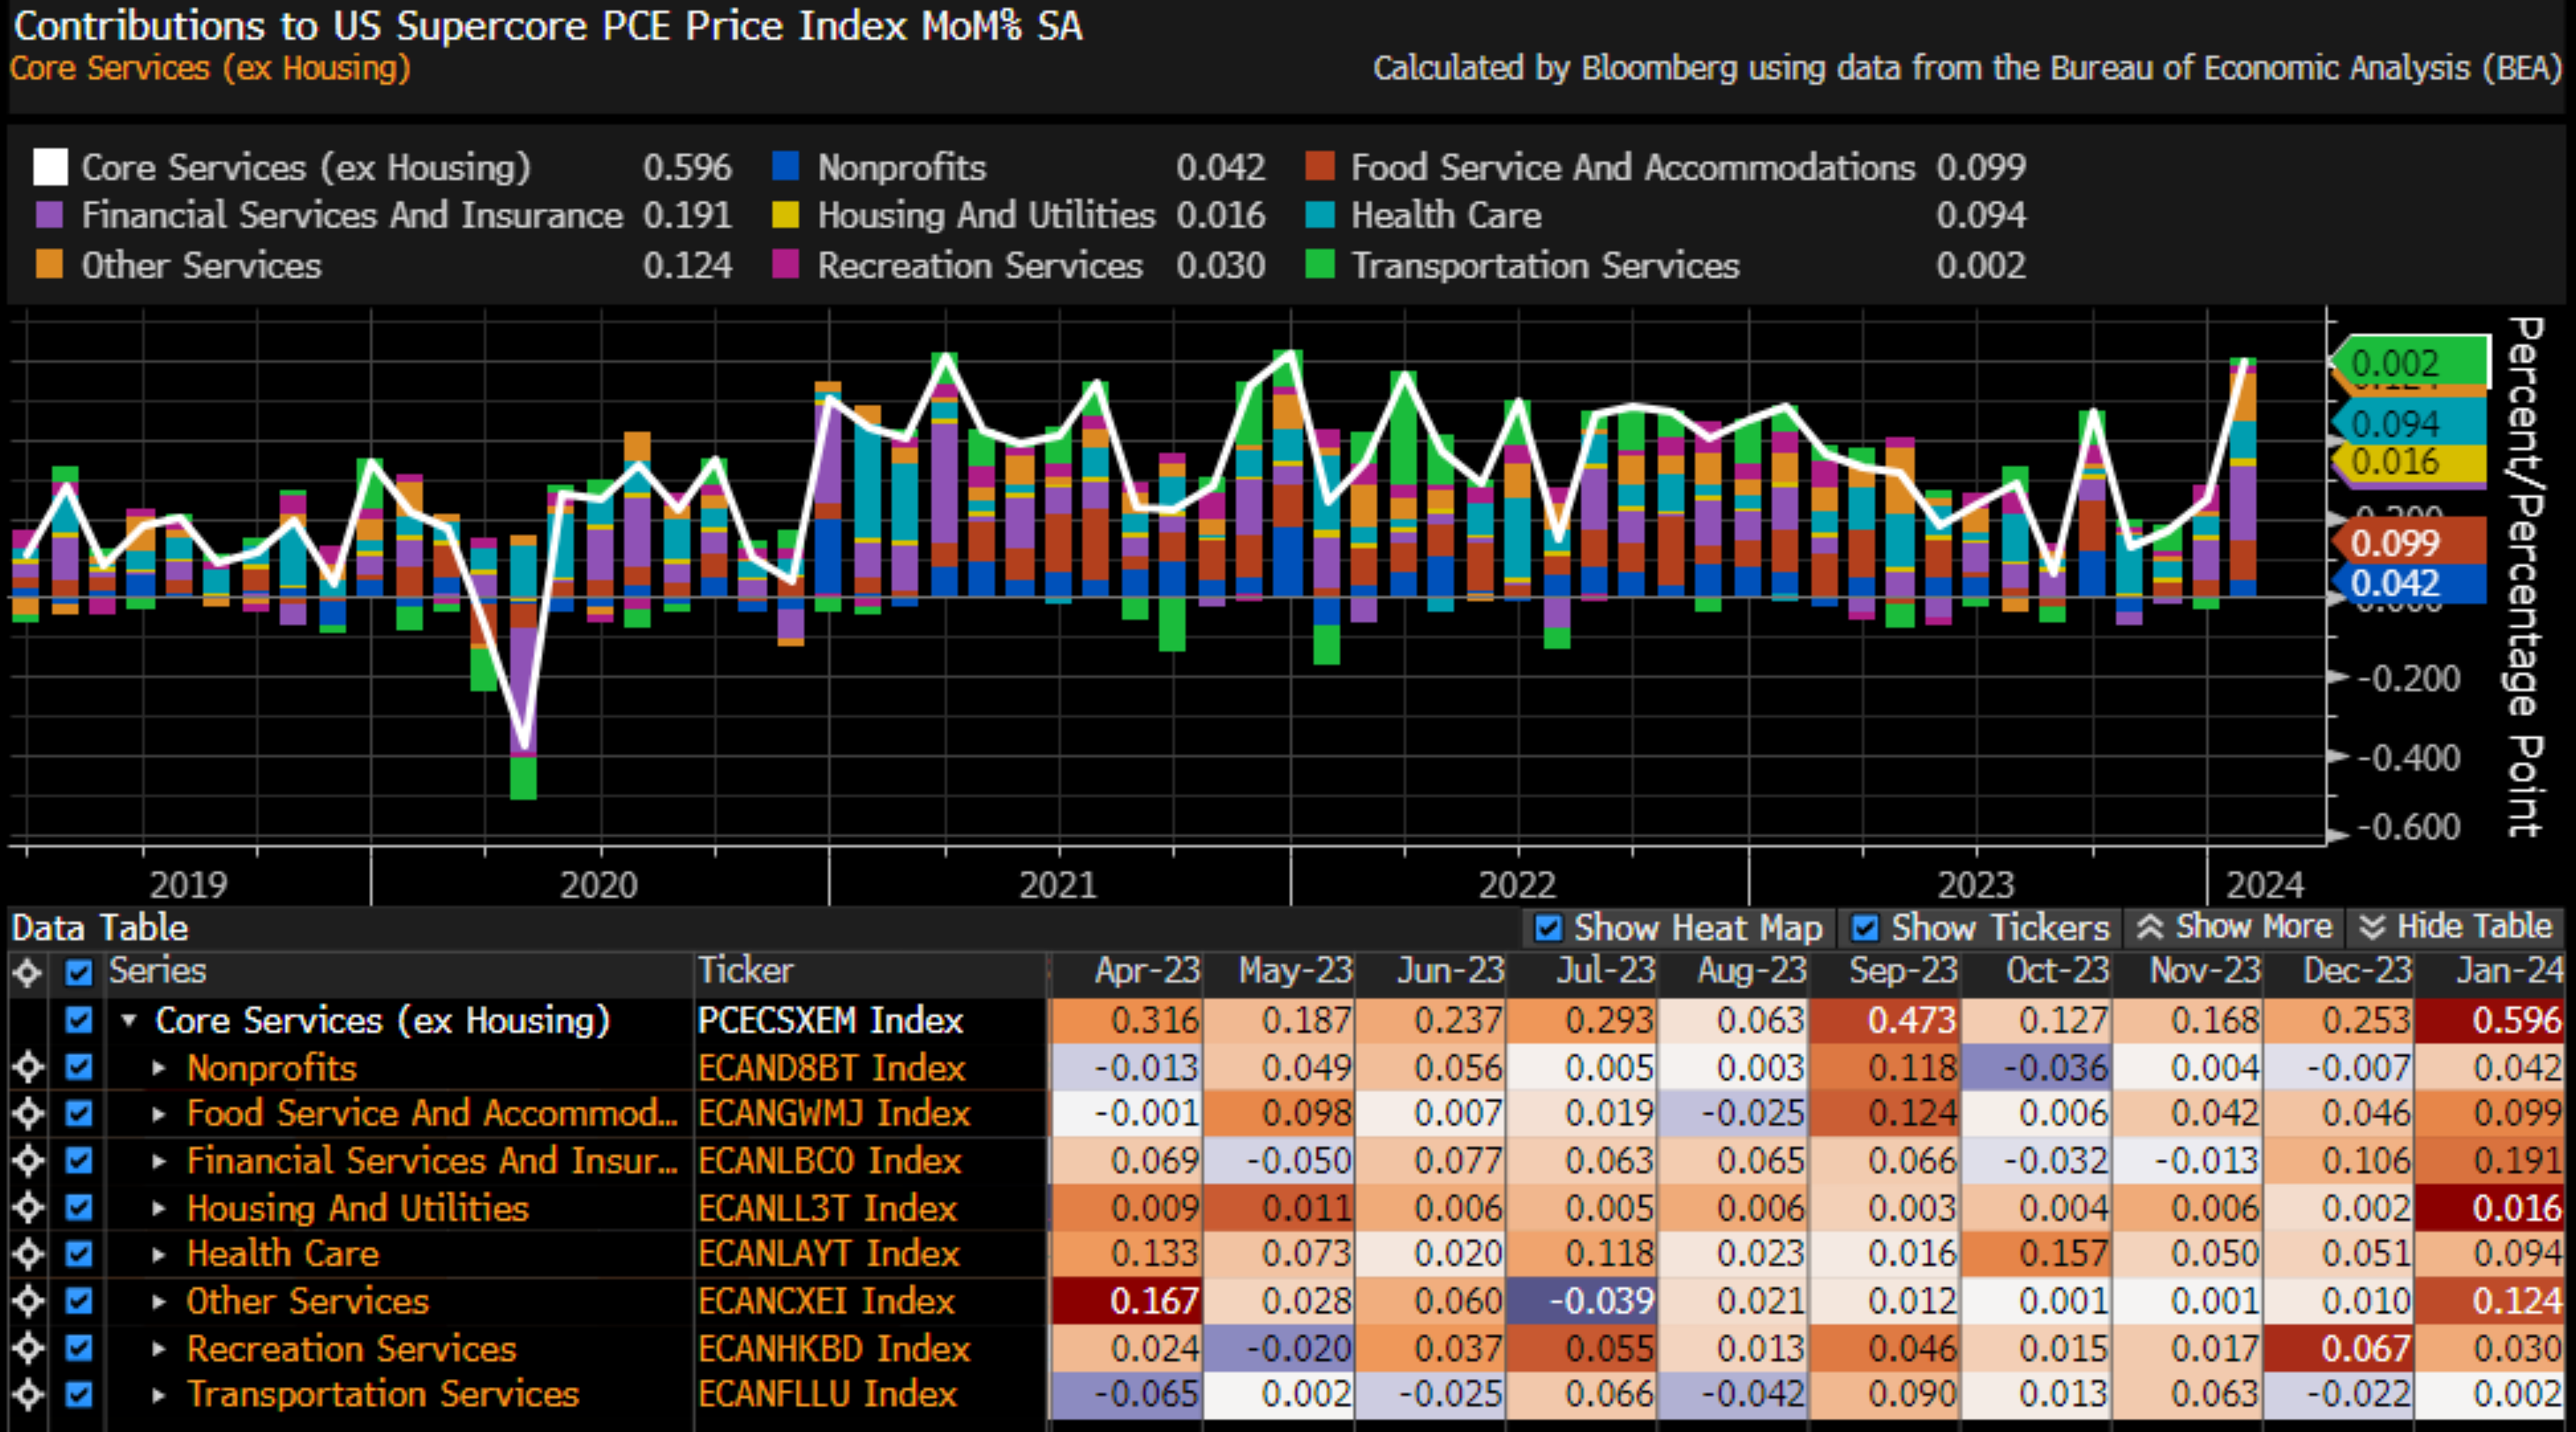
Figure 31. Core Personal Consumption Expenditures (PCE) Inflation. Month-over-Month (MoM).
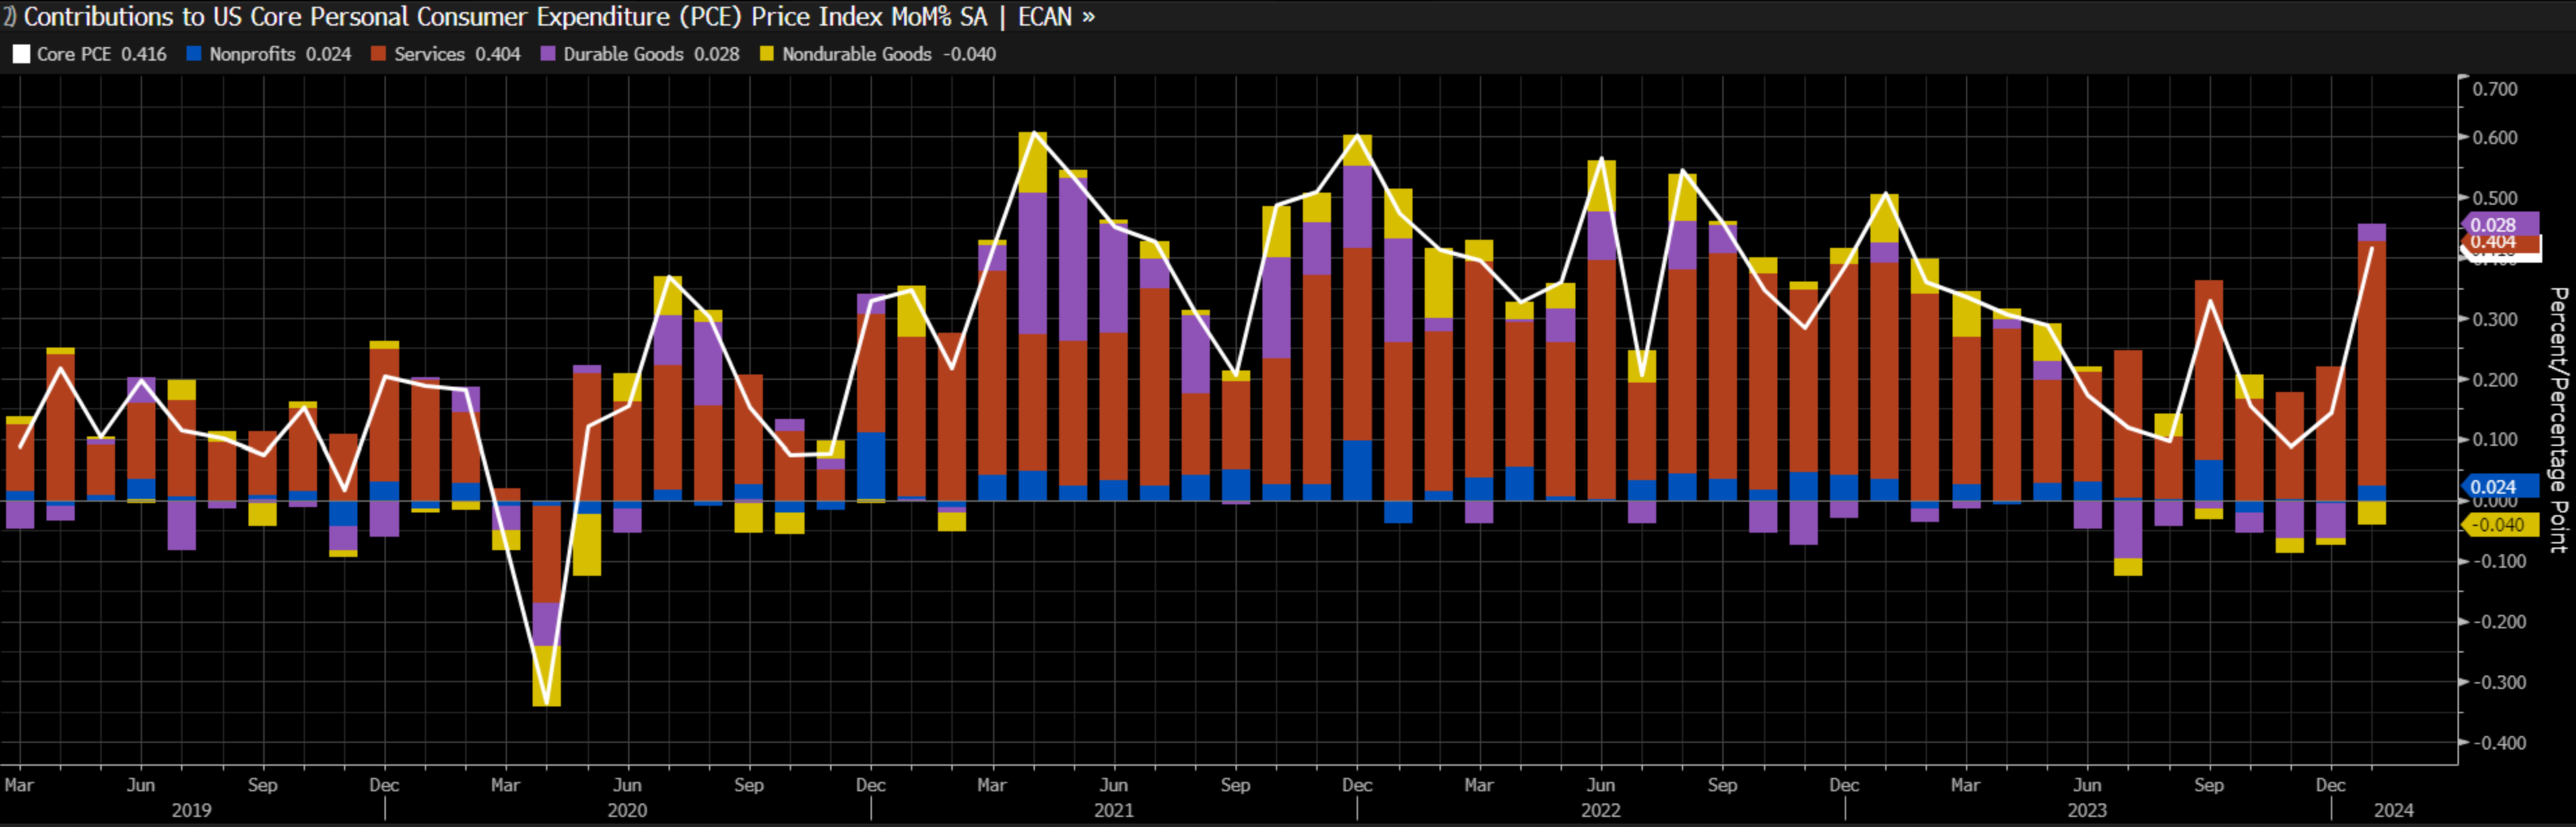
Figure 32. FOMC Officials’ Projections Over Personal Consumption Expenditures (PCE) Inflation.
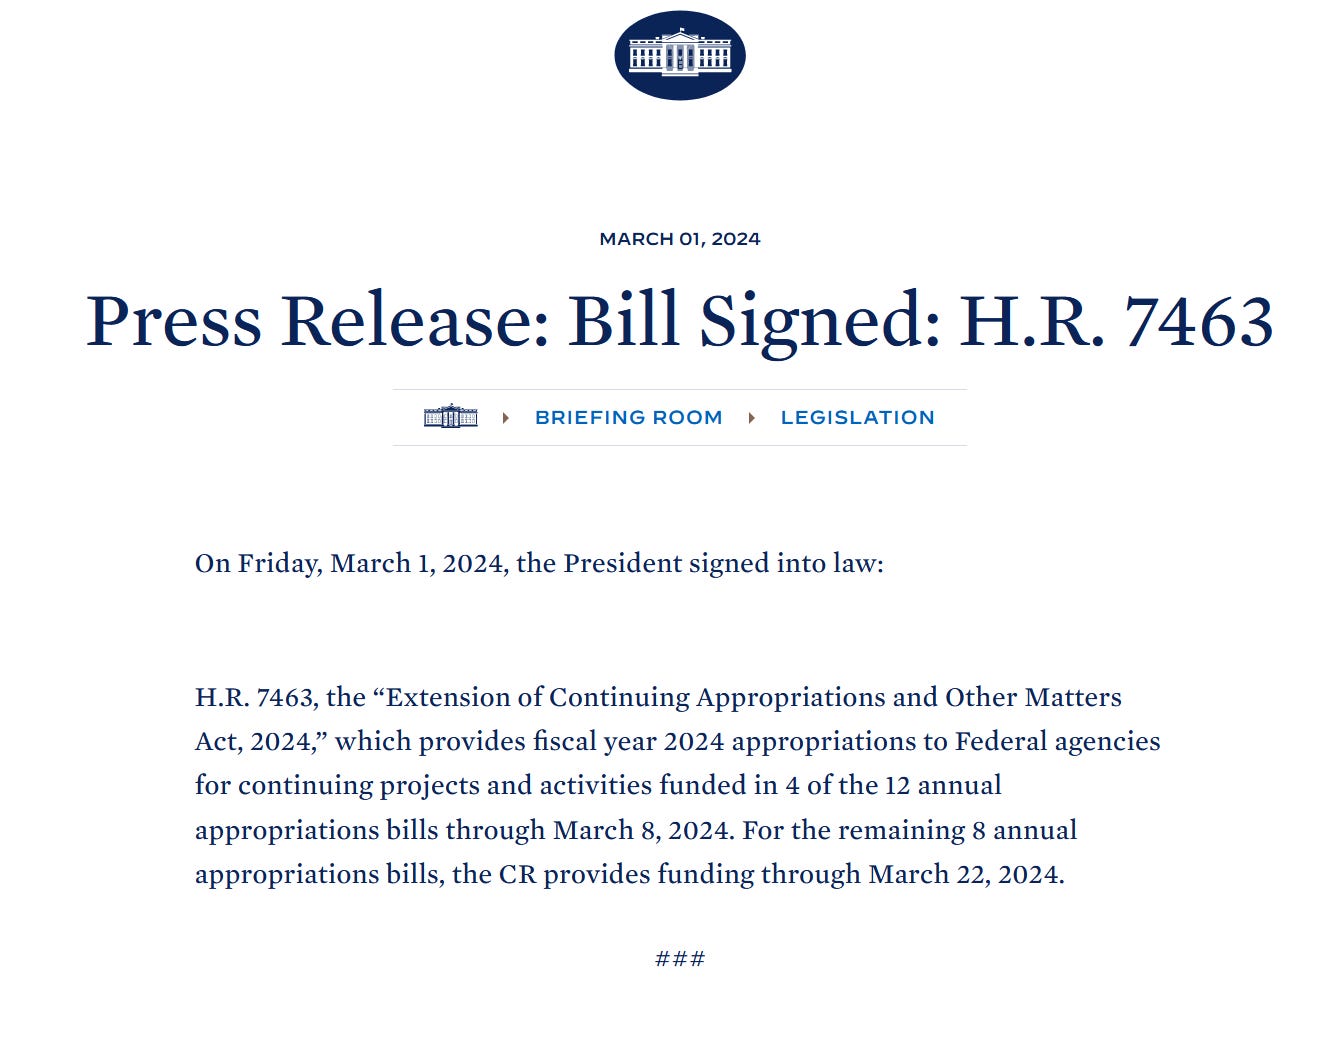
Markets were surprised by the uptick in the Personal Consumption Expenditures (PCE) inflation data releases, which made yields (TTT 0.00%↑) and the dollar (UUP 0.00%↑) rise, and markets (DIA 0.00%↑SPY 0.00%↑QQQ 0.00%↑IWM 0.00%↑TLT 0.00%↑) lower. Although later in the week, job market data releases made yields (TTT 0.00%↑) and the dollar (UUP 0.00%↑) lower and markets (DIA 0.00%↑SPY 0.00%↑QQQ 0.00%↑IWM 0.00%↑TLT 0.00%↑) rise. Politicians’ govt shutdown avertion made markets (DIA 0.00%↑SPY 0.00%↑QQQ 0.00%↑IWM 0.00%↑TLT 0.00%↑) rally and yields (TTT 0.00%↑) momentarily lower.
Figure 32. President Biden Signs The “Extension of Continuing Appropriations and Other Matters Act, 2024“ ( §7463 ) Bill.
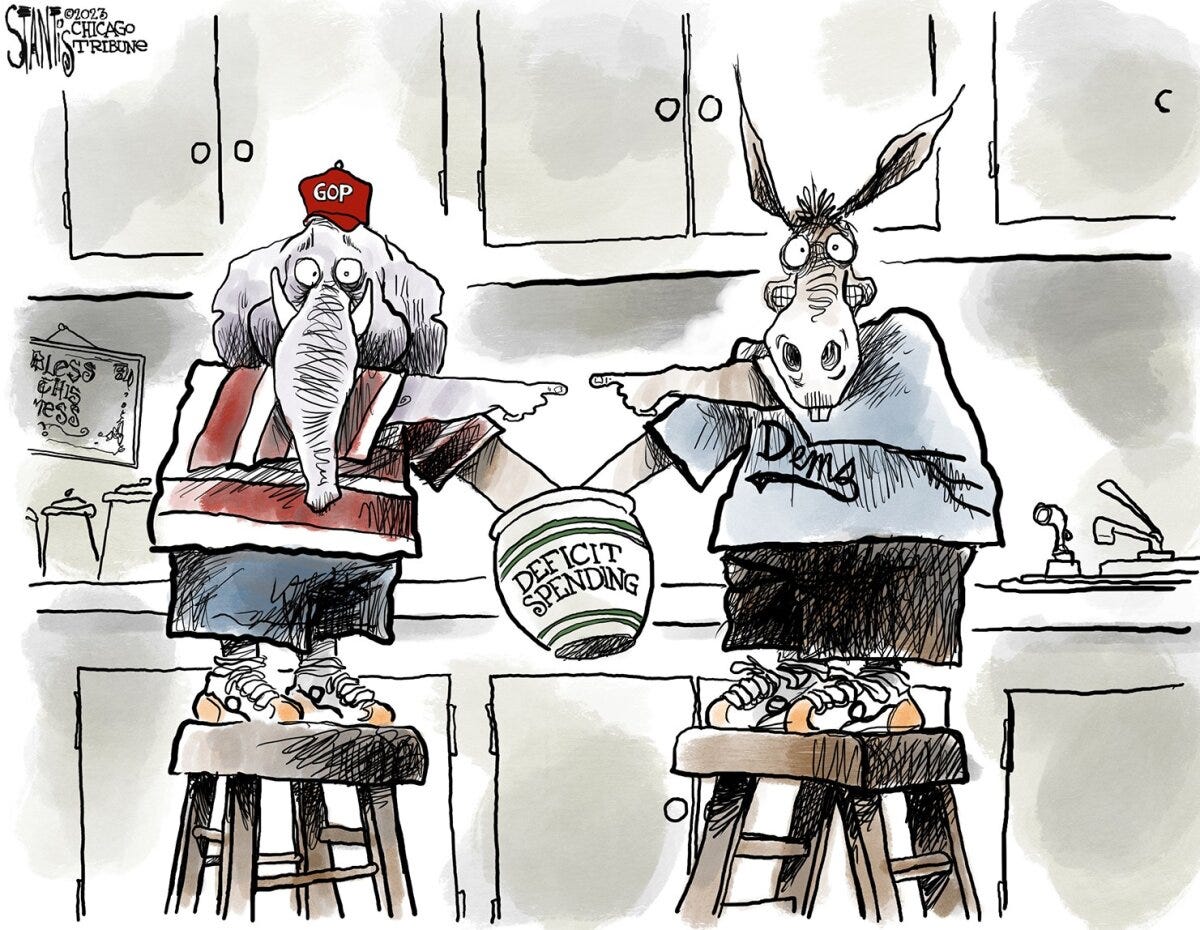
Yet Another Kick The Can Measure To Keep The Blame Game Between Each Party Over Deficit Spending…
A recent comment by a FOMC official signaled a plausible change in open market operations regarding Quantitative Tightening (QT) and Quantitative Easing (QE). The summary of the remarks is: buy ST TSYs (TLT 0.00%↑) and short MBS (MBB 0.00%↑). For the moment, expectations remain quite clear; forward macroeconomic data releases will signal the forward monetary policy path as monetary policy is data-dependent.
Figure 33. This & Next Week’s Data Release Expectations.

If job market data releases are lower than expectations, yields (TTT 0.00%↑) and the dollar (UUP 0.00%↑) should lower, and markets (DIA 0.00%↑SPY 0.00%↑QQQ 0.00%↑IWM 0.00%↑TLT 0.00%↑) should rise; if job market data releases are higher than expectations, yields (TTT 0.00%↑) and the dollar (UUP 0.00%↑) should rise, and markets (DIA 0.00%↑SPY 0.00%↑QQQ 0.00%↑IWM 0.00%↑TLT 0.00%↑) should lower. Markets (DIA 0.00%↑SPY 0.00%↑QQQ 0.00%↑IWM 0.00%↑TLT 0.00%↑) should be attentive to this and next week’s FOMC officials’ speeches, mostly after the recent uptick in the Philadelphia Fed Partisan Conflict Index, which tracks the level of disagreement between officials.
Figure 34. The Federal Reserve Bank of Philadelphia's Partisan Conflict Index. ( Tracks The Level Of Disagreement Between Officials )

To conclude, despite the uncertainty generated by the rise in the Partisan Conflict Index ( which tracks the level of disagreement between officials ), the most recent FOMC minutes were pretty clear. Nonetheless, given the obvious hawkish but nimble stance of the FOMC minutes, the remarks by FOMC officials’ speeches ( especially Chairman Powell's speeches ) this and next week should not be dismissed with assumptions given by the FOMC minutes’ stance, as data releases will likely skew FOMC officials’ stance as monetary policy is data-dependent.
Europe:
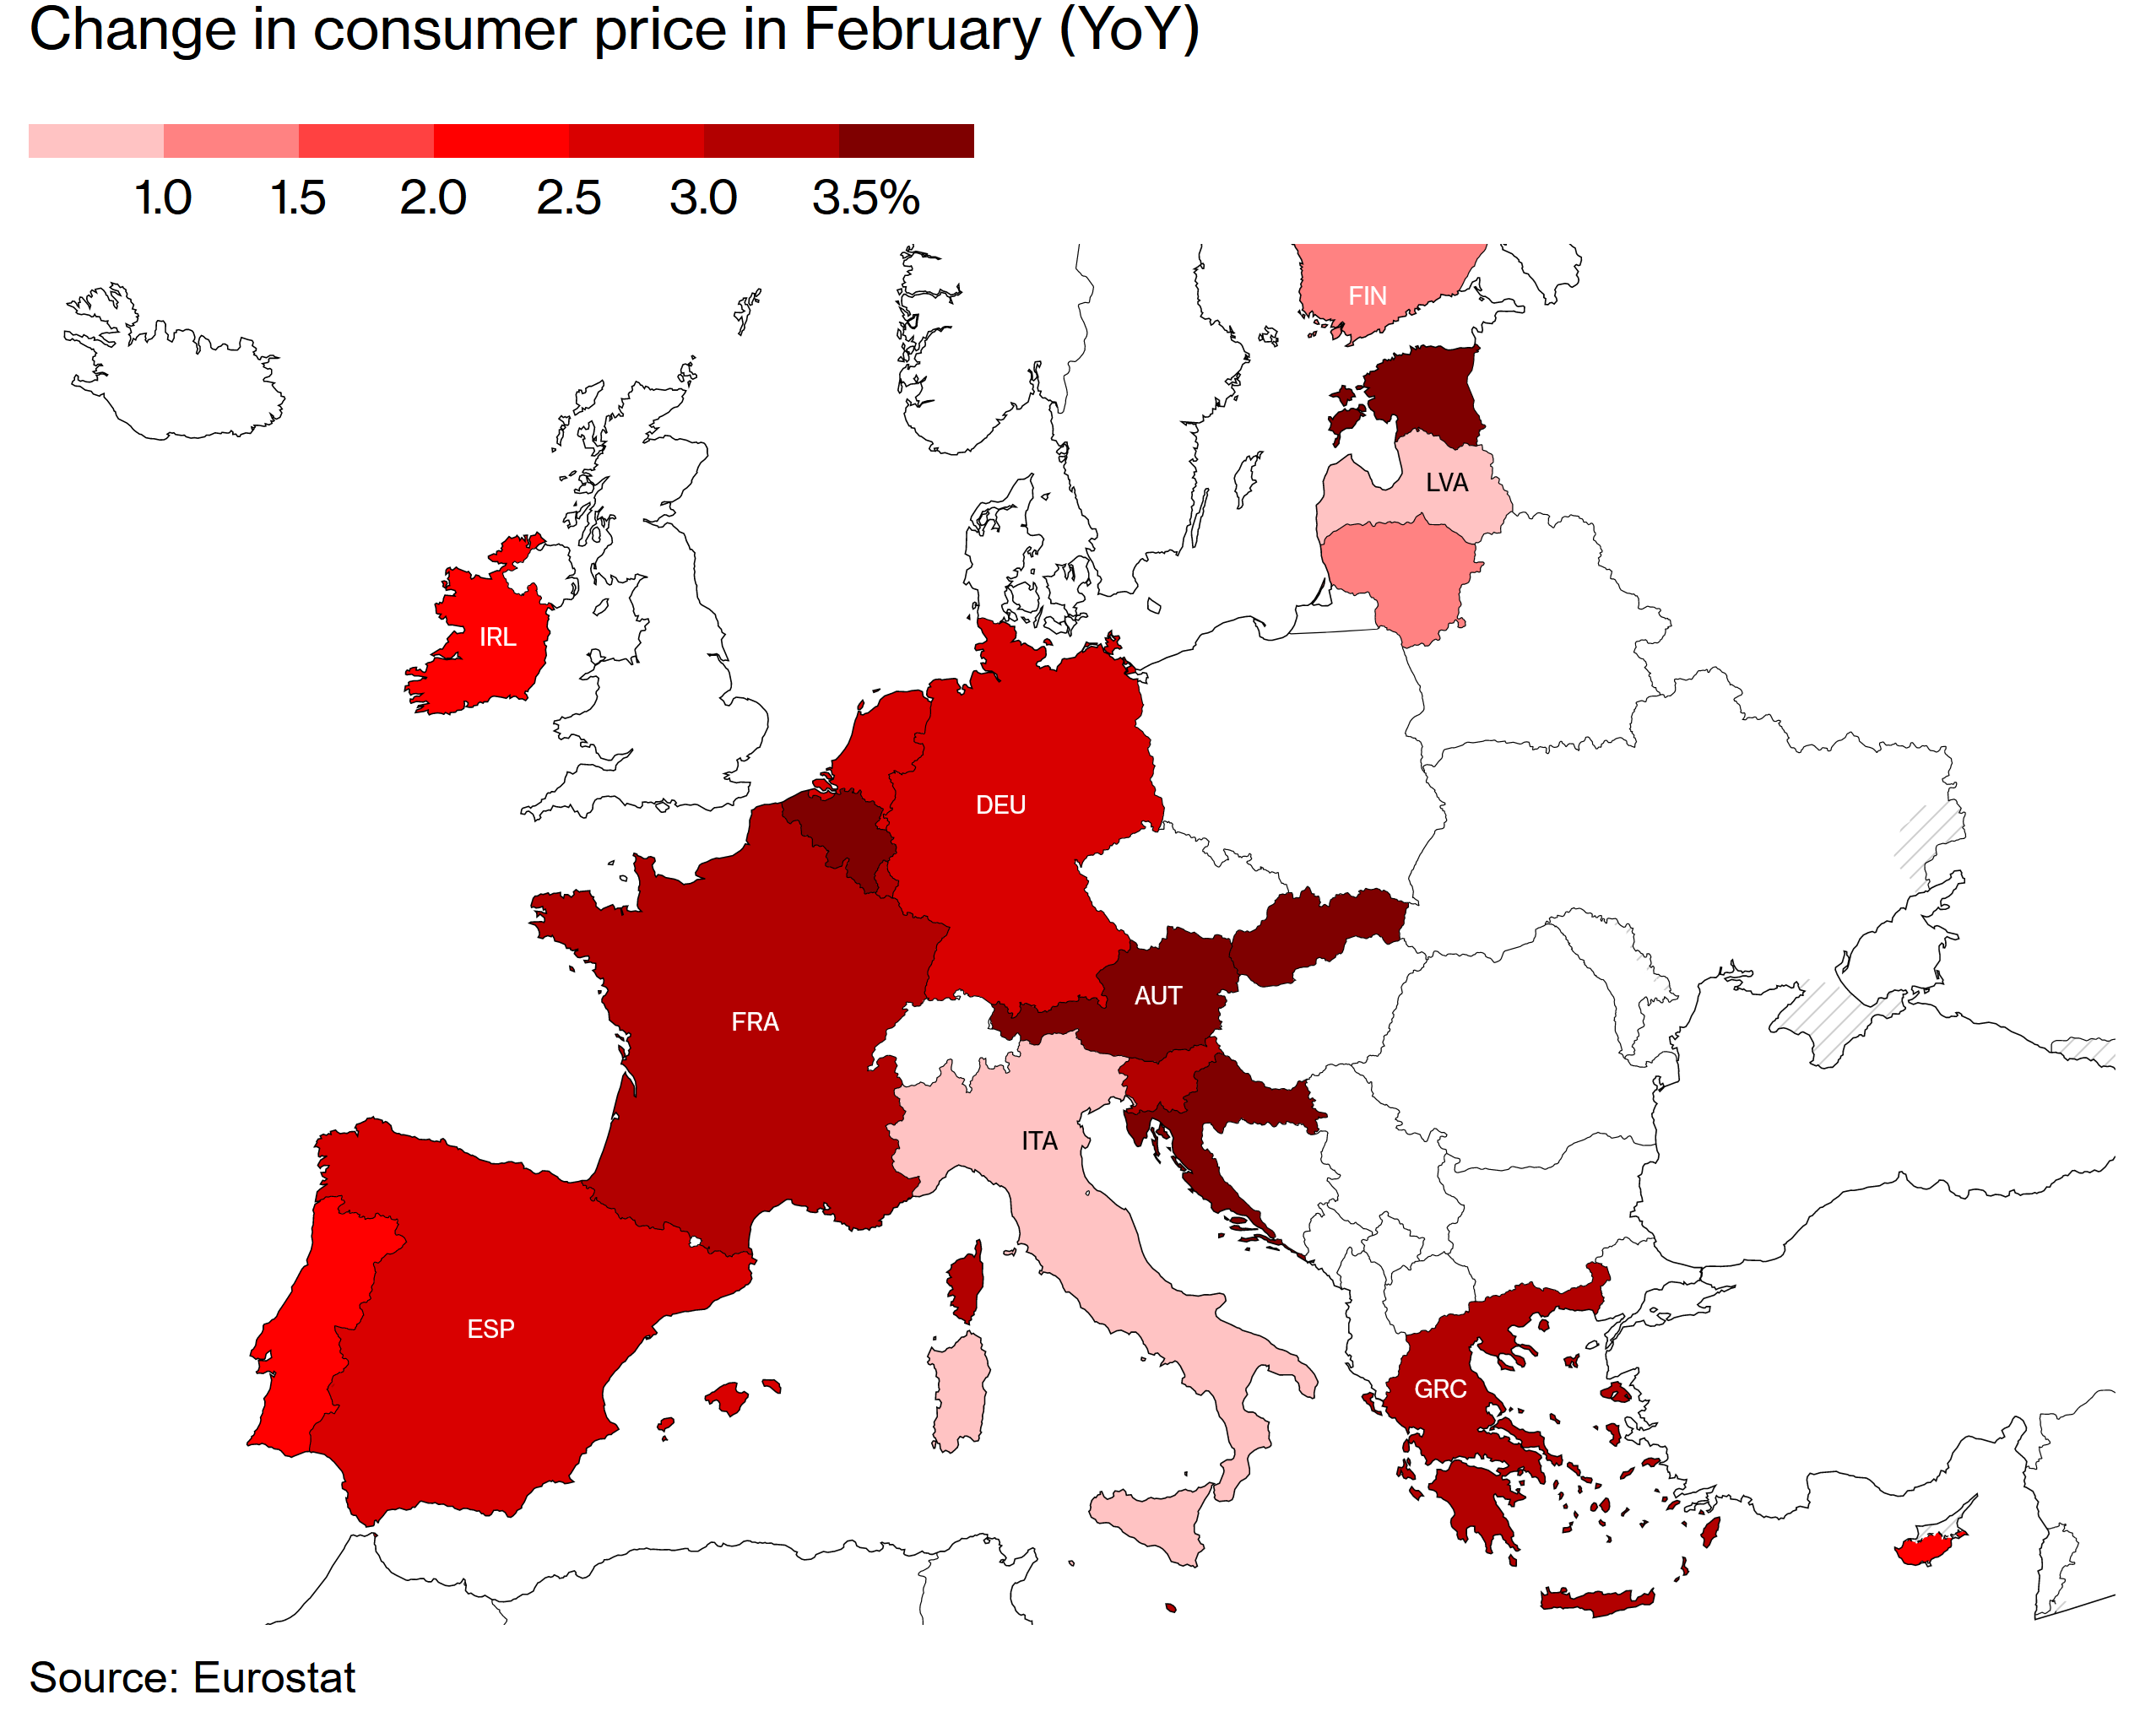
The Euro-Zone is performing as expected, with a record low unemployment rate and inflation statistics approaching the European Central Bank’s price stability target. Although most Euro-Zone countries’ inflation rates are far more elevated than the European Central Bank’s price stability goal.
Figure 35. Record Low Unemployment Rate.
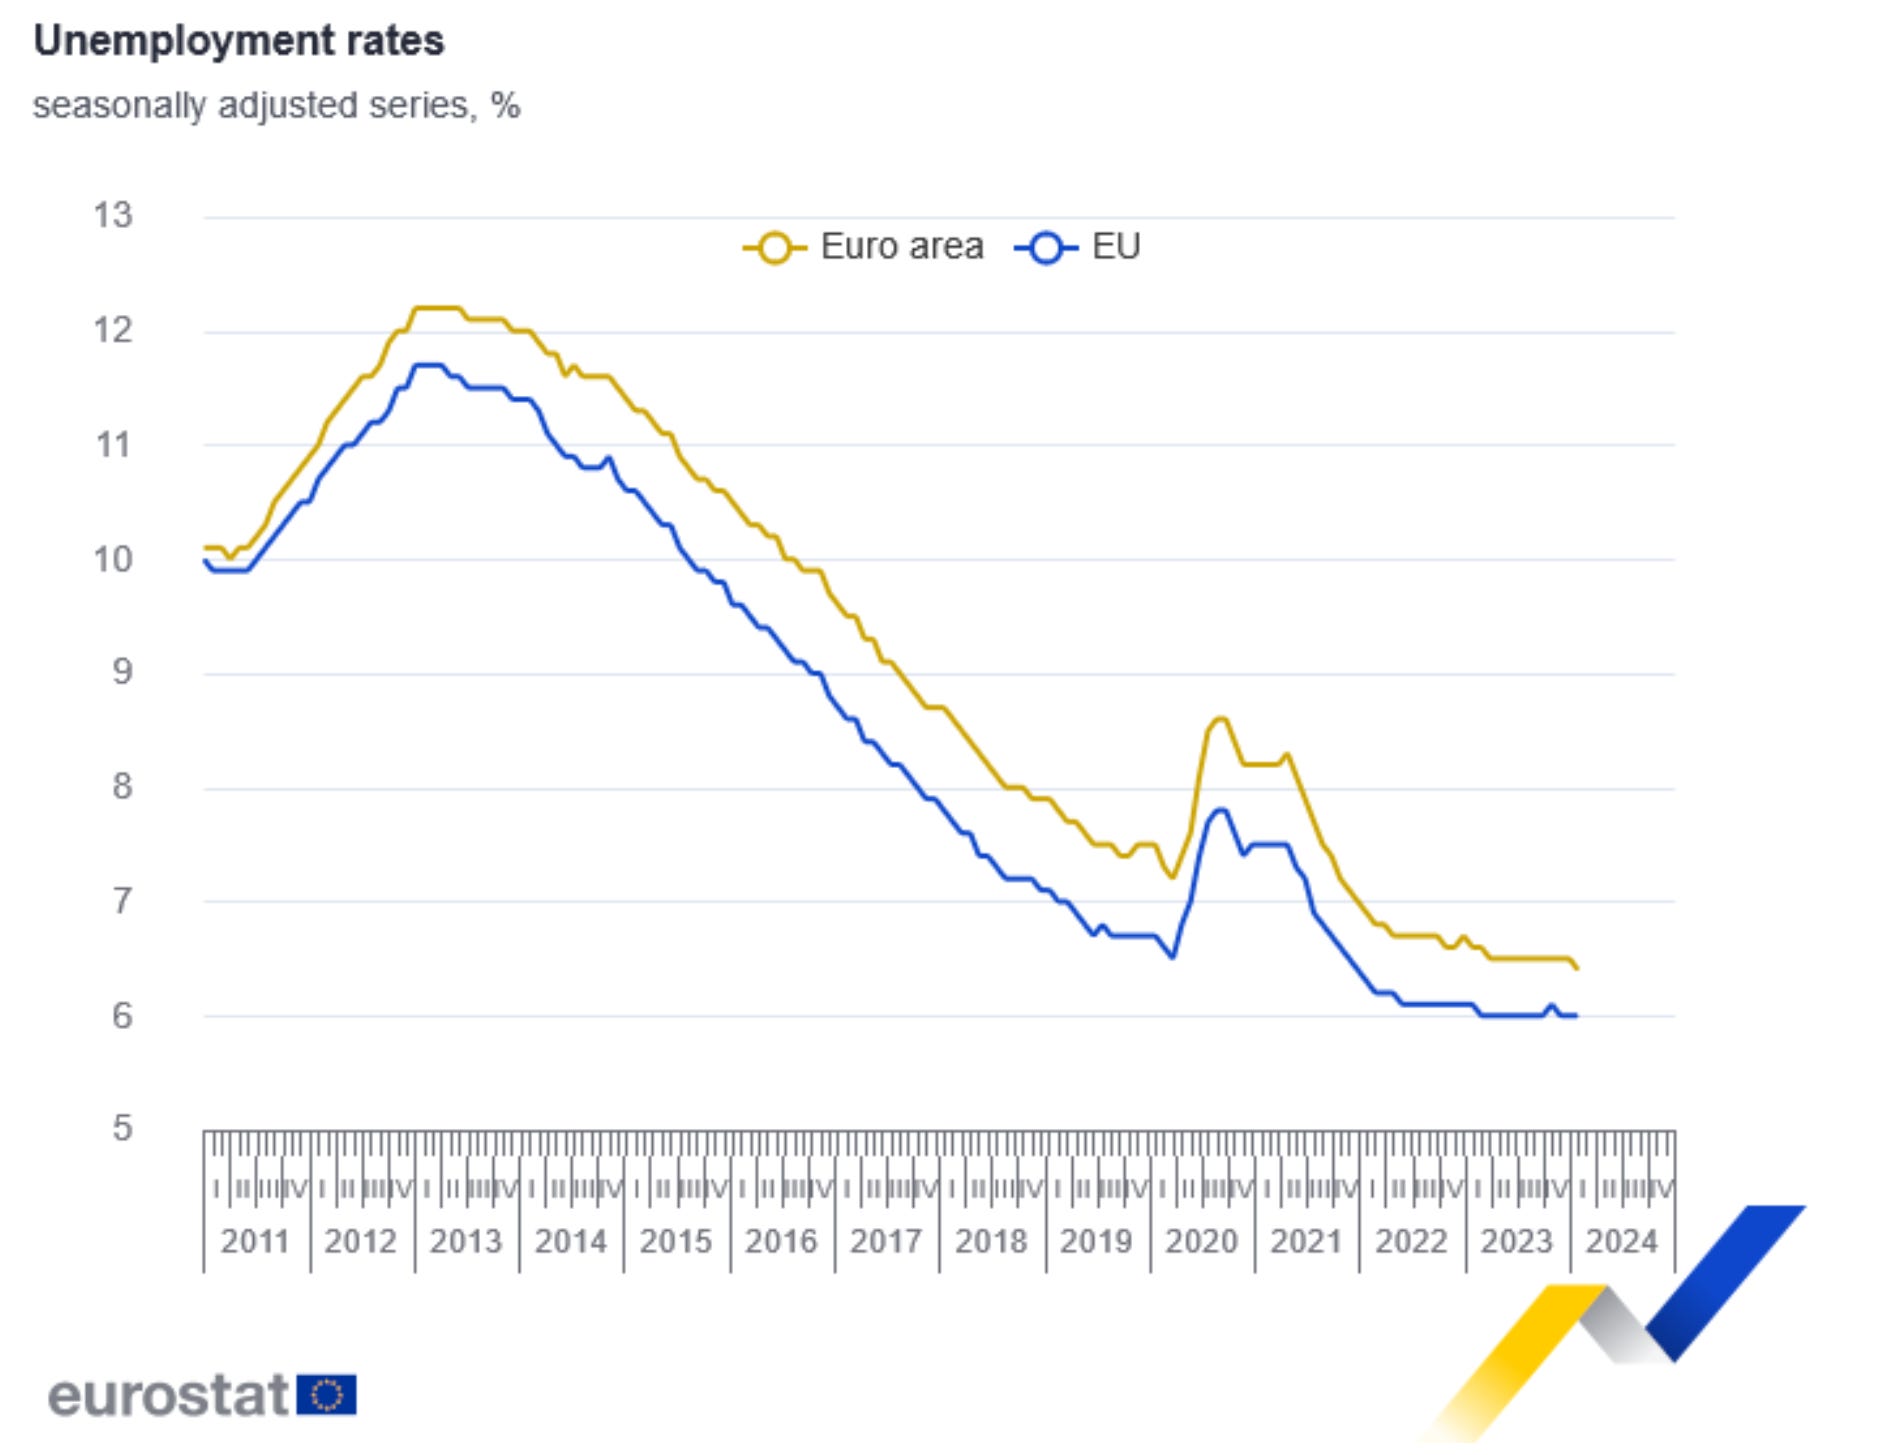
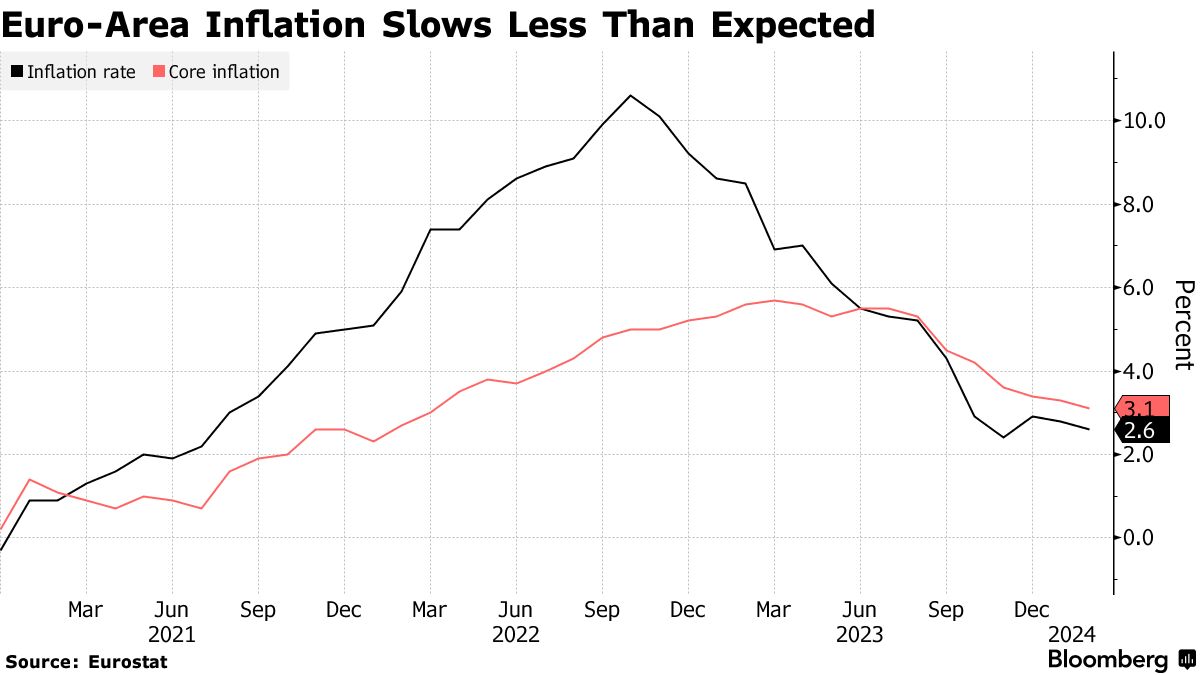
Figure 36. European Inflation Is Almost At The European Central Bank’s Price Stability Target.
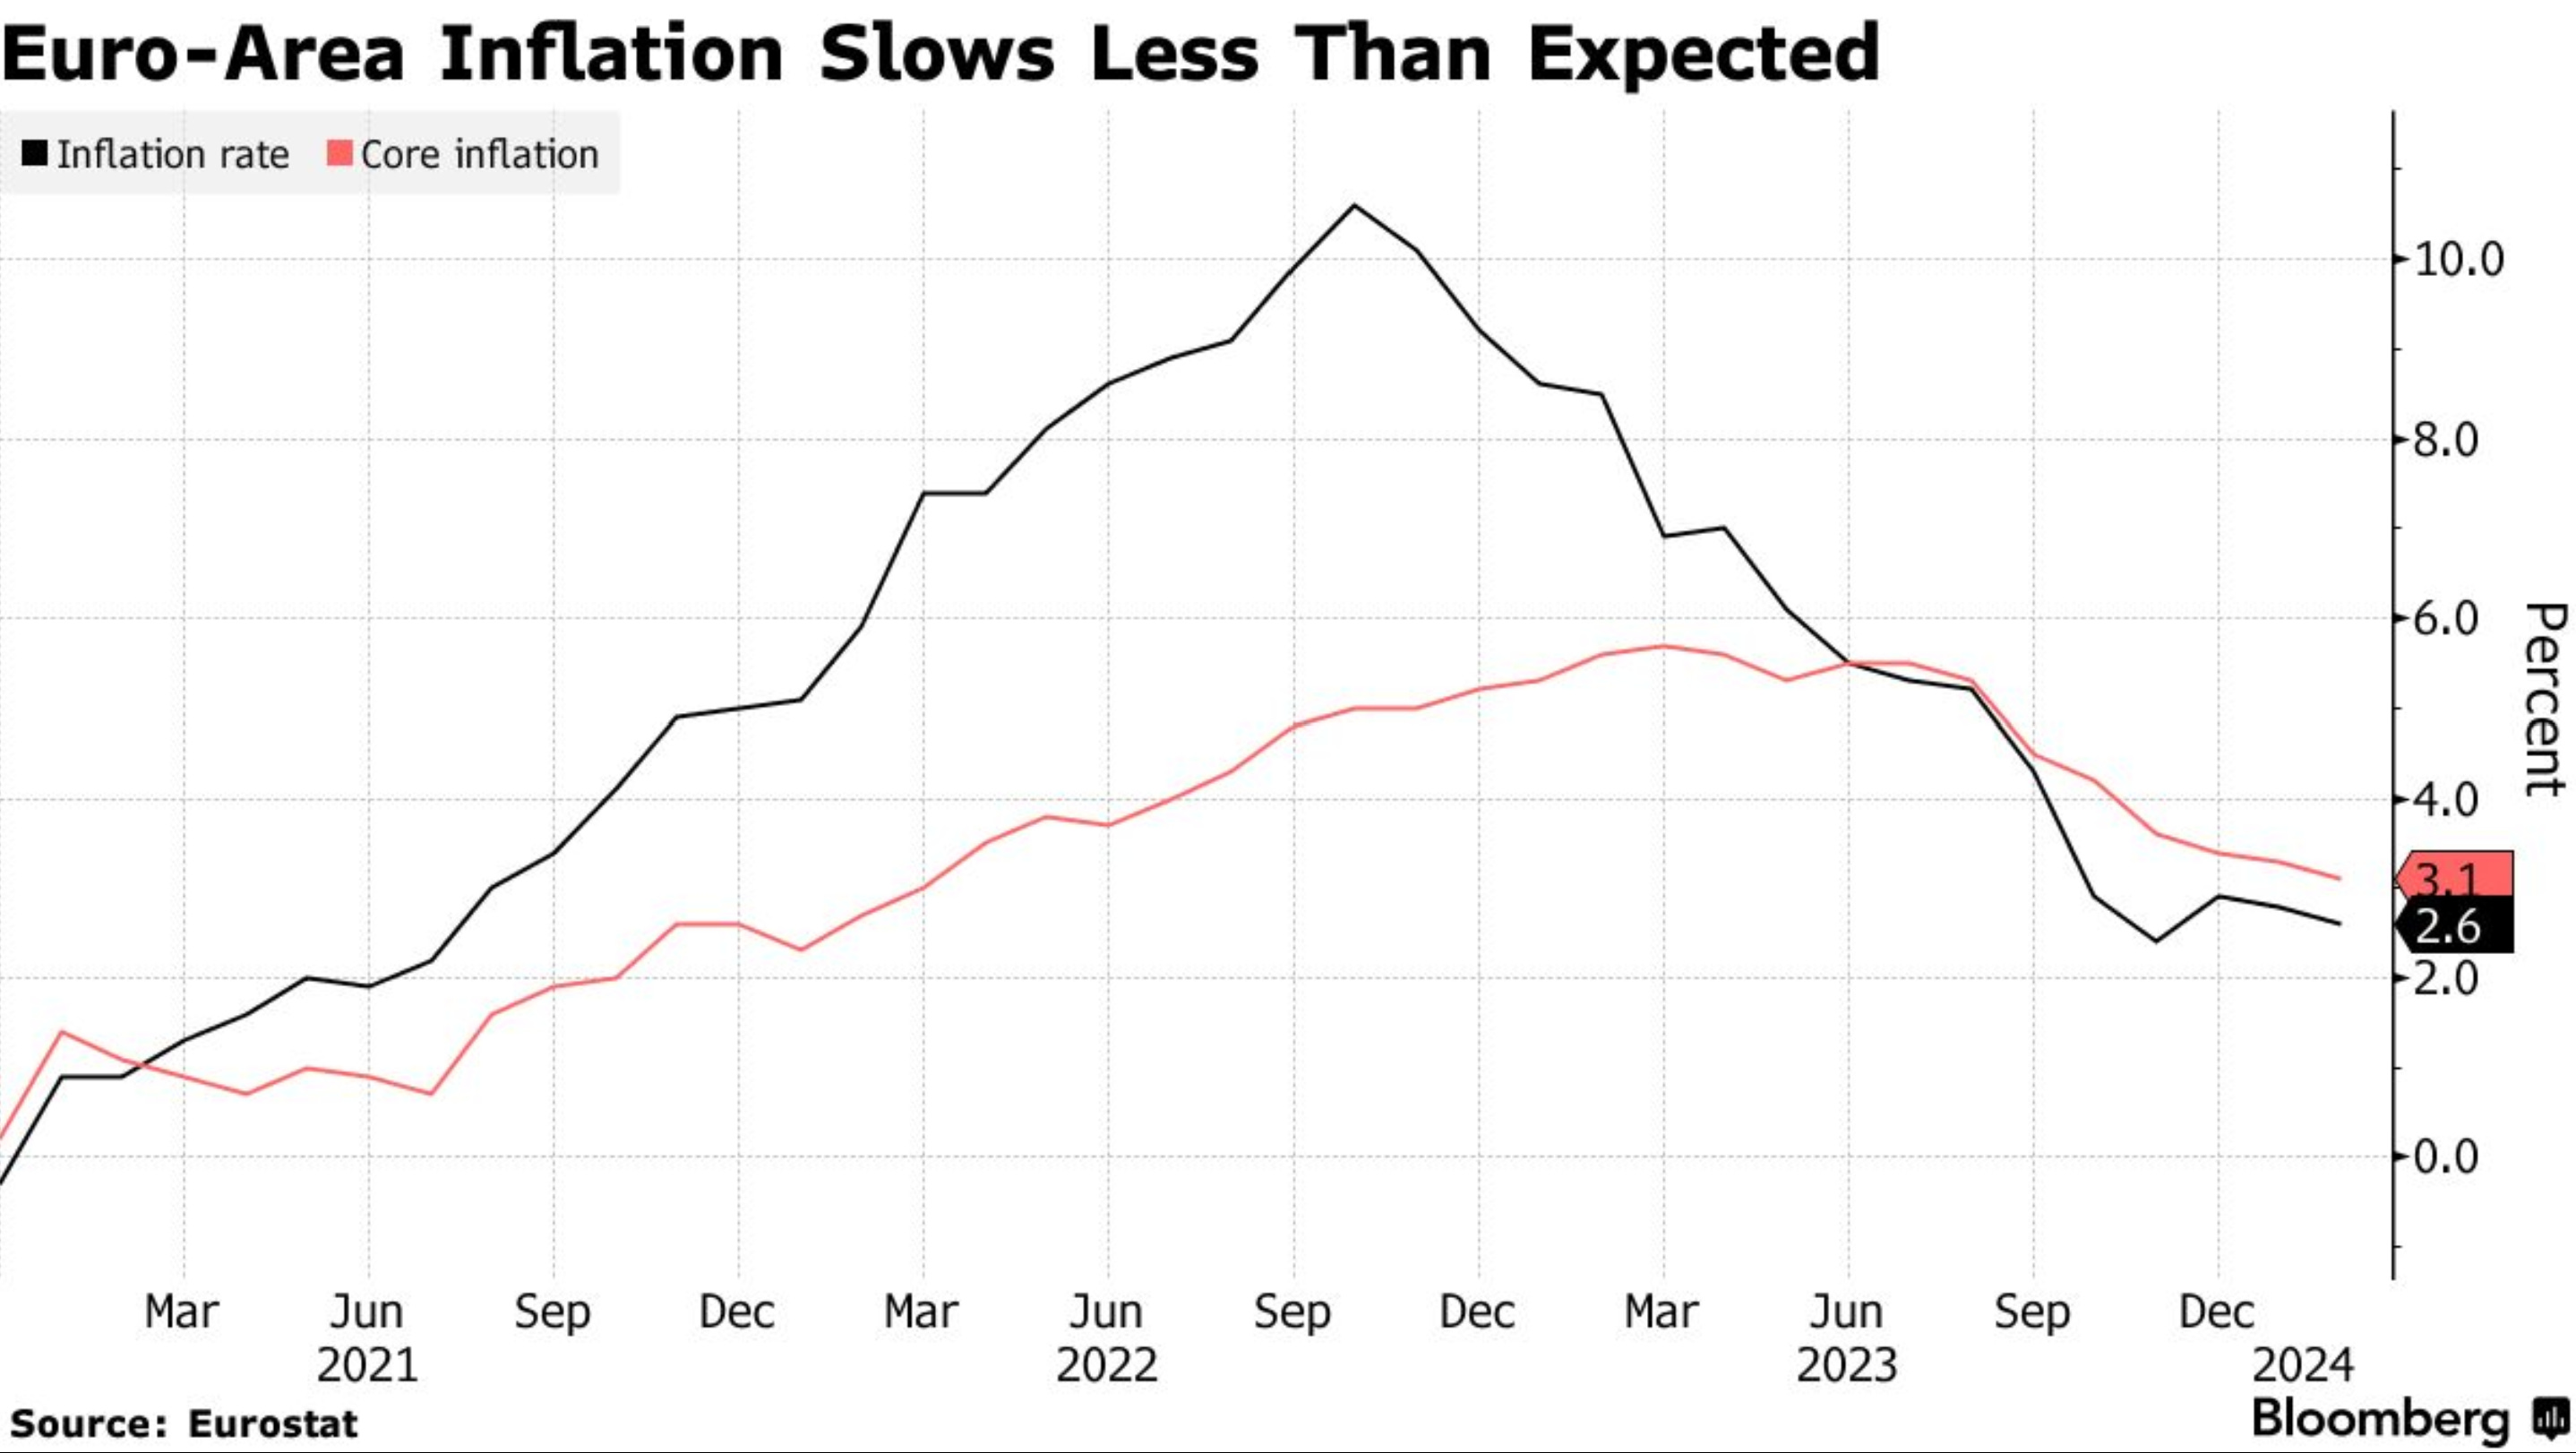
Figure 37. Most Euro-Zone Countries Still Have Inflation Far More Elevated Than The European Central Bank's Price Stability Goal.
Despite the fact that inflation statistics are significantly higher than the European Central Bank’s price stability target, markets and economists expect a dovish outcome.
Figure 38. Economists Expectations Are More Hawkish Than The Market-Priced Rate Path. ( Long-Run Median Rate At 2.5% )
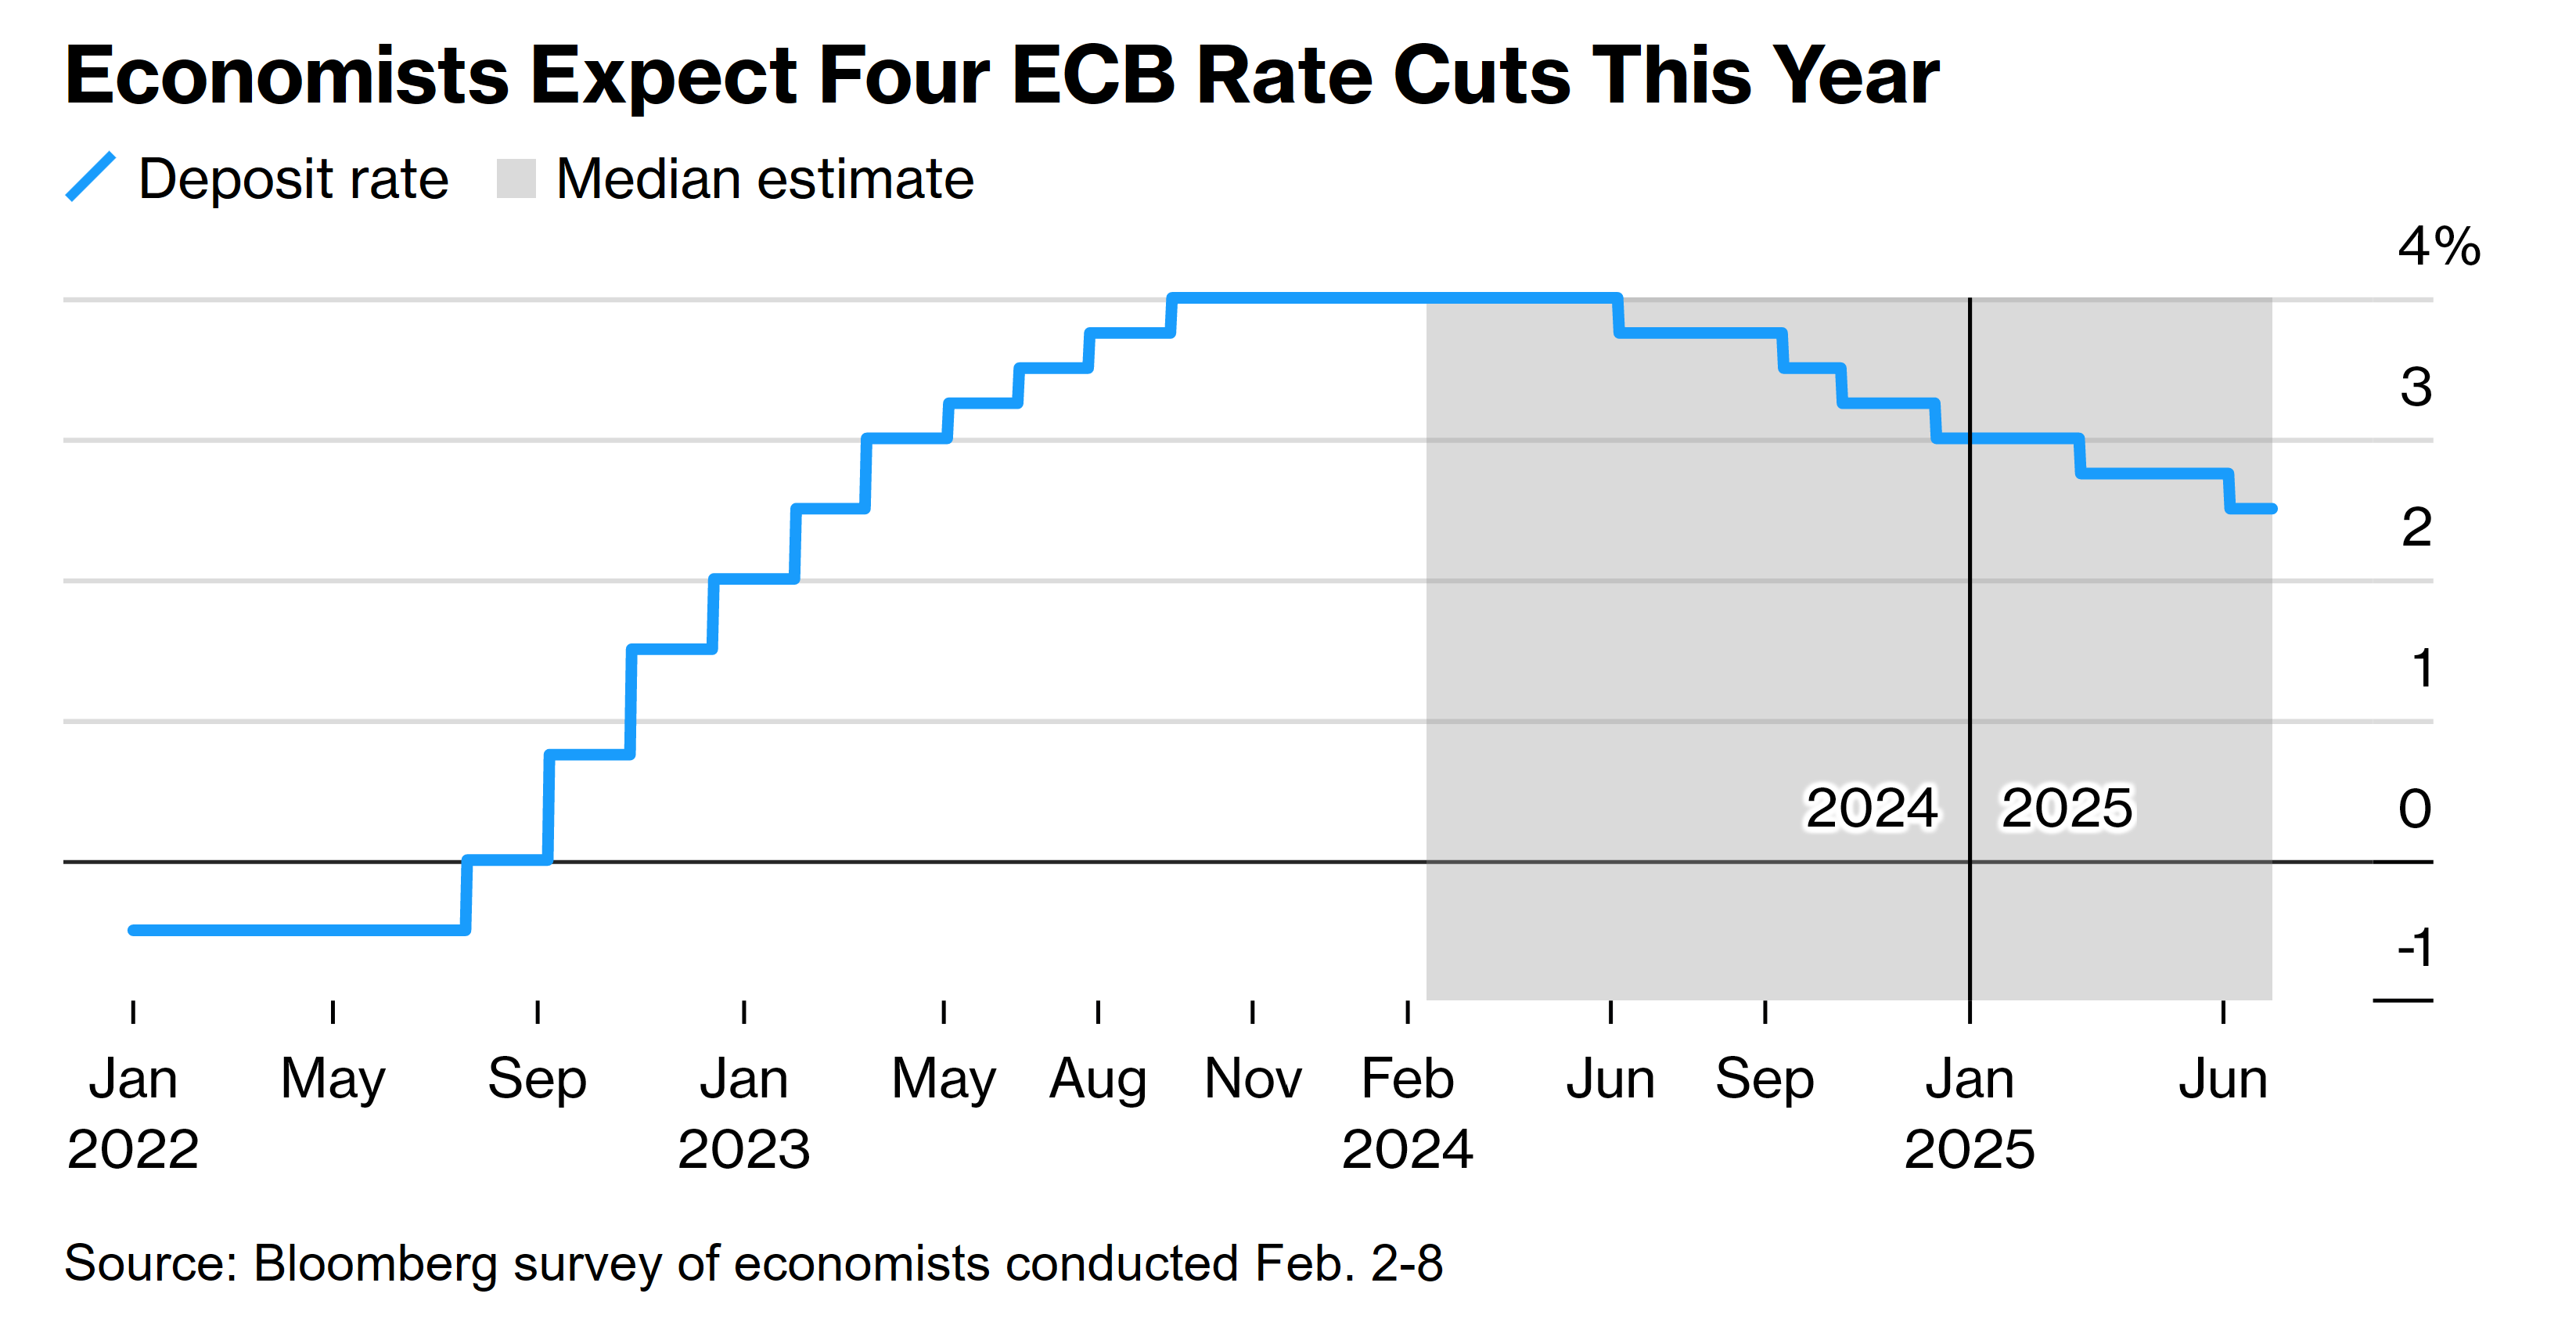
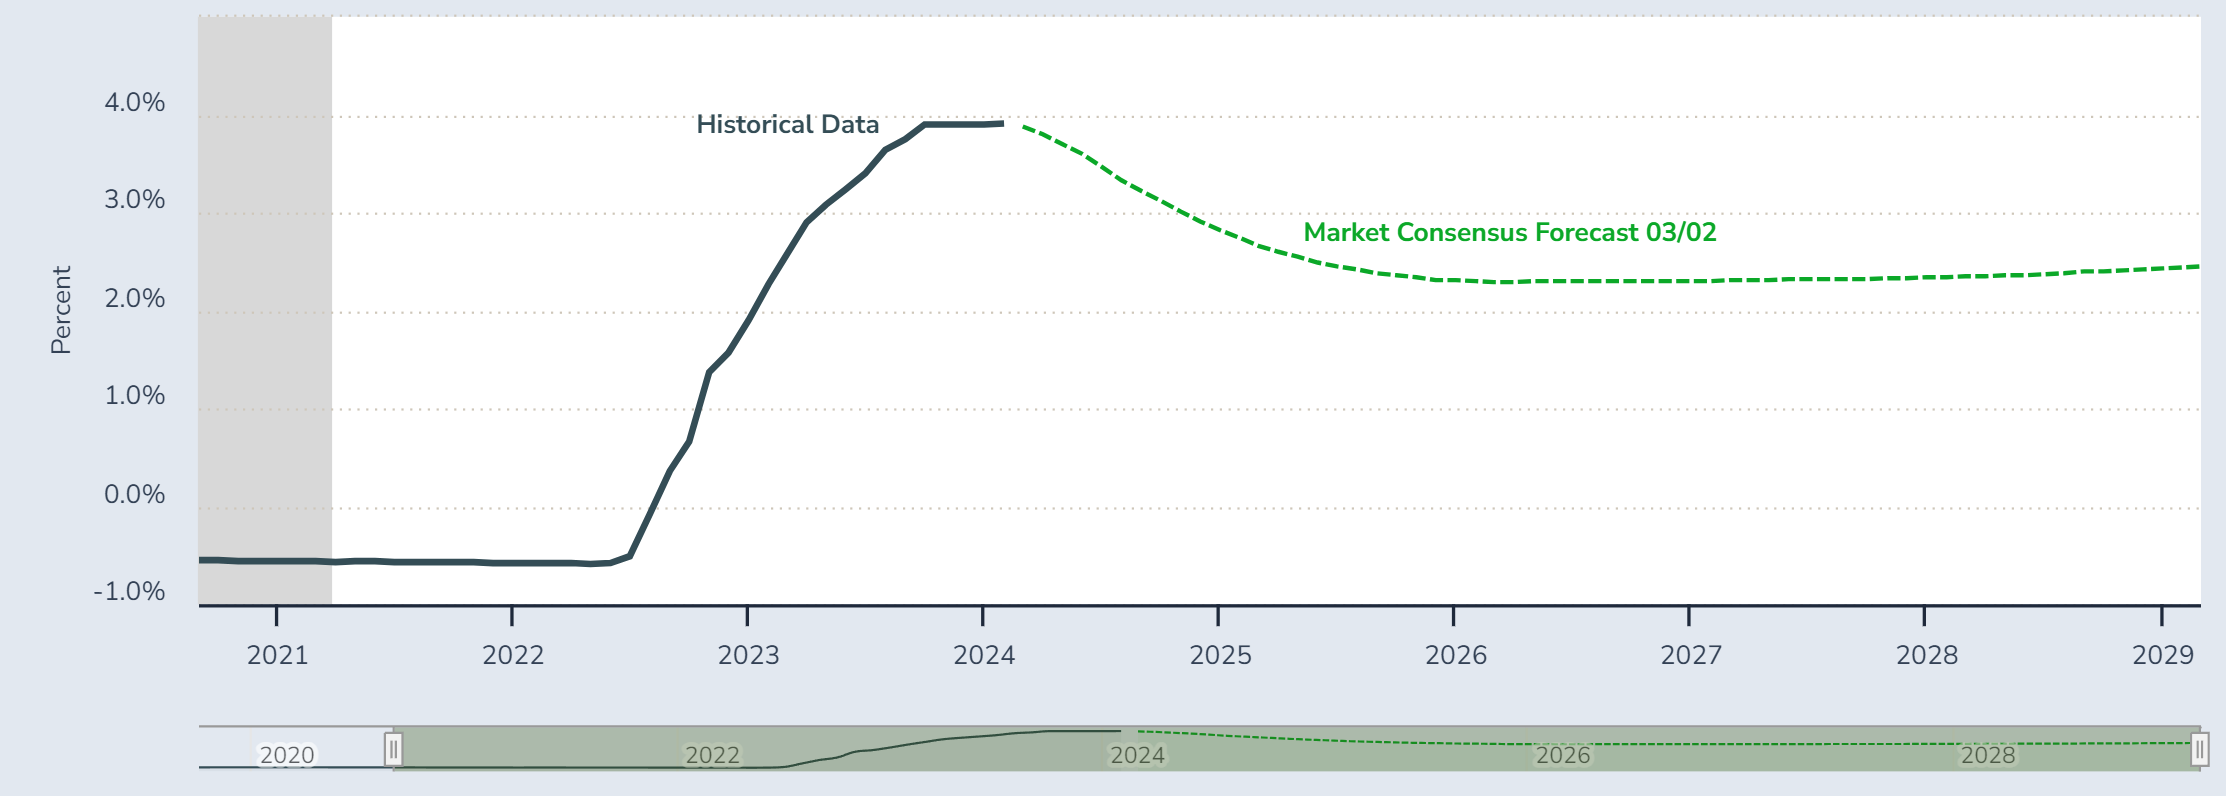
Figure 39. Market Expectations Over The European Central Bank’s Monetary Policy Rate. ( Long-Run Median Rate At 2.25% )
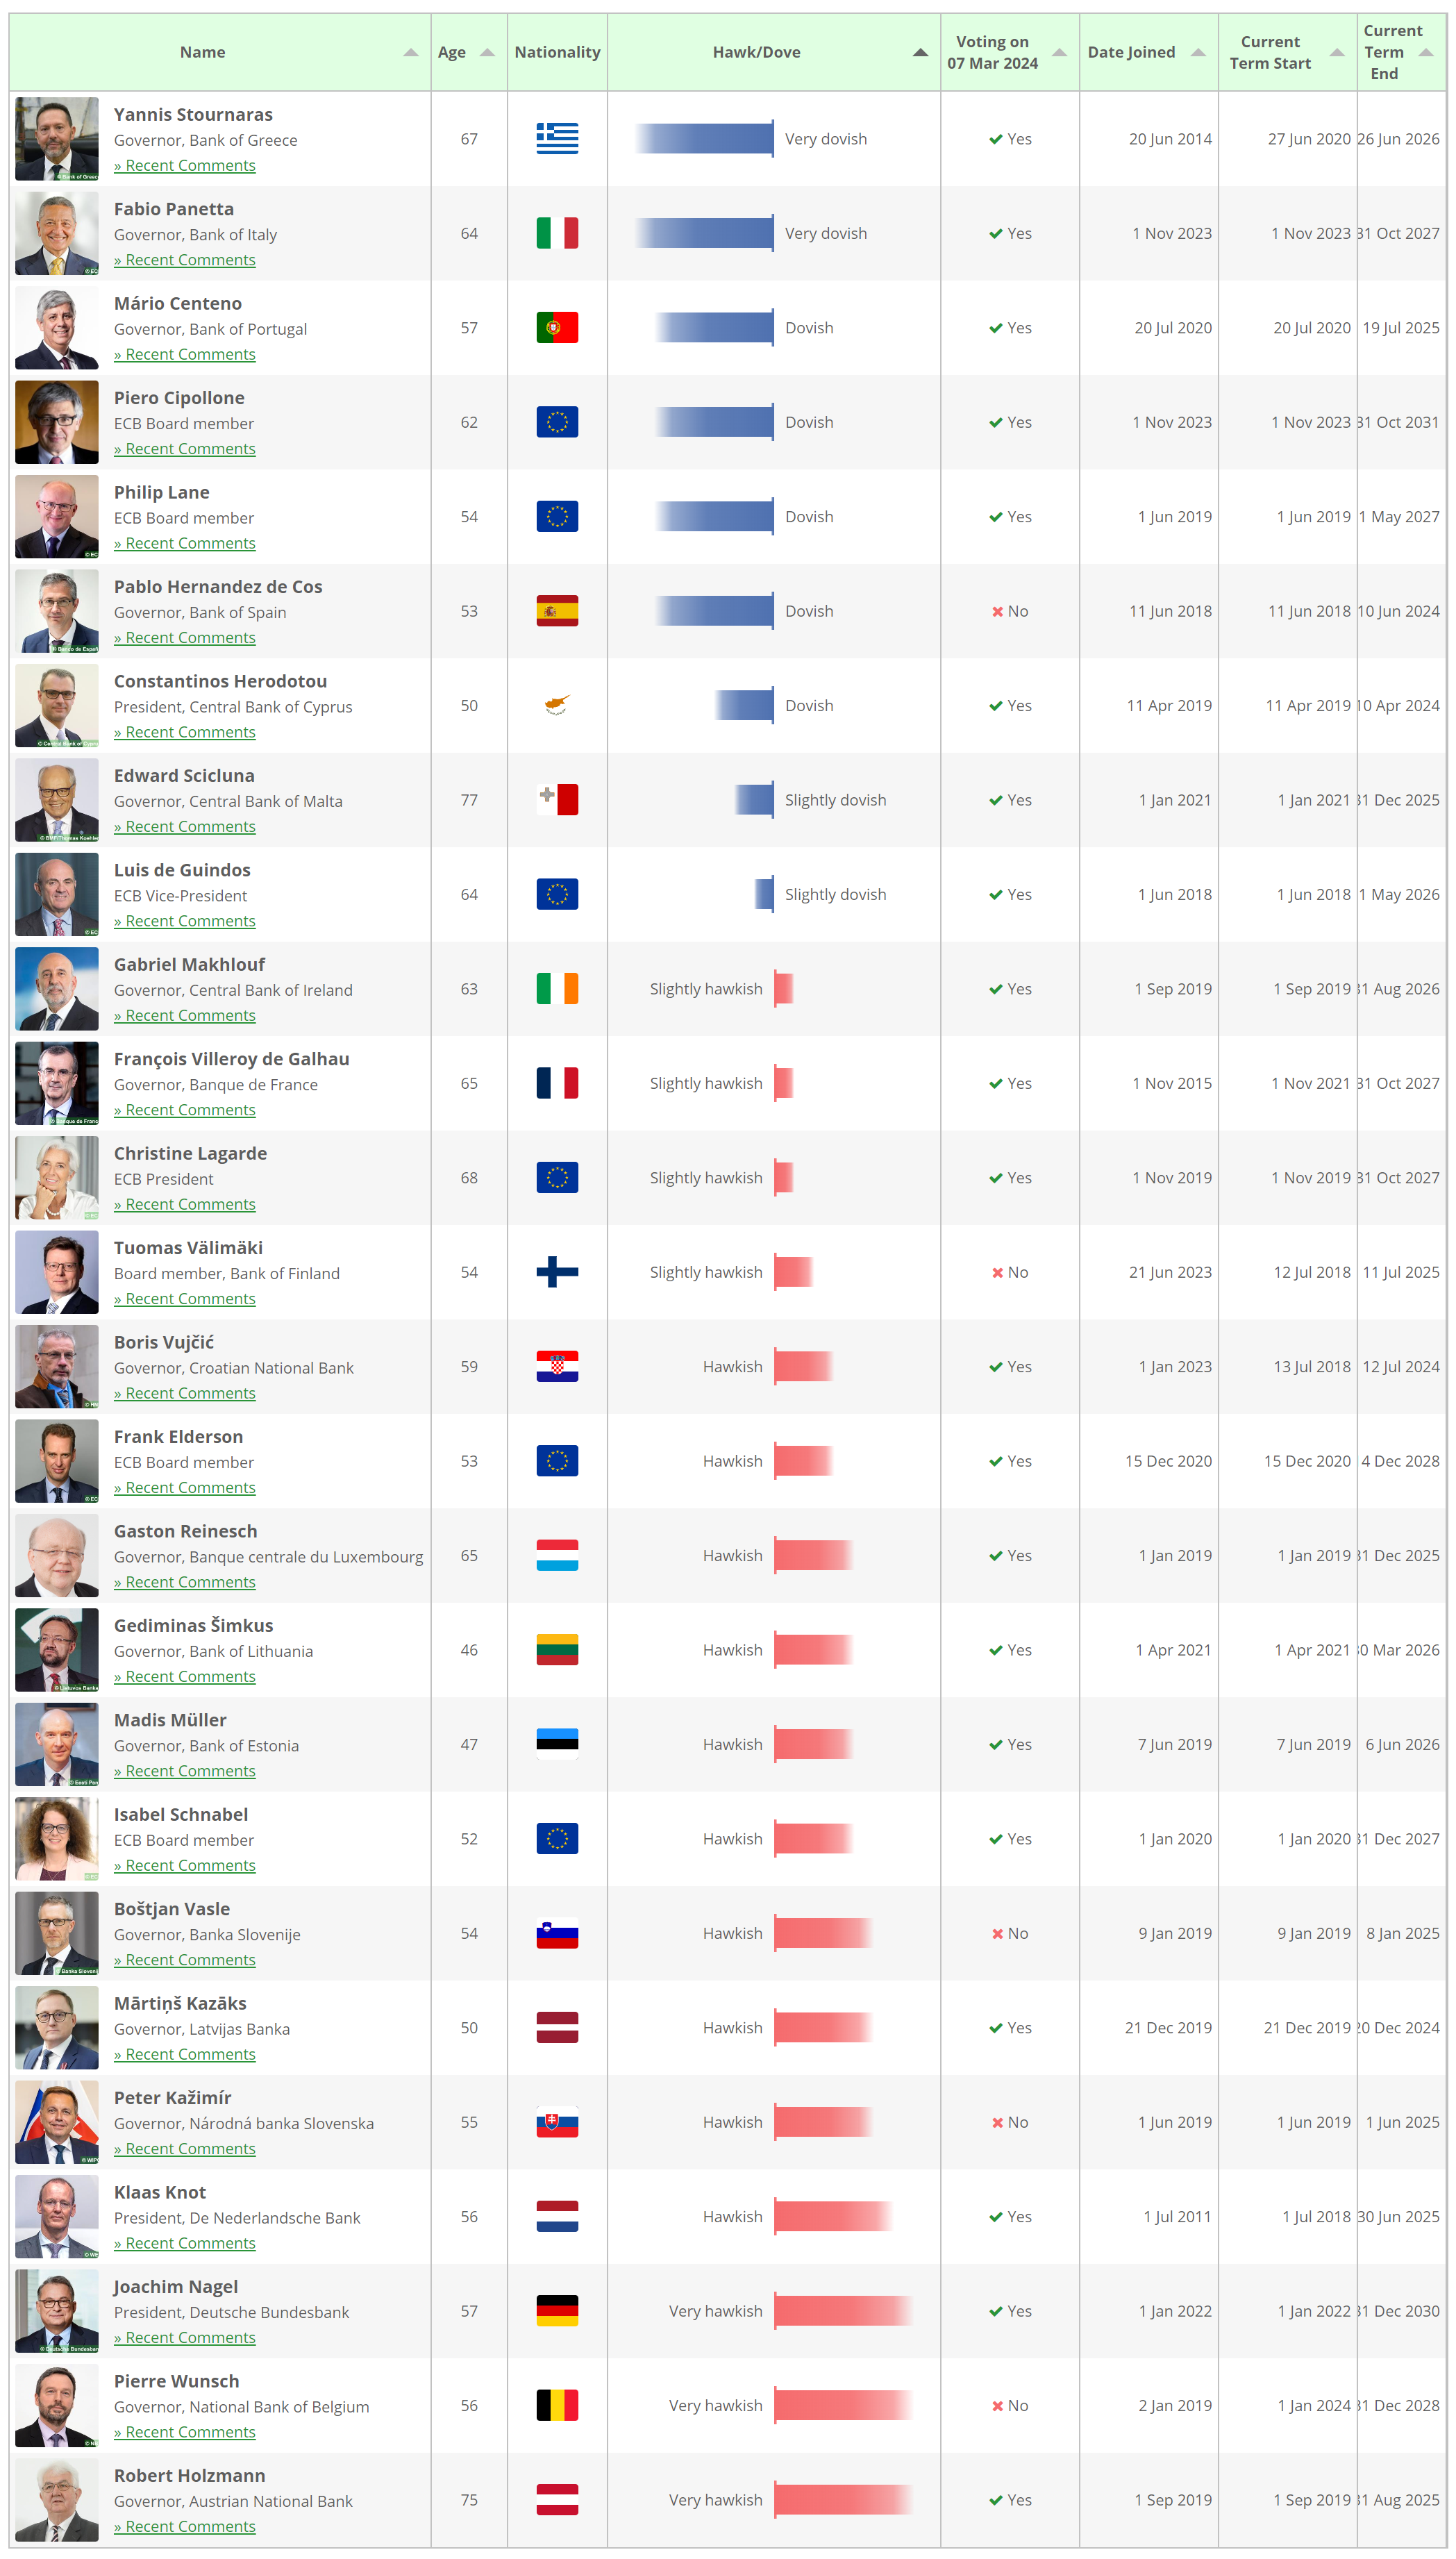
The European Central Bank’s Governing Council members remain hawkish, which is appropriate given that inflation has yet to reach the European Central Bank’s price stability goal. Ms. Lagarde’s remarks remain hawkish but nimble, highlighting the fact that inflationary pressures are persistent.
Figure 40. European Central Bank’s Governing Council Hawk & Dove Members.
The previously mentioned European countries’ measures that phased out Russian natural gas use, continue to ensure electric grid stability in the Euro-Zone; record natural gas production in Norway, which is the main supplier of Europe, continues to pressurize natural gas prices (KOLD 0.00%↑), allowing the European Central Bank’s Governing Council members to address inflationary pressures more effectively. Markets in Europe keep betting on the soft-landing path, as do markets in the United States, as statistics reinforce the narrative. This is reflected in the markets’ performance.
Figure 41. DB Eurozone Gross Equity Futures Index.
[ Left Y-axis: Index data. (🟦) | Right Y-axis: Volatility of the index. (🟥) ]
![[ Left X-axis: Index data. (🟦) | Right X-axis: Volatility of the index. (🟥) ] | Data as of 03/01/2024 market close. |](https://substackcdn.com/image/fetch/$s_!nINL!,f_auto,q_auto:good,fl_progressive:steep/https%3A%2F%2Fsubstack-post-media.s3.amazonaws.com%2Fpublic%2Fimages%2Fc44237bc-5a2e-42ea-b539-564d1a66532b_3804x1934.png "[ Left X-axis: Index data. (🟦) | Right X-axis: Volatility of the index. (🟥) ] | Data as of 03/01/2024 market close. |")
Figure 42. Croci World EUR Master TR Index.
[ Left Y-axis: Index data. (🟦) | Right Y-axis: Volatility of the index. (🟥) ]
![[ Left X-axis: Index data. (🟦) | Right X-axis: Volatility of the index. (🟥) ] | Data as of 03/01/2024 market close. |](https://substackcdn.com/image/fetch/$s_!xUI7!,f_auto,q_auto:good,fl_progressive:steep/https%3A%2F%2Fsubstack-post-media.s3.amazonaws.com%2Fpublic%2Fimages%2F3113fa2a-162f-42c6-9705-210a3cede197_3809x1925.png "[ Left X-axis: Index data. (🟦) | Right X-axis: Volatility of the index. (🟥) ] | Data as of 03/01/2024 market close. |")
Next week’s European Central Bank rate decision is expected to be a hawkish hold, with no rate hike, given that inflation is approaching the European Central Bank’s price stability goal. The press conference following the rate decision will most likely reveal the forward rate path, with markets and economists expecting a dovish stance. The forward macroeconomic data releases are expected to skew the forward monetary policy stance, but the European Central bank’s press conference should provide a less speculative and more concrete forecast.
Figure 43. This & Next Week’s Data Expectations.

When it comes to geopolitics, the developments in Ukraine keep being concentrated in the same regions. Although Russia has been trying to expand in Europe, Russia’s intentions, rather than unification, are aimed at destabilizing Europe by preventing Moldova’s accession to the European Union. Ukraine’s accession to the European Union can be discarded, but NATO allies have signaled their plausible support for Ukraine with more than just good wishes and supplies. France may send troops to Ukraine, which would likely escalate the war.
Figure 44. Russo-Ukrainian War Situation Map.

I doubt NATO will send troops to Ukraine, but it would demonstrate that NATO is committed to defend freedom with more than good wishes and supplies. After years of coward proxy wars; NATO sending troops to Ukraine would show courage given the fact that NATO would invoke UN Article 51 / EU Mutual Defense Clause, as well as NATO Article Five. I also doubt Russia’s nuclear conflict message to NATO is factual, as nobody wins a nuclear war, I believe Russia is afraid of entering in direct conflict with NATO. Is NATO prepared to go to war with Russia? This is the current question.
United Kingdom:
The United Kingdom is performing within the range of expectations. The United Kingdom’s Prime Minister Rishi Sunak’s economic and legislative policies have attemped to keep the United Kingdom’s economy afloat. Although the United Kingdom’s Gross Domestic Product (GDP) growth is somewhat concerning, considering that recent data show that the United Kingdom has entered a technical recession, failing to reach Prime Minister Rishi Sunak’s pledge to grow the United Kingdom’s economy.
Figure 45. Latest Statistics Show The United Kingdom In A Technical Recession, Failing To Reach Prime Minister Rishi Sunak’s Pledge To Grow The United Kingdom’s Economy.
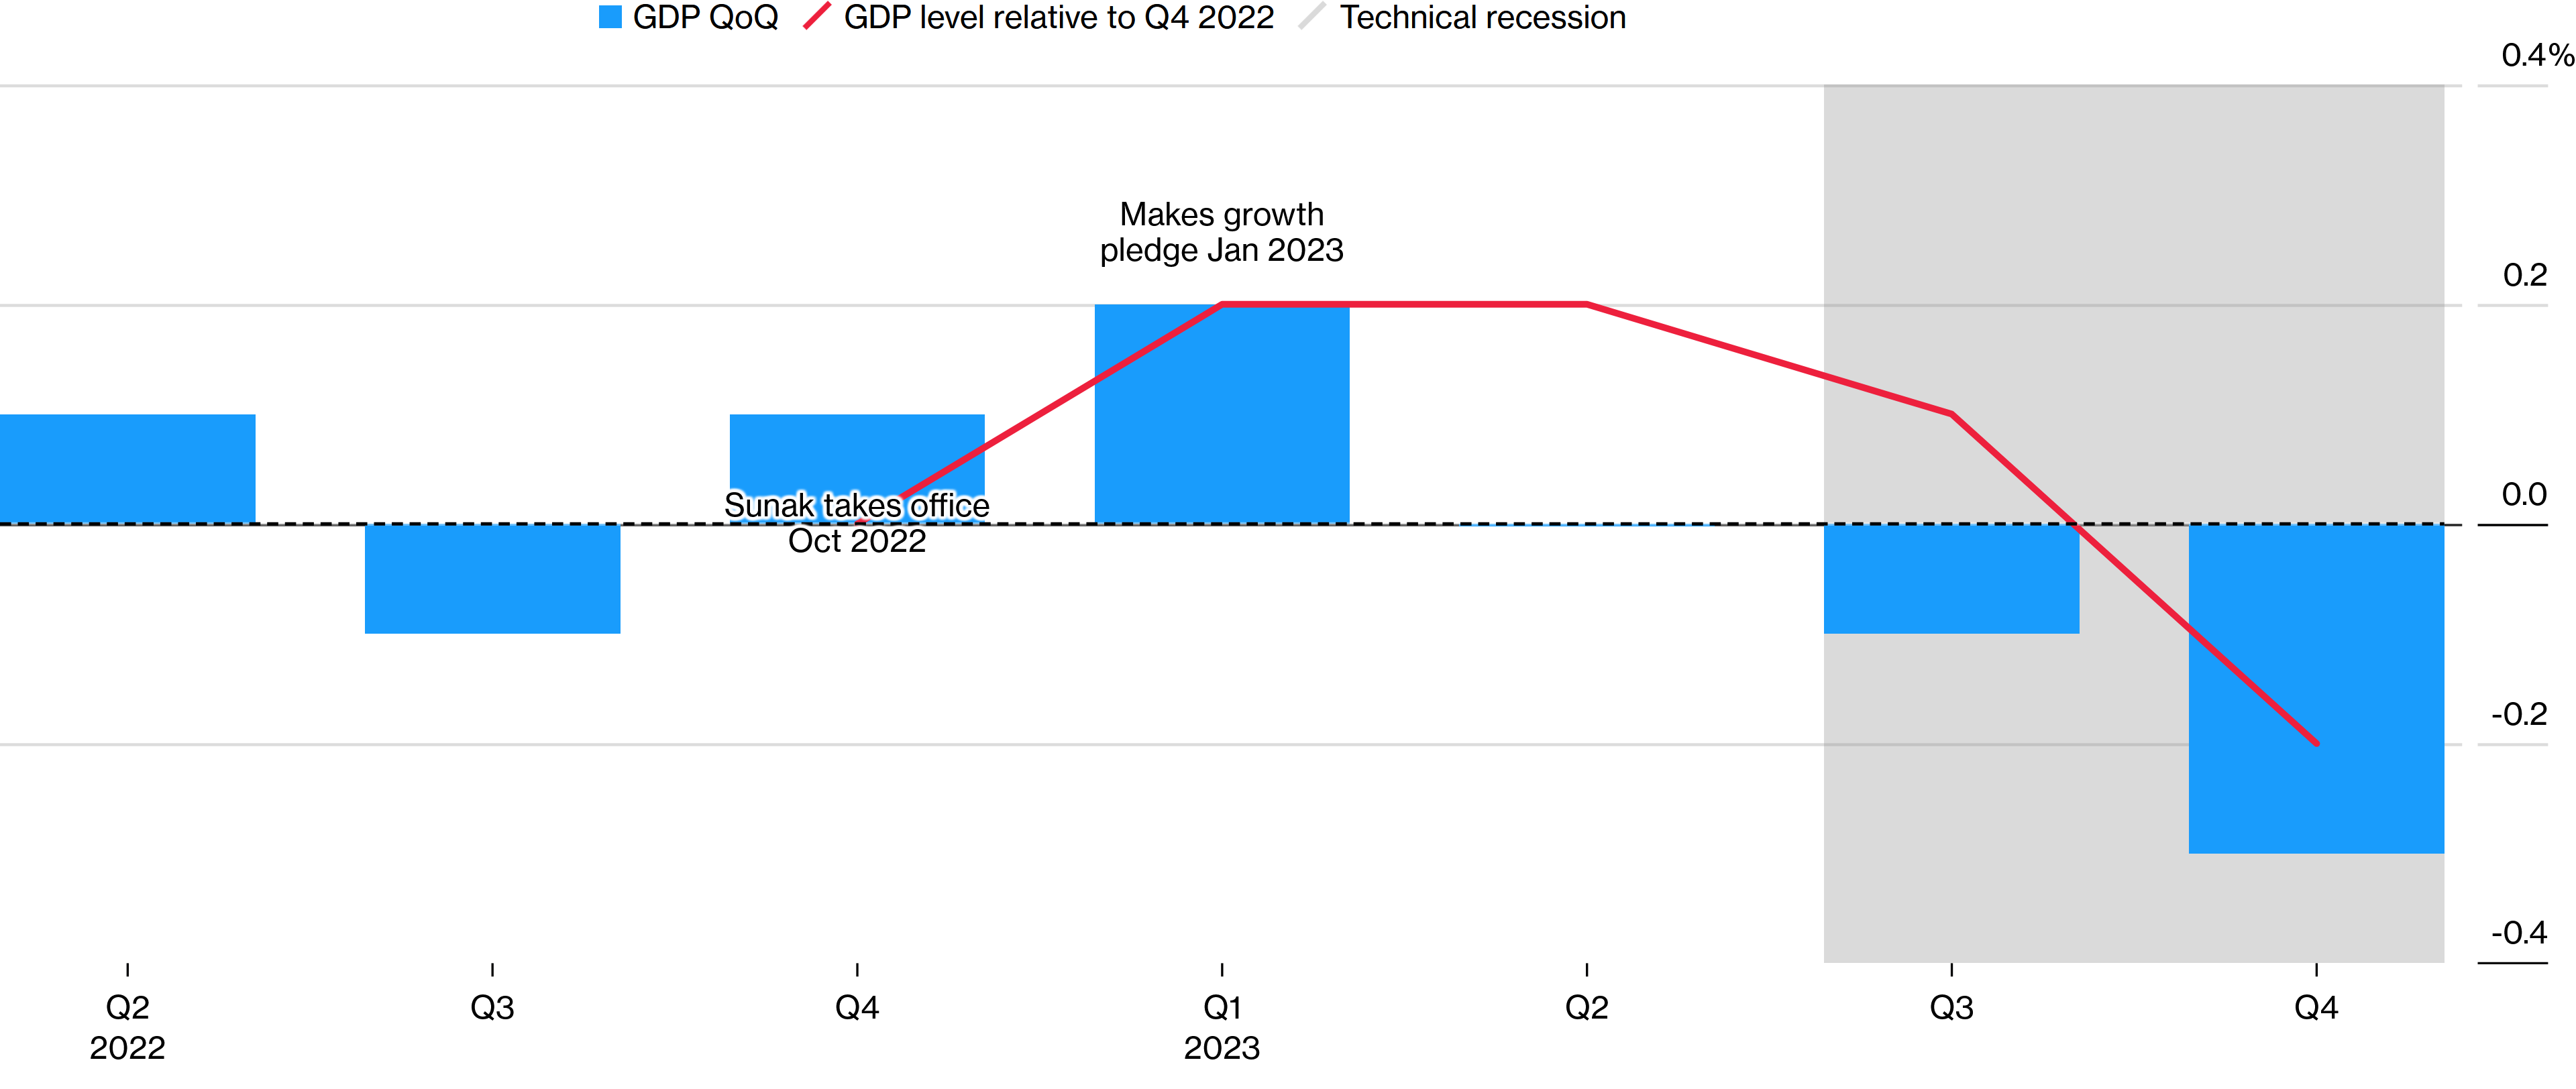
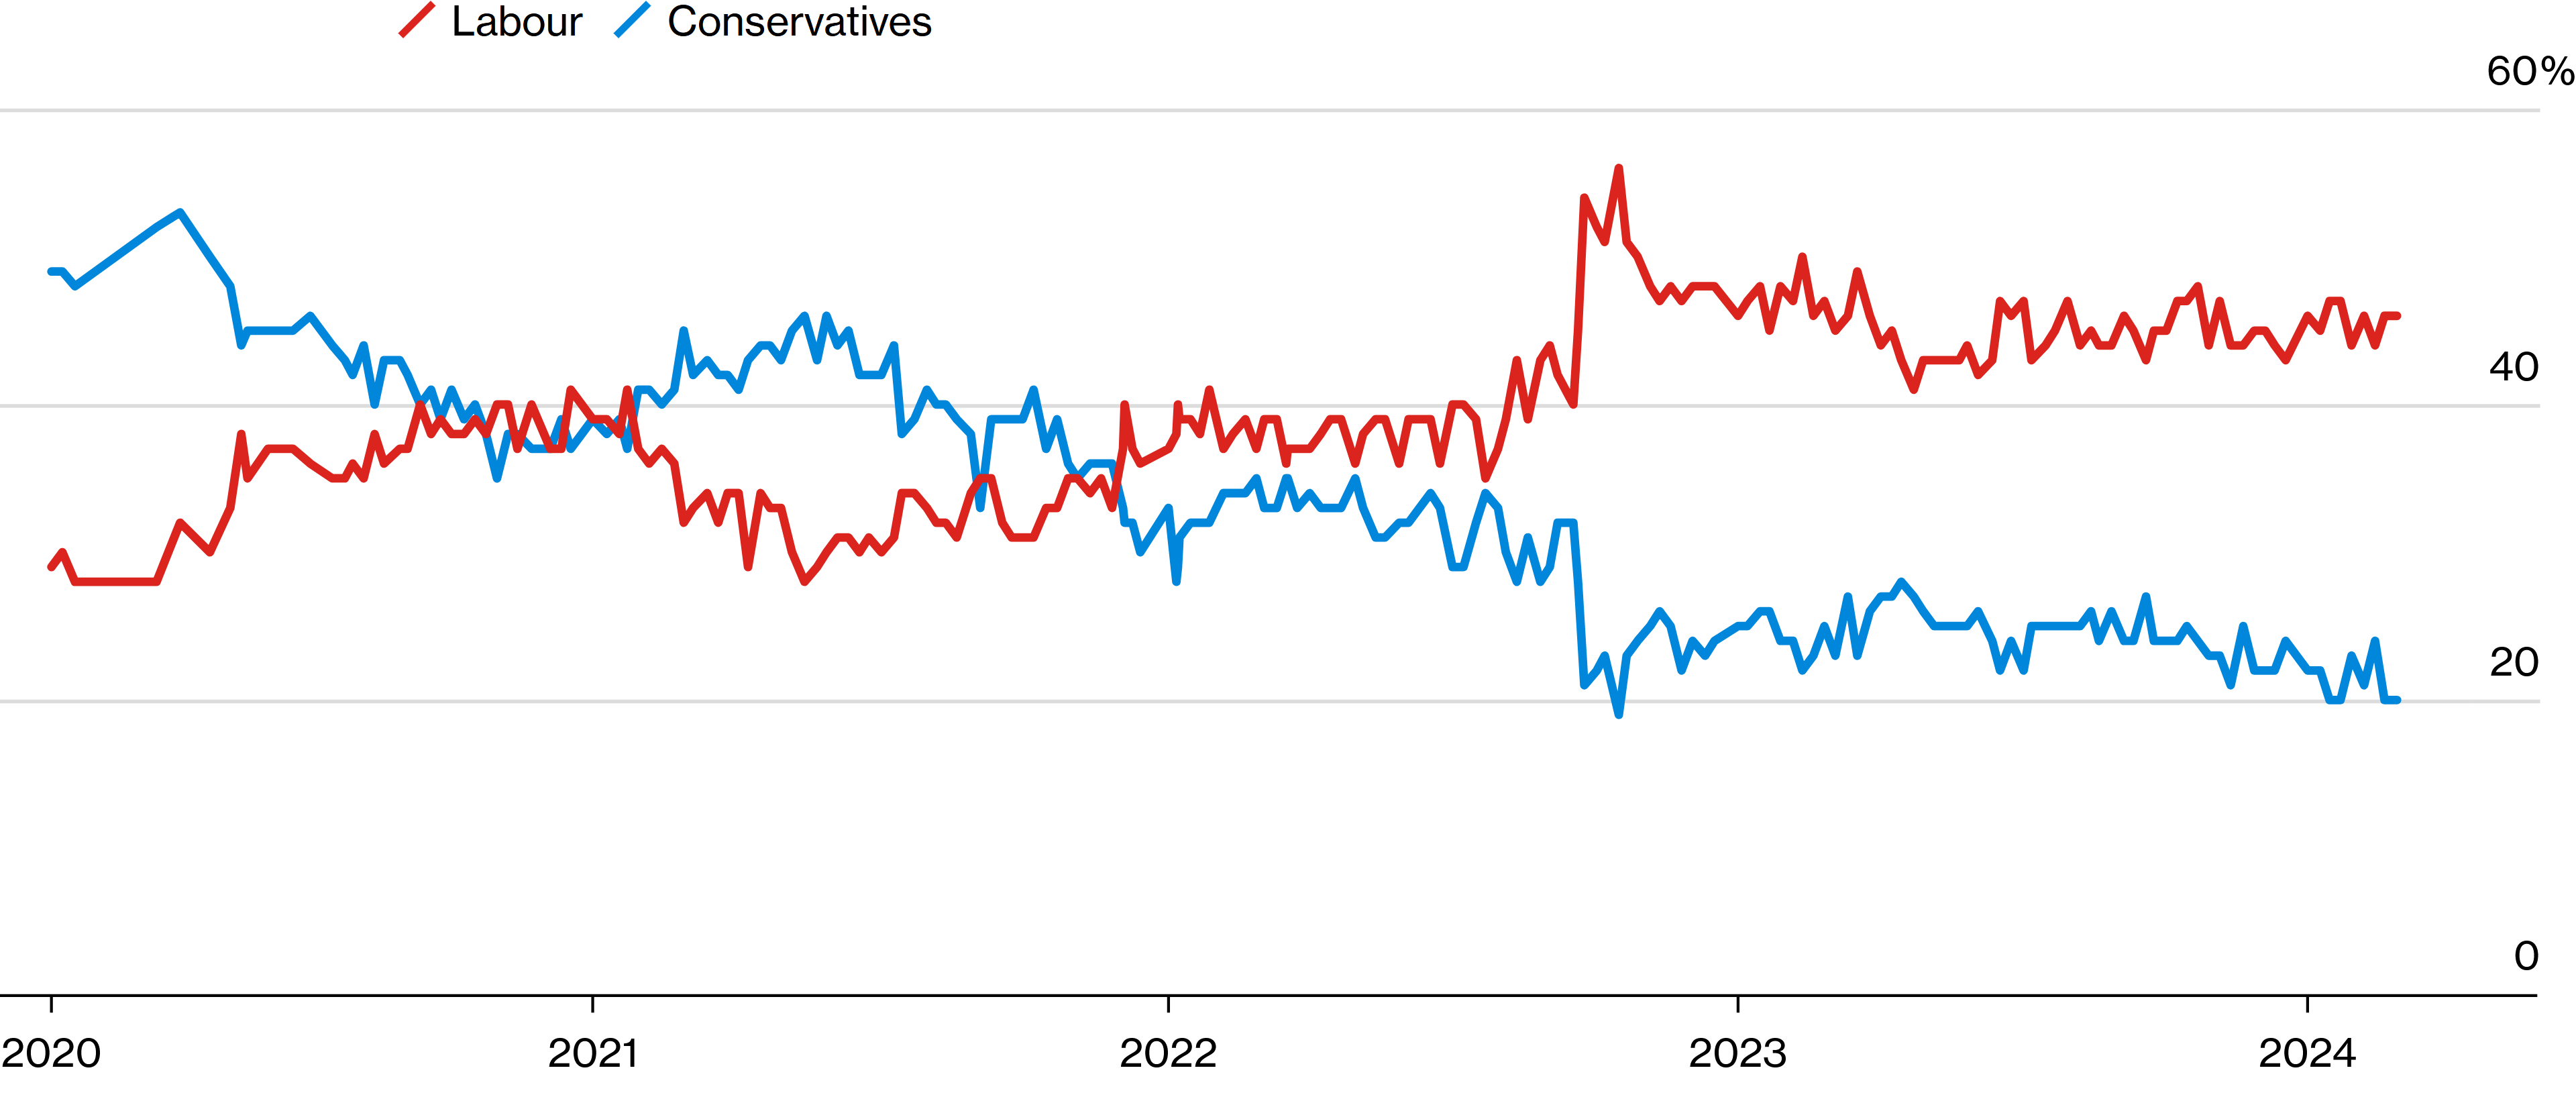
Figure 46. Conservatives Keep Losing Britons’ Support After Government Goals Aren’t Reached.
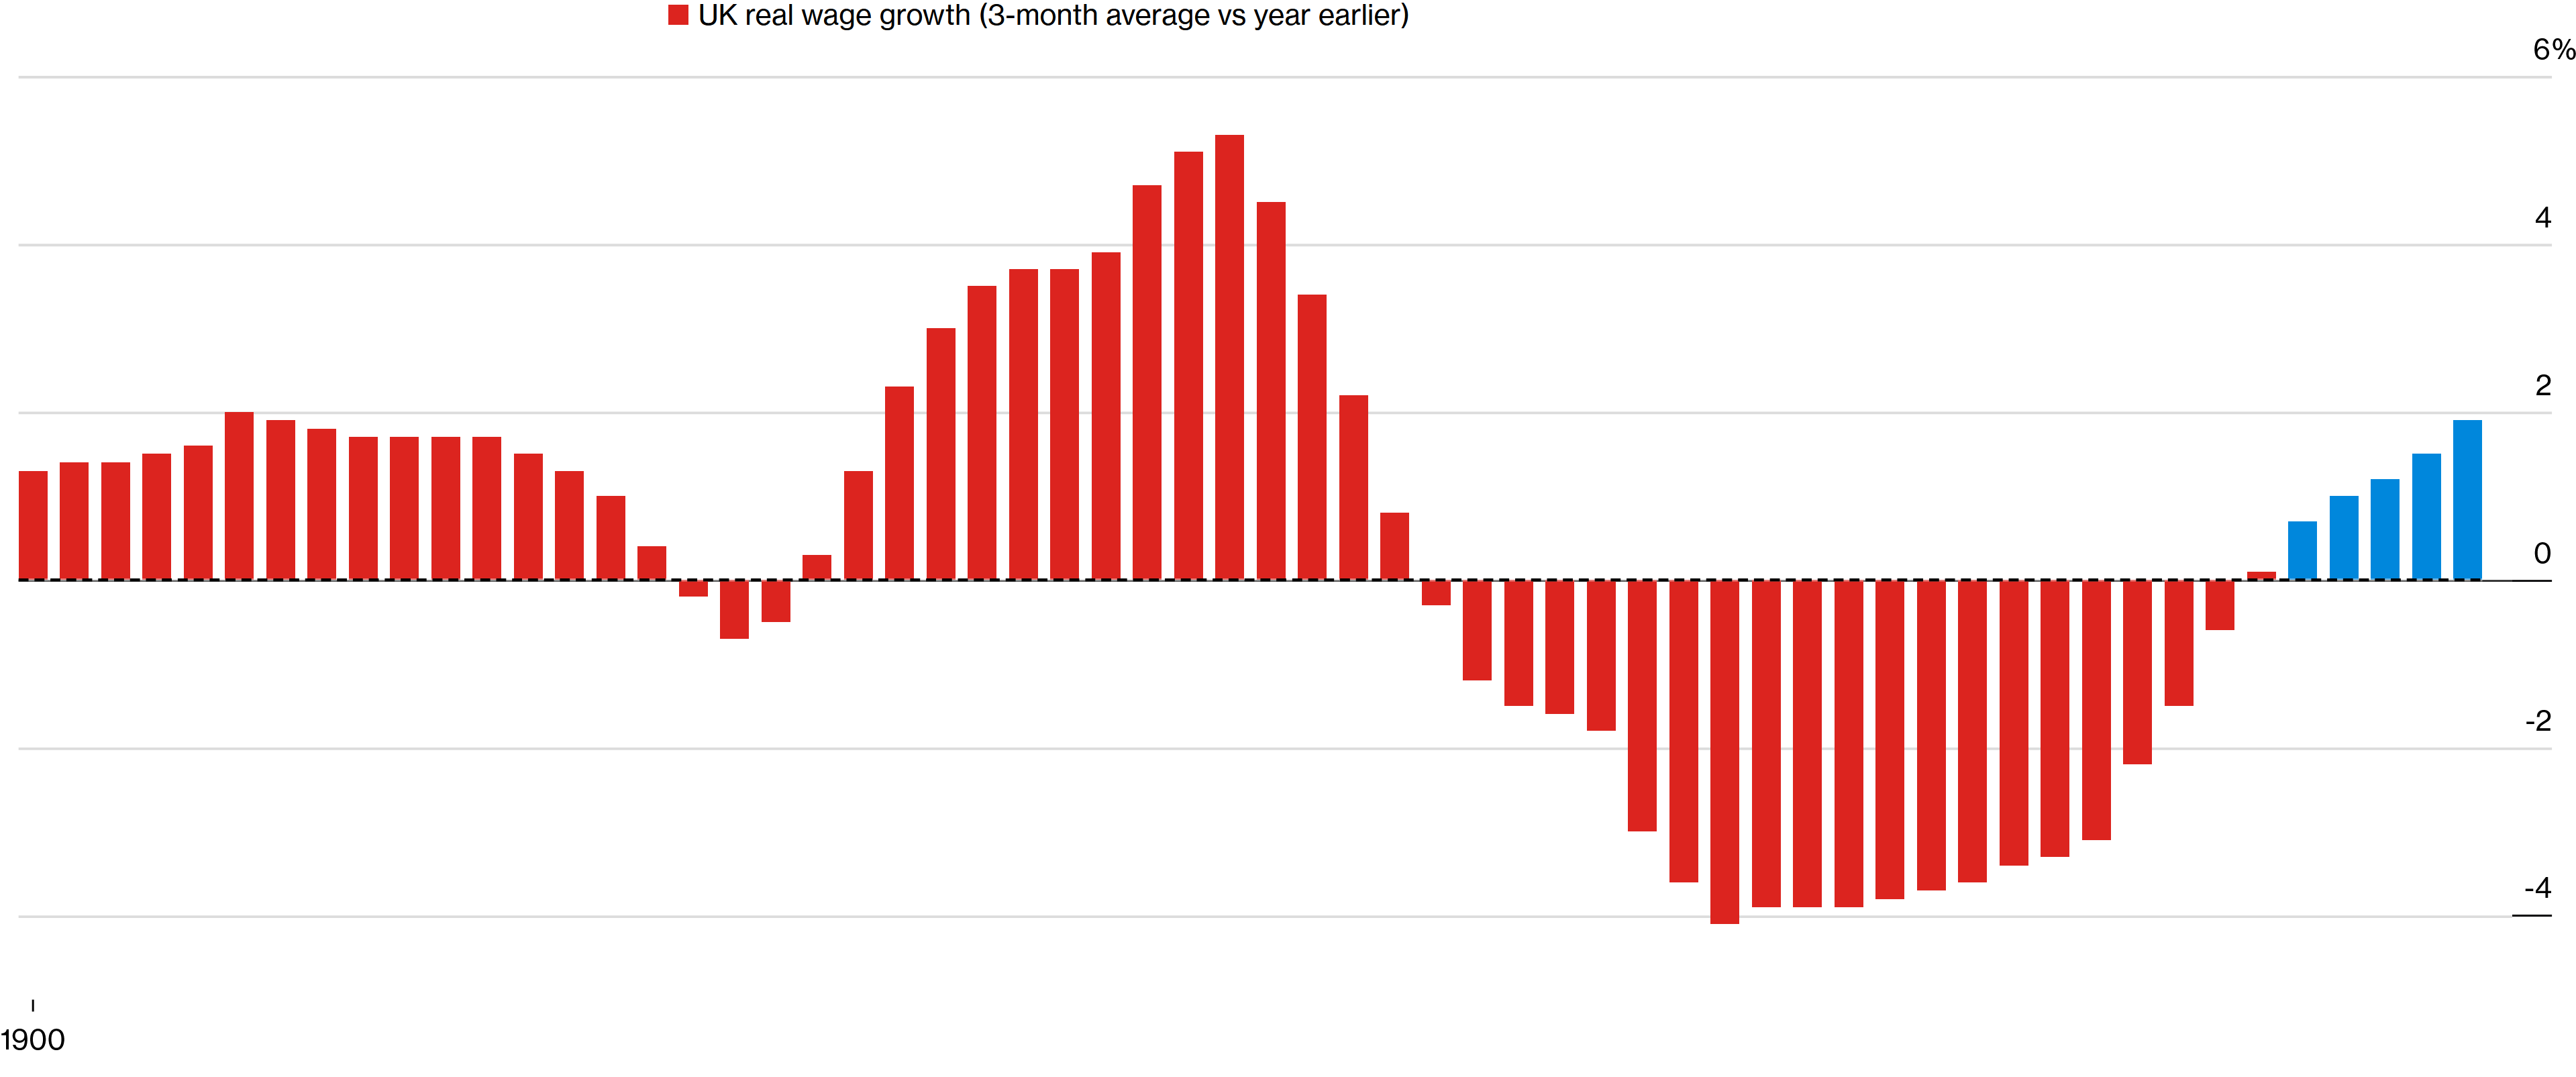
Lower inflation has given Britons more purchasing power, boosting real wage growth. Government tax cuts may increase Gross Domestic Product (GDP) growth, but they will lead the nation’s economy towards an unsustainable path, notwithstanding prudent government path.
Figure 47. Lower Inflation Has Given Britons More Purchasing Power, Boosting Real Wage Growth.
Factories in the United Kingdom have increased prices the most in a while; this may be due to global supply chain disruptions caused by warfare ( previously explained in detail ). Recent statistics show that the United Kingdom’s industrial production rebounded; a bullwhip effect may be generating the rise in prices, but increases in industrial production will likely reduce prices in the long run as supply of goods will likely exceed demand. For the moment, the United Kingdom’s labor market remains strong, given the fact that the United Kingdom’s unemployment rate keeps lowering.
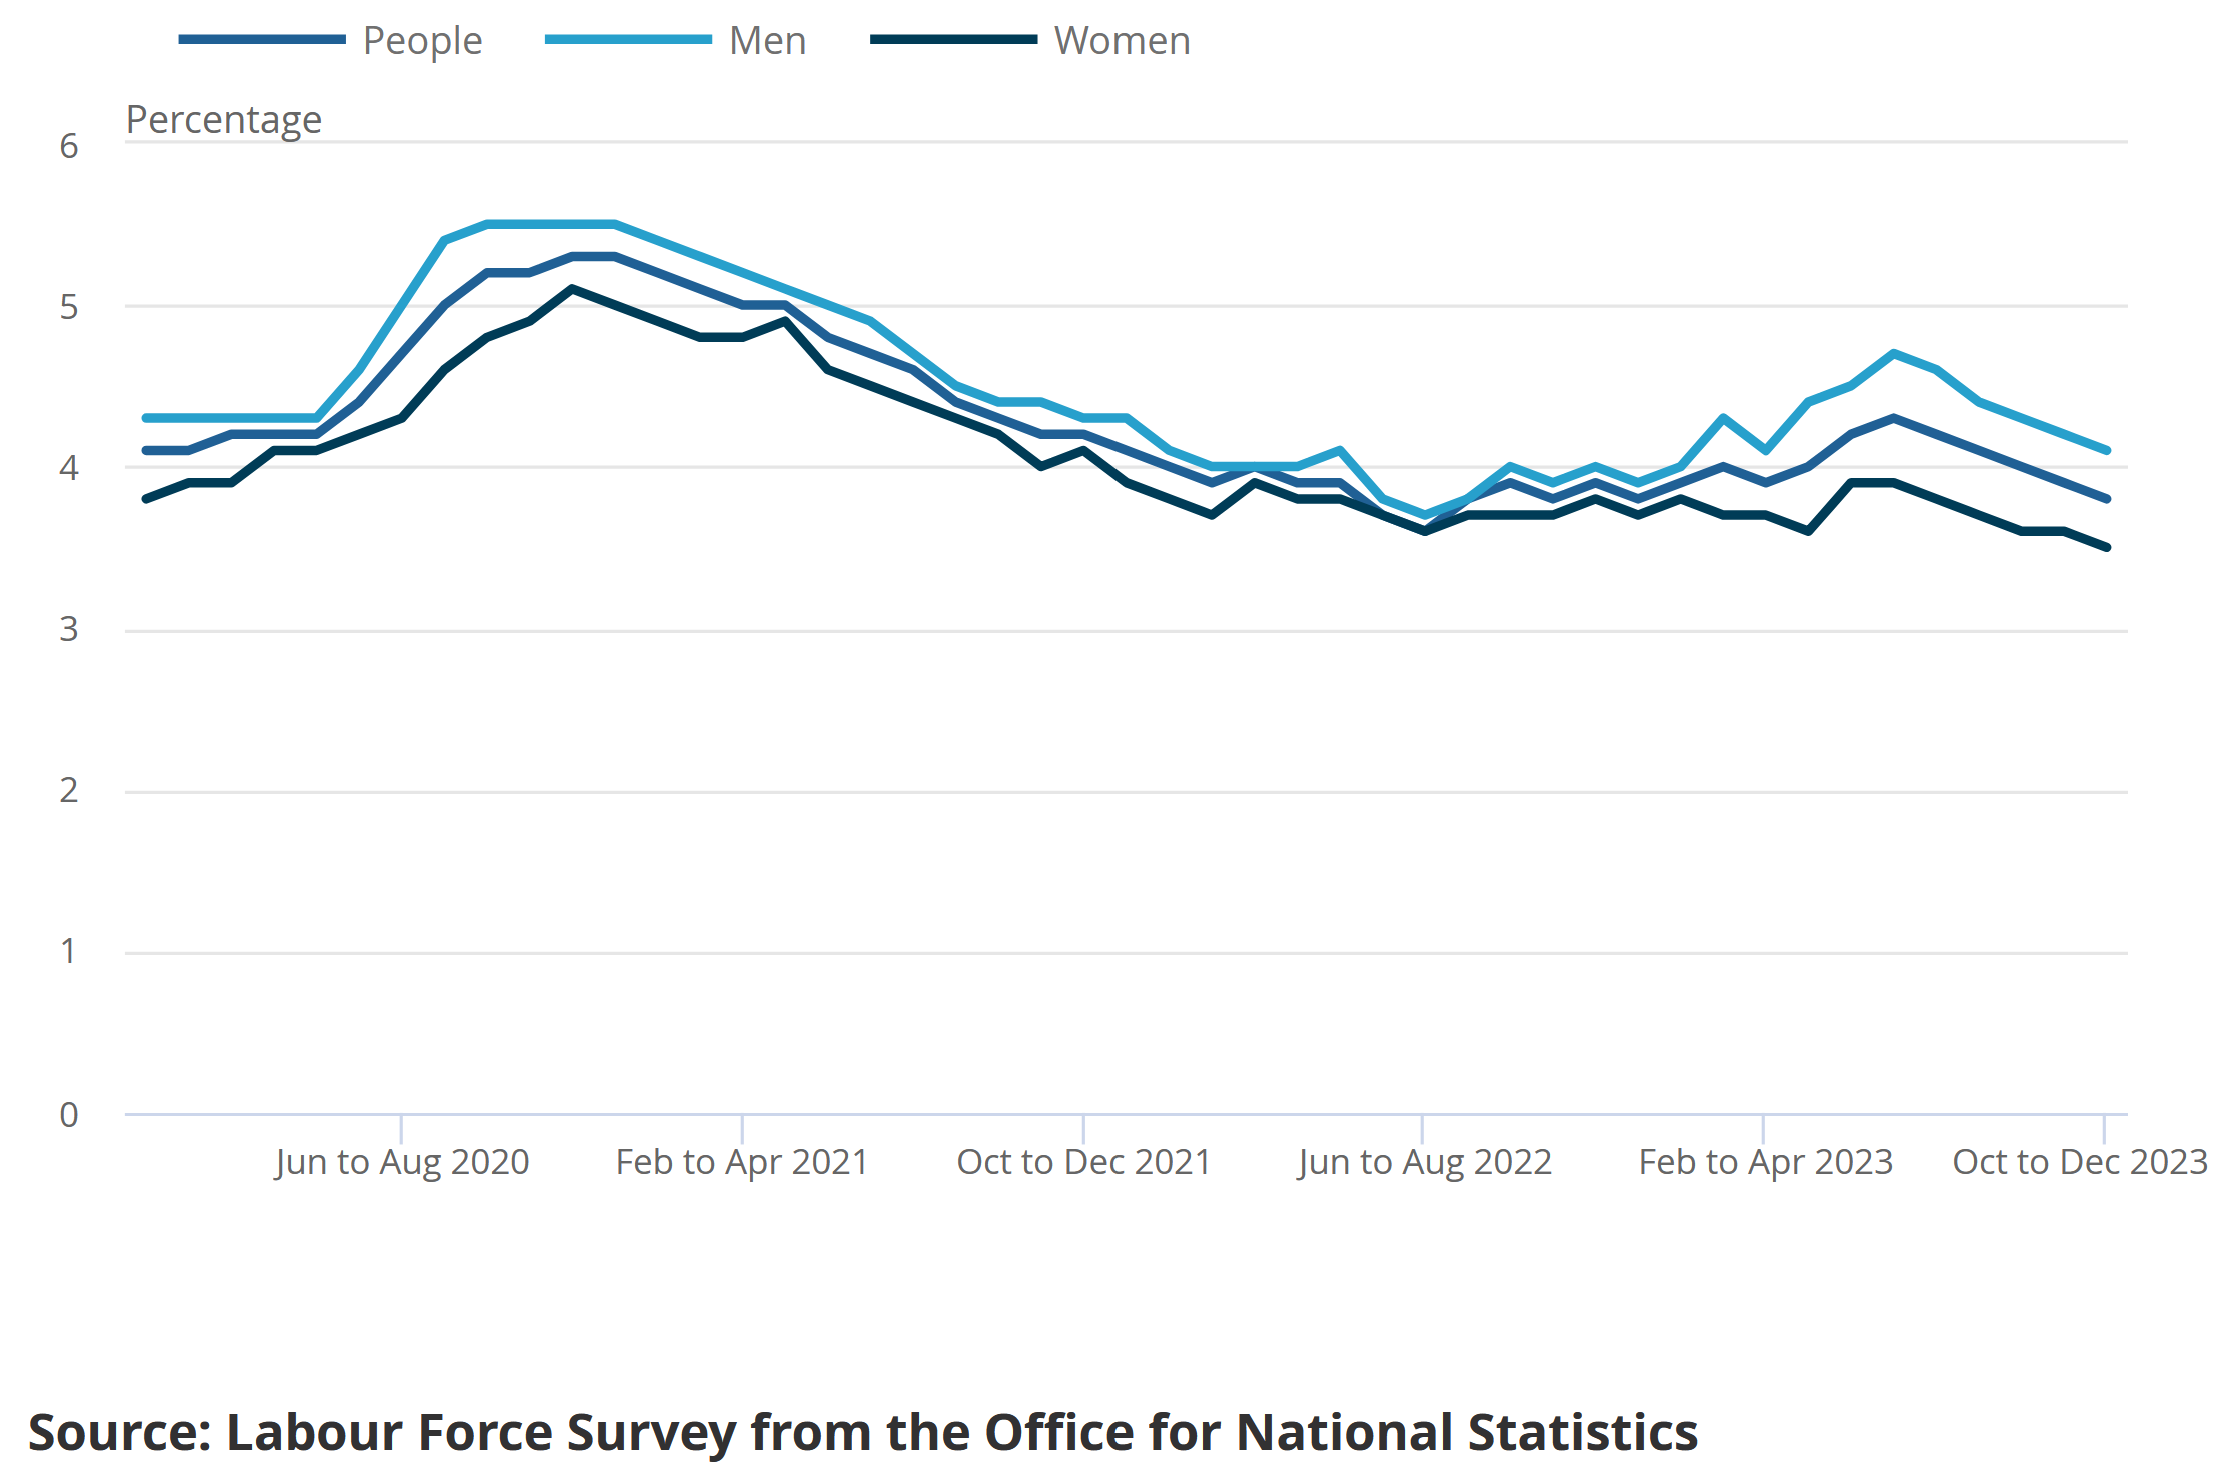
Figure 48. United Kingdom’s Unemployment Rate Keeps Lowering.
Forward Gross Domestic Product (GDP) data releases, along with the employment data releases, will likely give the Bank of England’s Monetary Policy Committee members a more certain picture of the current economy. For the moment, markets keep being far more dovish than the Bank of England’s Monetary Policy Committee members are.
Figure 49. Market Expectations Over The Bank of England’s Monetary Policy Rate. ( Long-Run Median Rate At 3.75% )
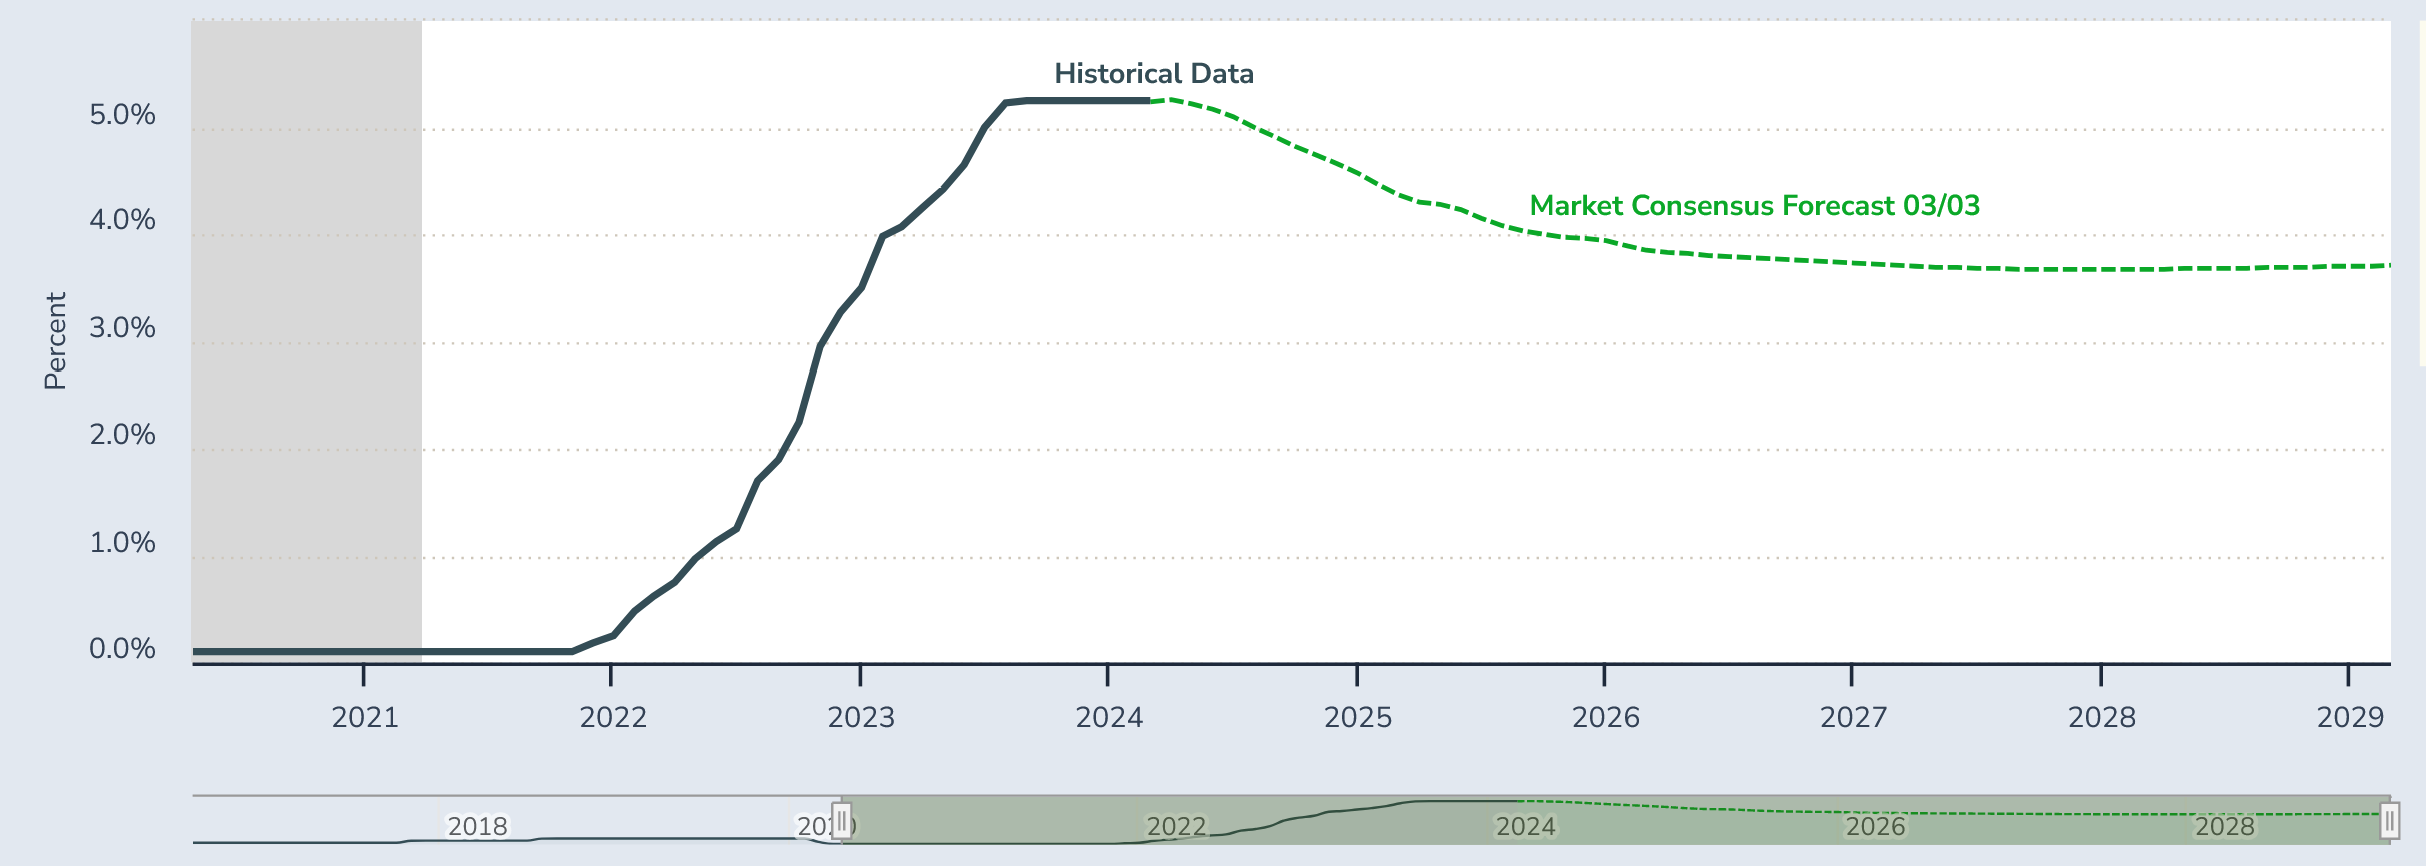
Figure 50. Bank of England Monetary Policy Committee’s Hawks & Doves.

The United Kingdom government’s Spring Budget report will most likely indicate the United Kingdom’s forward path, as the United Kingdom is in a technical recession, this data release is quite important. The following figure shows the forward data expectations for the United Kingdom over the next two weeks.
Figure 51. This & Next Week’s Data Expectations.

If data releases are within the range of expectations, the United Kingdom’s GILT bond market should rise, along with the United Kingdom’s equities market.
Asia:
China:
The Chinese economy is performing in the range of expectations; government measures ensure that the Chinese economy doesn’t enter into a recession. The People’s Bank of China’ monetary policy measures are ensuring stability in the Chinese economy, Chinese markets don’t reflect the health of the Chinese economy. Recent statistics show that economic activity has recovered to pre-pandemic levels, however deflation in China is always accompanied by a global recession.
Figure 52. Every Time There’s Deflation In China, There’s A Global Recession.

For the moment, expectations remain optimistic as the government measures enhance economic activity in the Chinese economy. The next inflation data releases are something to be attentive to, as are the imports and exports statistical data releases, as they’ll likely indicate the current macroeconomic activity, consequently indicating if the Chinese government and the People’s Bank of China have to adjust current their stance.
Figure 53. This & Next Week’s Data Expectations.

Taiwan is China, and China’s president 习近平 assured that (…) “China will surely be reunified, and all Chinese on both sides of the Taiwan Strait” (…), and so the forward expectations over geopolitics remain the same. China will likely keep reacting to any separatist provocation.
Figure 54. China-Taiwan Political-Military Events Map.
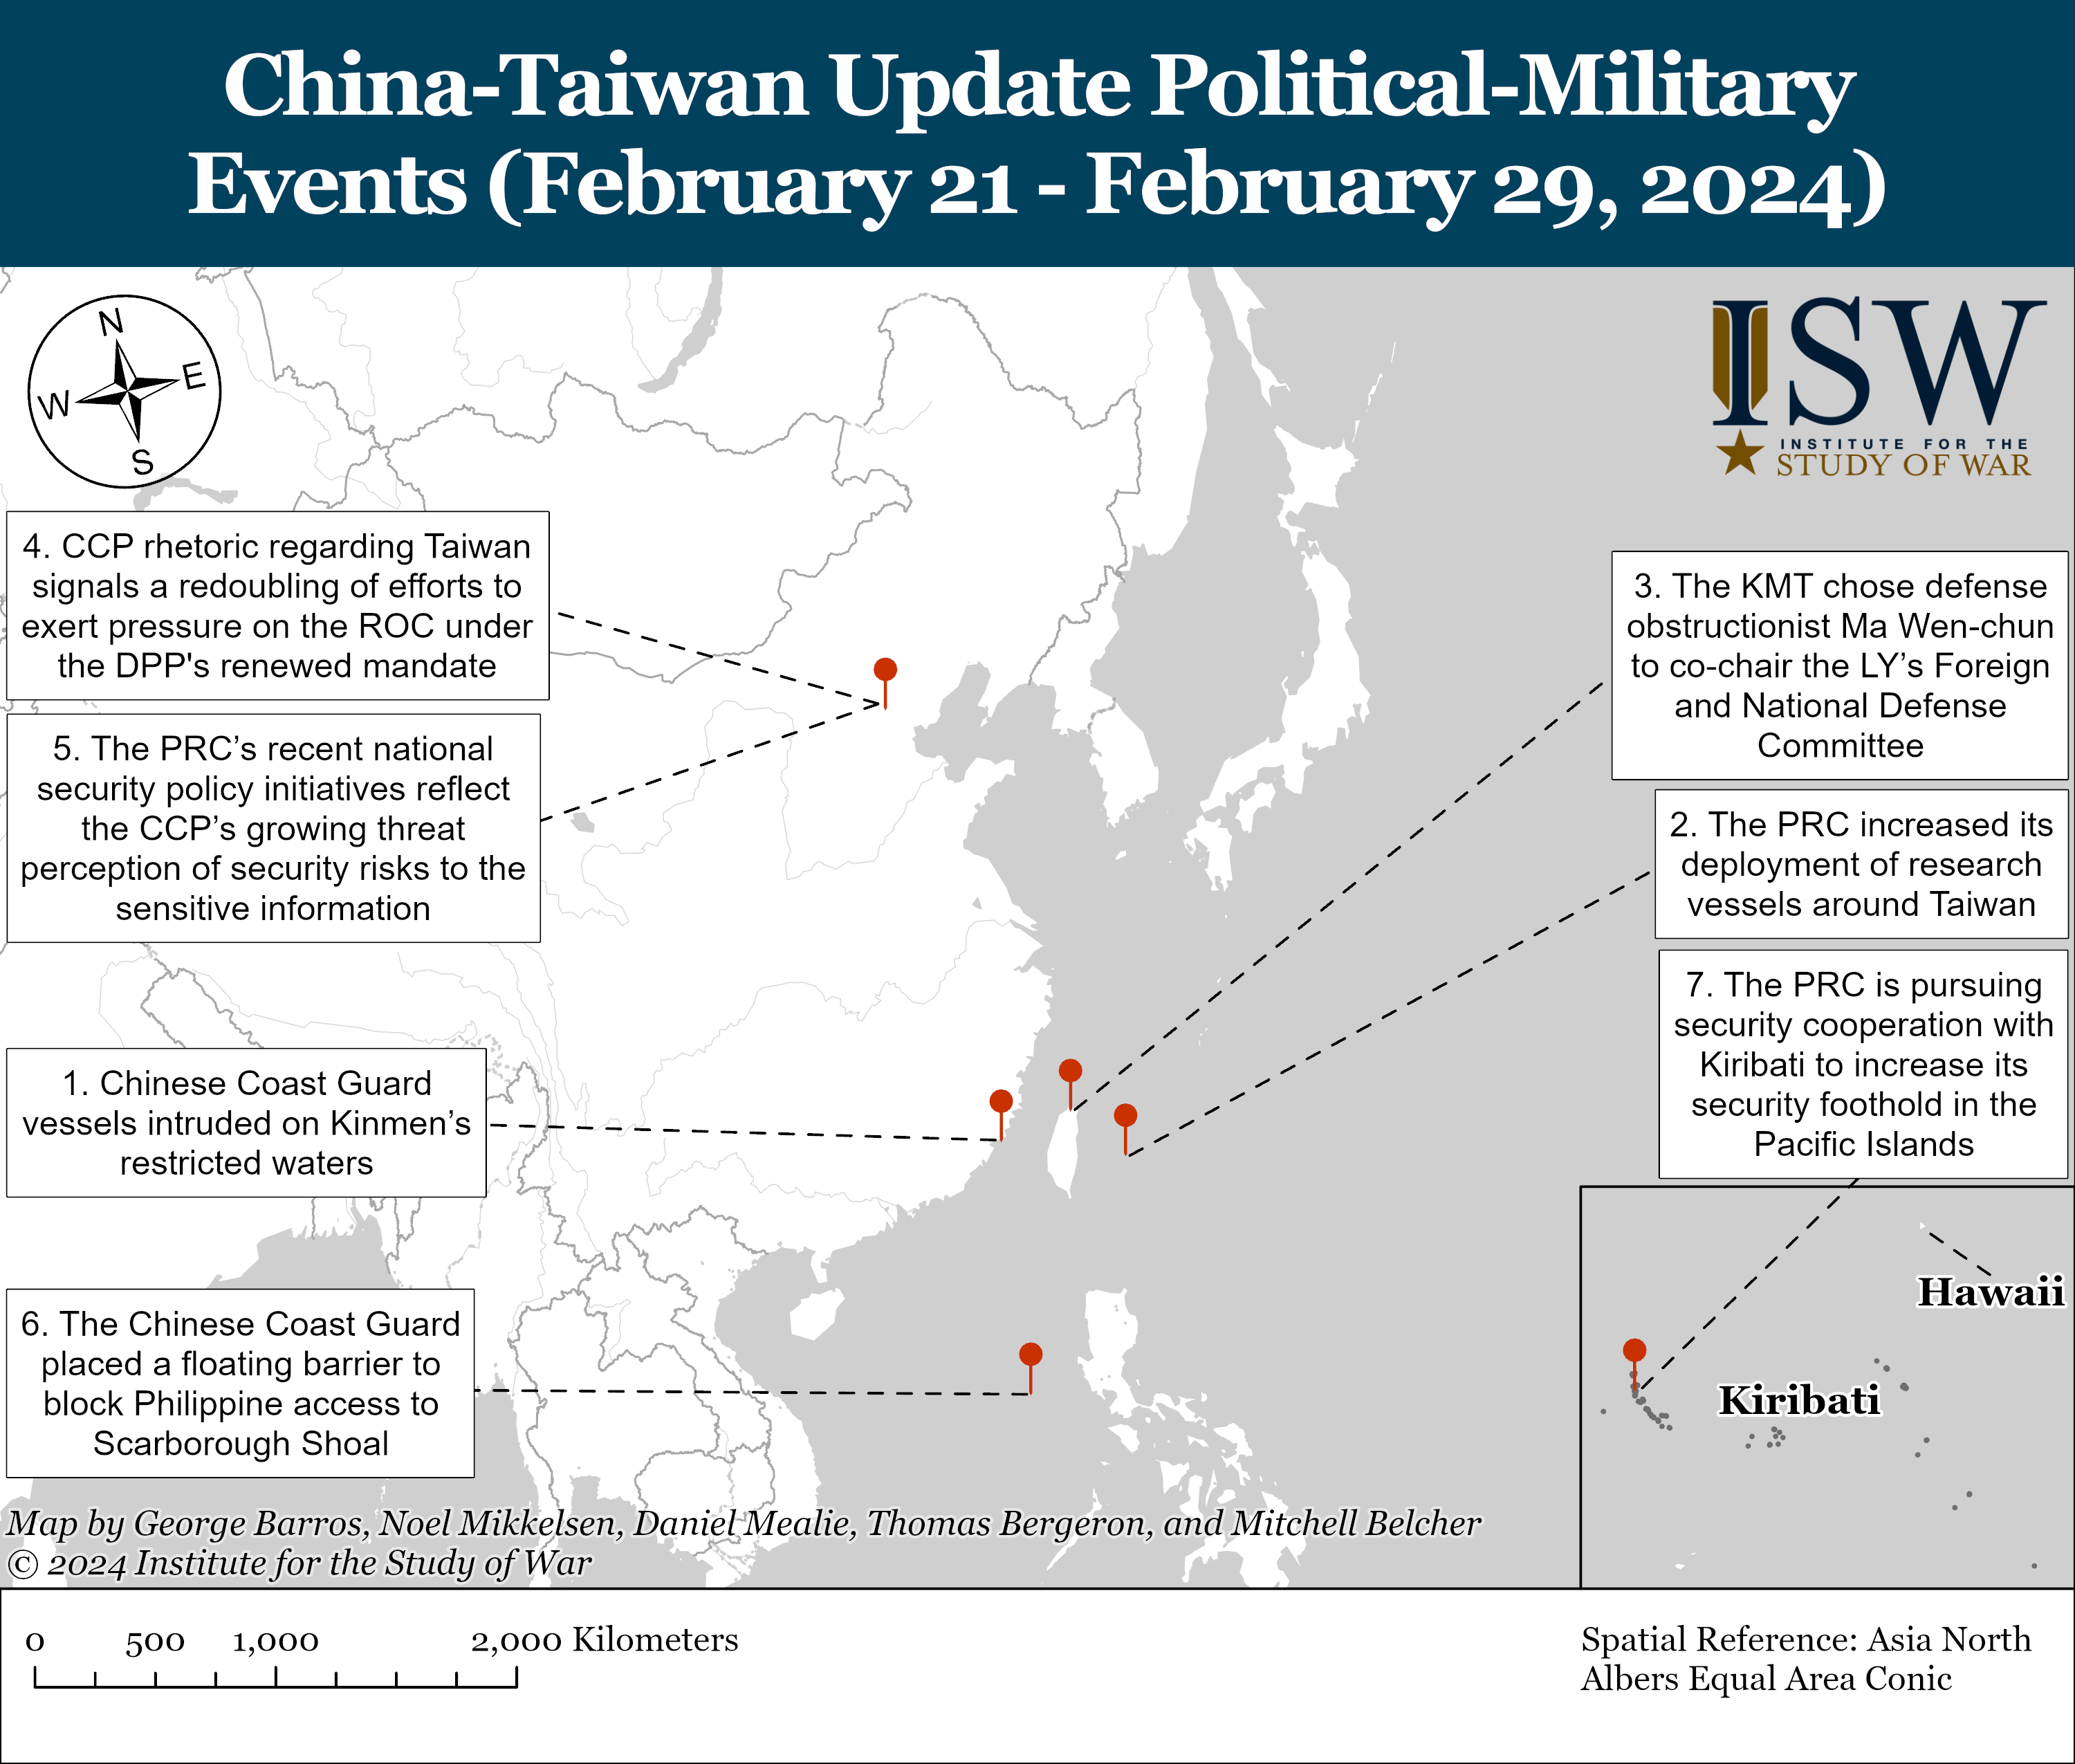
China’s PLA developments in the Taiwan Strait with research vessels may indicate that China is preparing for the reunification of Taiwan, as assured by China’s president 习近平. The next figure ( shown before ) shows the potential landing beaches for China’s PLA amphibious vehicles and Taiwan’s industrial, military, and logistics sites.
Figure 55. Potential Landing Beaches For Amphibious Vehicles & Taiwan’s Industrial, Military, and Logistics Sites Map:

To conclude, long-term expectations over China remain the same, as previously explained in detail in a post; here is the link to it if you want to read it:

Japan:
The Japanese government’s measures keep reducing the risk of recession in Japan, natural disasters have been a source of concern but overall downplayed; recent measures by the government will likely enhance forward economic activity in Japan; markets keep being optimistic over the forward performance of government and monetary policy measures, which is reflected in their performance.
Figure 56. CROCI Japan Index Total Return.
[ Left Y-axis: Index data. (🟦) | Right Y-axis: Volatility of the index. (🟥) ]
![[ Left X-axis: Index data. (🟦) | Right X-axis: Volatility of the index. (🟥) ] | Data as of 03/01/2024 market close. |](https://substackcdn.com/image/fetch/$s_!nzoo!,f_auto,q_auto:good,fl_progressive:steep/https%3A%2F%2Fsubstack-post-media.s3.amazonaws.com%2Fpublic%2Fimages%2Fd0ed419e-58e4-48c4-9c6f-82519a0954ee_3803x1935.png "[ Left X-axis: Index data. (🟦) | Right X-axis: Volatility of the index. (🟥) ] | Data as of 03/01/2024 market close. |")
Figure 57. DB Japan Dividend ER.
[ Left Y-axis: Index data. (🟦) | Right Y-axis: Volatility of the index. (🟥) ]
![[ Left X-axis: Index data. (🟦) | Right X-axis: Volatility of the index. (🟥) ] | Data as of 03/01/2024 market close. |](https://substackcdn.com/image/fetch/$s_!cgn6!,f_auto,q_auto:good,fl_progressive:steep/https%3A%2F%2Fsubstack-post-media.s3.amazonaws.com%2Fpublic%2Fimages%2F5e92d0c3-465c-4b29-bf61-3cede20dbe90_3802x1944.png "[ Left X-axis: Index data. (🟦) | Right X-axis: Volatility of the index. (🟥) ] | Data as of 03/01/2024 market close. |")
Figure 58. Deutsche Bank Japan Gross Equity Futures CTA Index.
[ Left Y-axis: Index data. (🟦) | Right Y-axis: Volatility of the index. (🟥) ]
![[ Left X-axis: Index data. (🟦) | Right X-axis: Volatility of the index. (🟥) ] | Data as of 03/01/2024 market close. |](https://substackcdn.com/image/fetch/$s_!DDf2!,f_auto,q_auto:good,fl_progressive:steep/https%3A%2F%2Fsubstack-post-media.s3.amazonaws.com%2Fpublic%2Fimages%2F79f4a489-2dd5-407d-ae99-9d8d07db93de_3800x1924.png "[ Left X-axis: Index data. (🟦) | Right X-axis: Volatility of the index. (🟥) ] | Data as of 03/01/2024 market close. |")
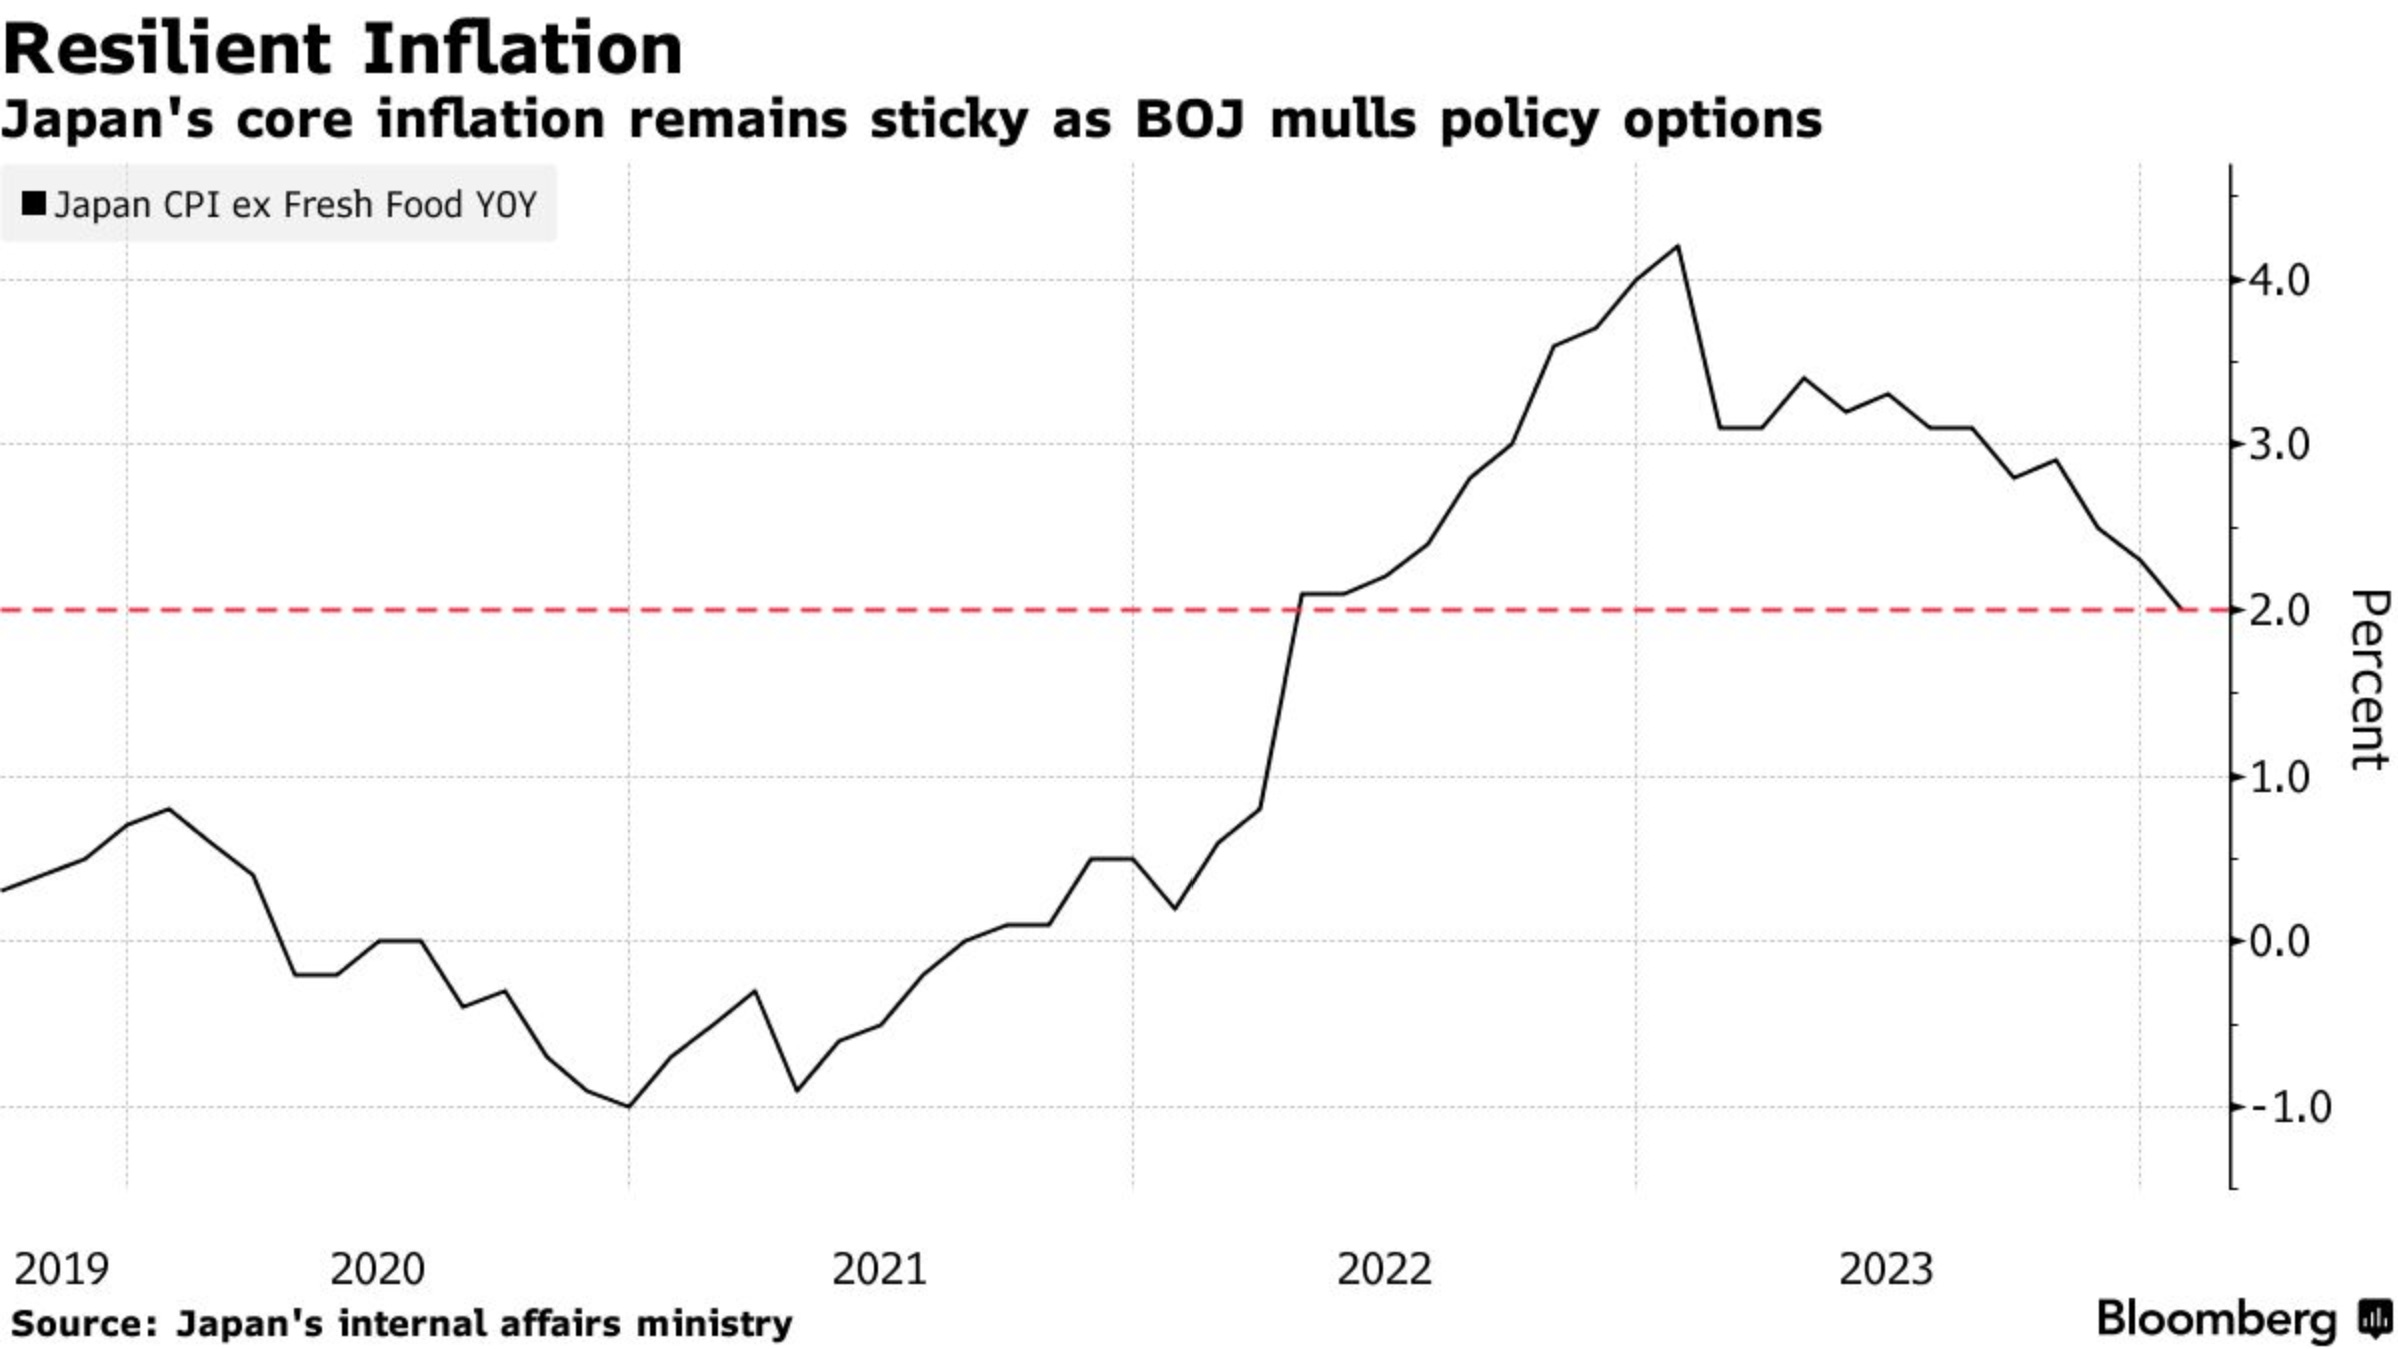
Japan has achieved deflation but has caused a technical recession; given government measures, it is expected to be momentary rather than long-term. The last Core Inflation statistical data releases exceeded economists estimates, but inflation is at the Bank of Japan’s price stability goal.
Figure 59. Japanese Core Inflation Exceeded Economists’ Estimates But Is At The Bank of Japan’s Price Stability Goal.
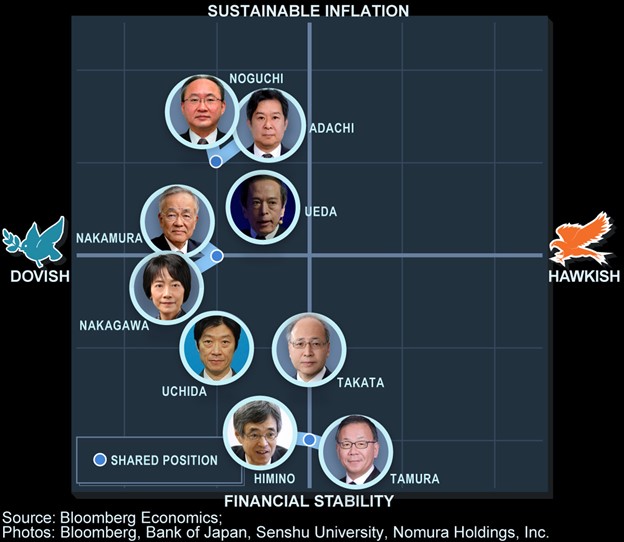
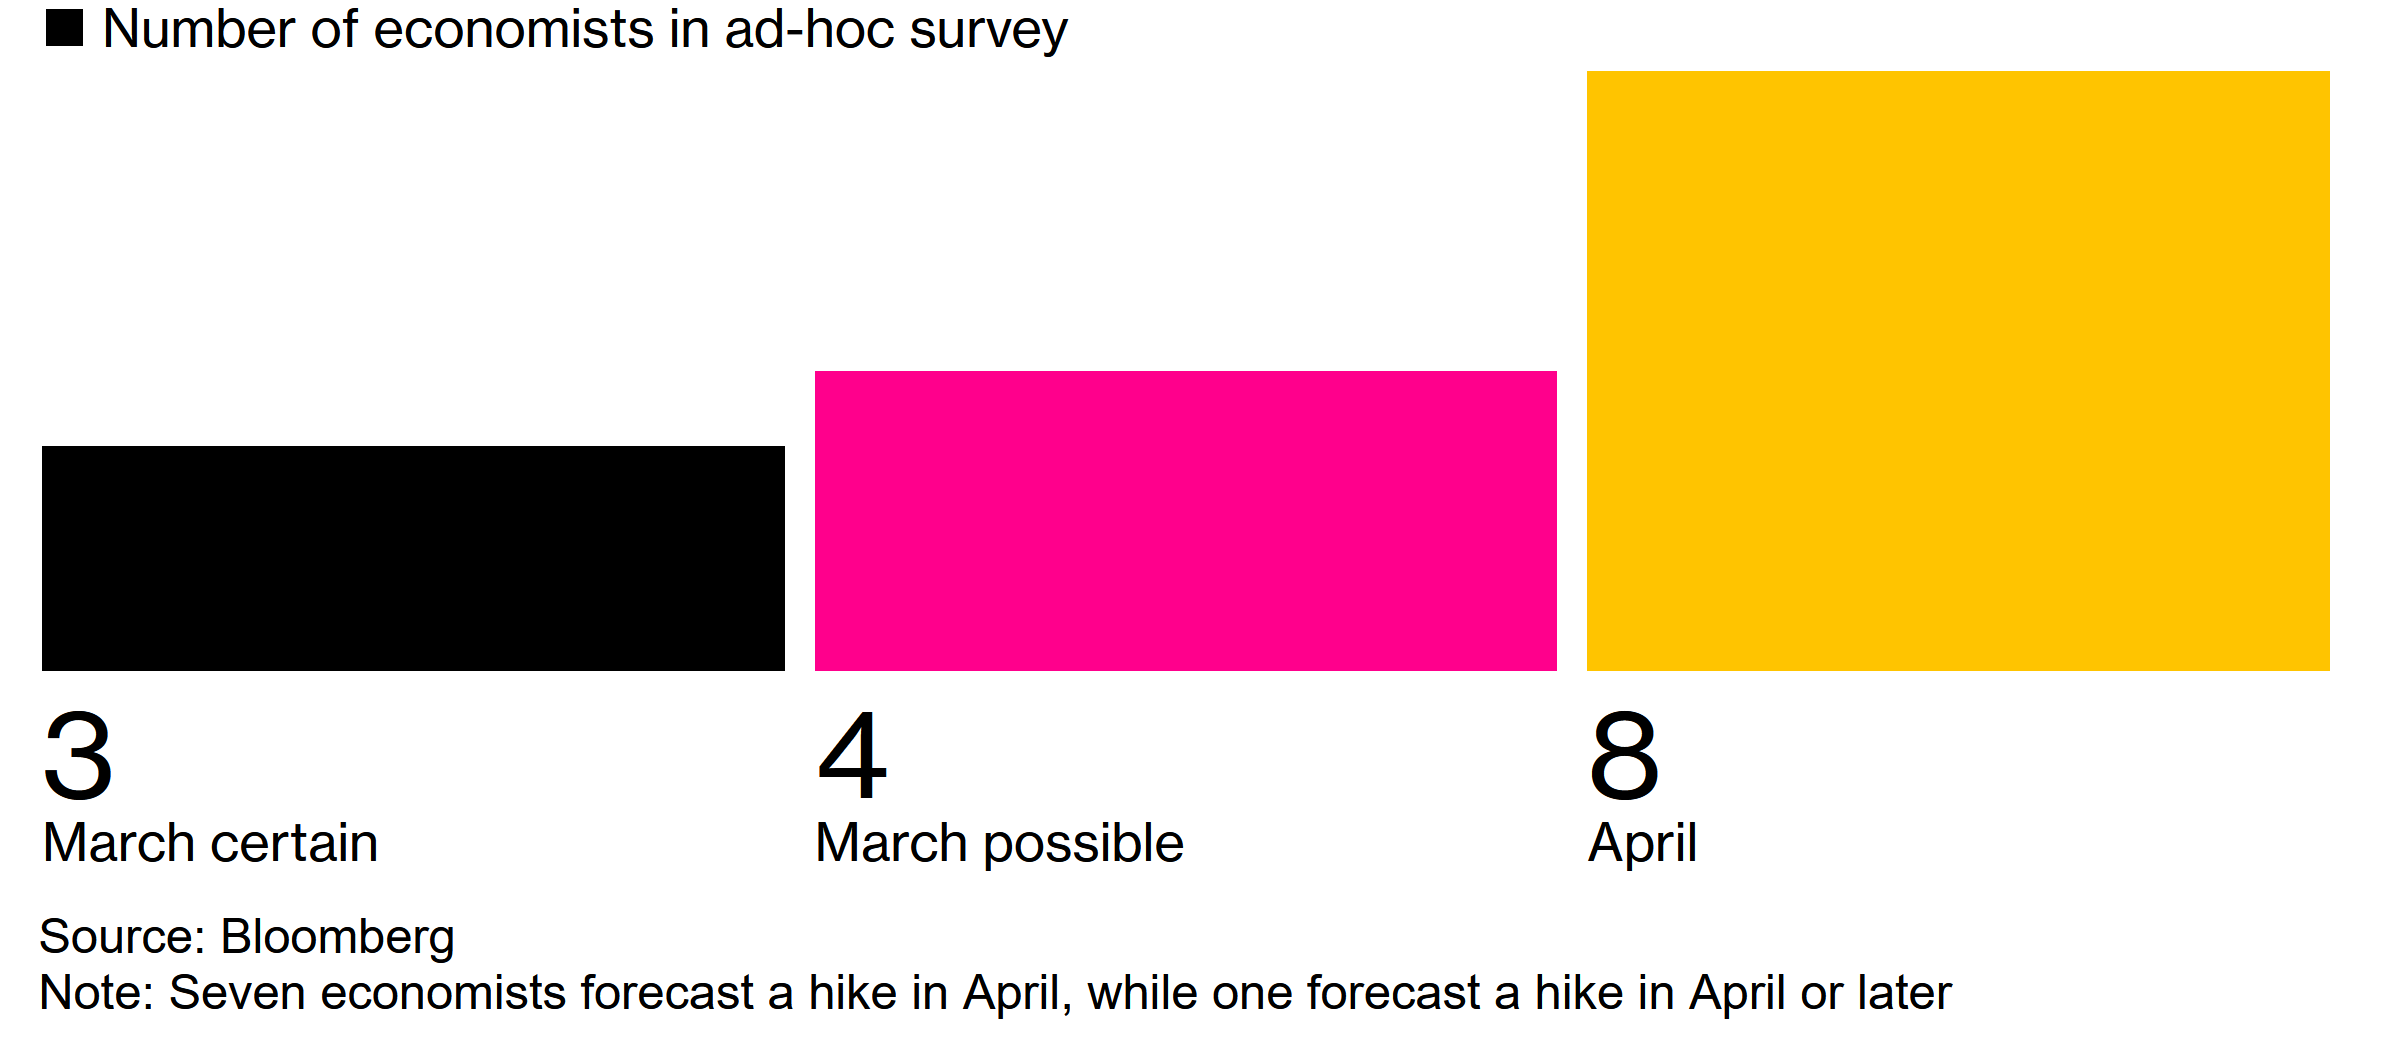
The majority of Bank of Japan members are dovish, but governor Ueda has made hawkish remarks. Economists expect a rate hike in April of this year, but Bank of Japan Governor Ueda did not comment over the rate hike.
Figure 60. Bank of Japan’s Hawk & Dove Members.

Figure 61. Economists Expect A Rate Hike In April Of This Year.
Next week’s Japanese Gross Domestic Product (GDP) data release will likely show recovery of the Japanese economy from the technical recession caused by deflation.
Figure 62. Major Japanese Data Release Expectations.

To conclude, if the data releases are in the range of expectations, the Japanese Yen and the Japanese JGB bond market should rise along with the Japanese markets.
Something I wanted to say:
I may open a hedge fund by 2030; I’m trying to find the correct people to open a hedge fund; there are already venture capitalists interested; for the moment, Quantuan Research keeps being private; and I hedge with my own money. Since I don't want to rush things, I've given myself the 2030 target; if anything, I can keep things as they are now and don't open it, but I wanted to announce this.
Do feel free, as it’s free, to share, leave a comment, and subscribe to Quantuan Research Substack if you want, by using the next buttons.
It's not about the money (the research is free); it's about sending a message (delivering alpha to the reader).
Source: Warner Bros.
Note: If the text in the post is grey (example) it is because the source of data is linked; everything is linked in the text, so it’s not messy to add everything at the end like in some tweets.
